TRADERS’ TIPS
April 2020

For this month’s Traders’ Tips, the focus is Vitali Apirine’s article in this issue, “On-Balance Volume Modified (OBVM).” Here, we present the April 2020 Traders’ Tips code with possible implementations in various software.
New contributor this month: The Zorro Project
You can right-click on any chart to open it in a new tab or window and view it at it’s originally supplied size, often much larger than the version printed in the magazine.
The Traders’ Tips section is provided to help the reader implement a selected technique from an article in this issue or another recent issue. The entries here are contributed by software developers or programmers for software that is capable of customization.

TRADESTATION: APRIL 2020
In “On-Balance Volume Modified (OBVM)” in this issue, author Vitali Apirine presents a new indicator called OBVM that is based on the classic on-balance volume indicator originally developed by Joe Granville. The author has smoothed the OBV calculation and has added a signal line to help the trader identify entry and exit points. Apirine also notes that the OBVM indicator is useful in helping to identify divergences. Here, we are providing TradeStation EasyLanguage code for an indicator and strategy based on the author’s work.
Indicator: OBVM

// On-Balance Volume Modified
// Vitali Apirine
// TASC April 2020

inputs:
	OBVMLength( 7 ),
	SignalLineLength( 10 ) ;

variables:
	OBVValue( 0 ),
	OBVMValue( 0 ),
	SignalLineValue( 0 ) ;

OBVValue = OBV ;
OBVMValue = XAverage( OBVValue,
	OBVMLength ) ;
SignalLineValue = XAverage( OBVMValue,
	SignalLineLength ) ;

Plot1( OBVMValue, "OBVM" ) ;
Plot2( SignalLineValue, "Signal Line" ) ;


Strategy: OBVM

// On-Balance Volume Modified
// Vitali Apirine
// TASC April 2020

inputs:
	OBVMLength( 7 ),
	SignalLineLength( 10 ) ;

variables:
	OBVValue( 0 ),
	OBVMValue( 0 ),
	SignalLineValue( 0 ) ;

OBVValue = OBV ;
OBVMValue = XAverage( OBVValue,
	OBVMLength ) ;
SignalLineValue = XAverage( OBVMValue,
	SignalLineLength ) ;

if OBVMValue crosses over
	SignalLineValue then
	Buy next bar at Market
else if OBVMValue crosses under
	SignalLineValue then
	SellShort next bar at Market ;
To download the EasyLanguage code, please visit our TradeStation and EasyLanguage support forum. The files based on this article can be found here: https://community.tradestation.com/Discussions/Topic.aspx?Topic_ID=168100. The filename is “TASC_APR2020.ZIP.” For more information about EasyLanguage in general, please see: https://www.tradestation.com/EL-FAQ.
A sample chart is shown in Figure 1.

FIGURE 1: TRADESTATION. The OBVM strategy and indicator are shown on a daily TradeStation chart of the Dow Jones Industrial Average.
This article is for infor-mational purposes. No type of trading or investment recommendation, advice, or strategy is being made, given, or in any manner provided by TradeStation Securities or its affiliates.
—Doug McCrary
TradeStation Securities, Inc.
www.TradeStation.com
BACK TO LIST

eSIGNAL: APRIL 2020
For this month’s Traders’ Tip, we’re providing the study “On-balance volume modified.efs” based on the article in this issue by Vitali Apirine. The study smooths the classic on-balance volume indicator by Joe Granville and adds a signal line.
The study contains formula parameters that may be configured through the edit chart window (right-click on the chart and select “edit chart”). A sample chart implementing the indicator is shown in Figure 2.

FIGURE 2: eSIGNAL. Here is an example of the study plotted on a daily chart of IBM.
To discuss this study or download a complete copy of the formula code, please visit the EFS Library Discussion Board forum under the forums link from the support menu at www.esignal.com or visit our EFS KnowledgeBase at https://www.esignal.com/support/kb/efs/. The eSignal formula script (EFS) is also available for copying & pasting below.
/**********************************
Provided By:
Copyright 2019 Intercontinental Exchange, Inc. All Rights Reserved.
eSignal is a service mark and/or a registered service mark of Intercontinental Exchange, Inc.
in the United States and/or other countries. This sample eSignal Formula Script (EFS)
is for educational purposes only.
Intercontinental Exchange, Inc. reserves the right to modify and overwrite this EFS file with each new release.

Description:
   On-Balance Volume Modified (OBVM)
   by Vitali Apirine


Version:            1.00  02/06/2020

Formula Parameters:                     Default:
Period_1                                7
Period_2                                10

Notes:
The related article is copyrighted material. If you are not a subscriber
of Stocks & Commodities, please visit www.traders.com.

**********************************/
var fpArray = new Array();
var bInit = false;

function preMain() {
    setStudyTitle("On-Balance Volume Modified (OBVM)");
    setCursorLabelName("OBVM", 0);
    setCursorLabelName("Signal line", 1);
    setPriceStudy(false);
    setDefaultBarFgColor(Color.RGB(0x00,0x94,0xFF), 0);
    setDefaultBarFgColor(Color.RGB(0xFE,0x69,0x00), 1);
    setPlotType( PLOTTYPE_LINE , 0 );
    setPlotType( PLOTTYPE_LINE , 1 );


    var x=0;
    fpArray[x] = new FunctionParameter("Period_1", FunctionParameter.NUMBER);
	with(fpArray[x++]){
        setLowerLimit(1);
        setDefault(7);
    }
    fpArray[x] = new FunctionParameter("Period_2", FunctionParameter.NUMBER);
	with(fpArray[x++]){
        setLowerLimit(1);
        setDefault(10);
    }

}

var bVersion = null;
var xOBVM = null;
var Sigline = null;
var xOBV = null;


function main(Period_1,Period_2) {
    if (bVersion == null) bVersion = verify();
    if (bVersion == false) return;

    if ( bInit == false ) {
        xOBV = obv();
        xOBVM = ema(Period_1, xOBV);
        Sigline = ema(Period_2, xOBVM);
        bInit = true;
    }

    return [xOBVM.getValue(0), Sigline.getValue(0)]
}

function verify(){
    var b = false;
    if (getBuildNumber() < 779){

        drawTextAbsolute(5, 35, "This study requires version 10.6 or later.",
            Color.white, Color.blue, Text.RELATIVETOBOTTOM|Text.RELATIVETOLEFT|Text.BOLD|Text.LEFT,
            null, 13, "error");
        drawTextAbsolute(5, 20, "Click HERE to upgrade.@URL=https://www.esignal.com/download/default.asp",
            Color.white, Color.blue, Text.RELATIVETOBOTTOM|Text.RELATIVETOLEFT|Text.BOLD|Text.LEFT,
            null, 13, "upgrade");
        return b;
    }
    else
        b = true;

    return b;
}
—Eric Lippert, eSignal,
an Interactive Data company
800 779-6555,
www.eSignal.com
BACK TO LIST

WEALTH-LAB: APRIL 2020
Long-time readers of this Traders’ Tips section may have noticed a tradition of our showing readers how trading ideas can get done without coding. Since the topic this month is a simple one, which is an EMA applied to OBV, it makes this month’s OBVM indicator a natural target for another codeless exercise. Wealth-Lab’s strategy from rules selection allows users to produce a complete trading strategy from the building blocks known as rules.
Realizing that the original OBV’s character is pretty wiggly, the creators of Wealth-Lab have for some time provided its nonprogramming users with a set of smoothed OBV rules. To make possible the OBVM signal line crossovers as per Apirine’s article, we added respective conditions to our Community.Rules project, a library aimed at expanding the capabilities for nonprogrammers.
After installing or updating the library, start by choosing new strategy from rules. Then drag and drop an entry rule and an exit rule (for example, “buy(sell) at market”). Now it’s time to add OBVM conditions. Pair the “OBVM crosses above (below) signal line” condition (from the on-balance volume group) with the entry (exit) condition by dragging and dropping onto it.
And as suggested by Apirine, you might want to combine OBVM with other conditions because OBVM isn’t considered a standalone indicator.
The default lookback periods are 7 for OBVM and 10 for its signal line. As a final step, click the icon next to the lookback period to expose it as a “slider” at the bottom left. Then, as you drag it to change the indicator’s period, the chart will dynamically reflect the change, and so will your trading system’s backtest performance.
A sample chart is shown in Figure 3.

FIGURE 3: WEALTH-LAB. The “strategy from rules” window in Wealth-Lab 6 illustrates the process of dragging and dropping OBVM conditions to arrive at a plain-vanilla trading system. Here, we demonstrate choosing the rules for crossover of the OBVM with its signal line.
—Gene (Eugene) Geren, Wealth-Lab team
MS123, LLC
www.wealth-lab.com
BACK TO LIST

NEUROSHELL TRADER: APRIL 2020
The on-balance volume modified (OBVM) indicator described by Vitali Apirine in his article in this issue can be easily implemented in NeuroShell Trader by combining two of NeuroShell Trader’s 800+ indicators. To implement the indicators, select new indicator from the insert menu and use the indicator wizard to set up the following indicators:
OBVM:	ExpAvg( CumSum( OBV( Close, Volume, 1), 0), 7)

OBVM Signal:	ExpAvg( OBVM, 10)
Users of NeuroShell Trader can go to the Stocks & Commodities section of the NeuroShell Trader free technical support website to download a copy of this or any previous Traders’ Tips.
A sample chart is shown in Figure 4.

FIGURE 4: NEUROSHELL TRADER. This NeuroShell Trader chart shows the on-balance volume modified (OBVM) indicator applied to the Dow Jones Industrial Average.
—Marge Sherald, Ward Systems Group, Inc.
301 662-7950, sales@wardsystems.com
www.neuroshell.com
BACK TO LIST

AIQ: APRIL 2020
The importable AIQ EDS file based on Vitali Apirine’s article in this issue, “On-Balance Volume Modified,” can be obtained on request via email to info@TradersEdgeSystems.com. The code is also available below.
I coded the indicator described by the author and also coded a simple buy-sell on crossovers of the indicator. I tested the long side in the AIQ EDS module. Figure 5 shows the backtest results over the last 10 years using the Nasdaq 100 list of stocks.

FIGURE 5: AIQ. Sample backtest results are shown for the last 10 years using the Nasdaq 100 list of stocks.
!ON-BALANCE VOUUME MODIFIED (OBVM)
!Author: Vitali Apirine, TASC Apr 2020
!Coded by: Richard Denning 2/9/20
!www.TradersEdgeSystems.com

!ON BALANCE VOLUME:
C	is [close].
C1	is val([close],1).

!OBV THAT HAS SAME SHAPE AS BUILT-IN OBV INDICATOR
DaySum	is hasdatafor(2000).
F 	is iff(C > C1,1,iff(C < C1,-1,0)).
VolSum1 	is Sum([volume] / 1000 * F, DaySum).
VolSum2 	is 1000 + VolSum1.
OBVv1 	is iff(FirstDataDate() >= Reportdate(),1000,VolSum2).

!ON BALANCE VOLUME MODIFIED:
!Hard coded version:
len1 is 7.
len2 is 10.
VVV is expavg(OBVv1,len1).
SigVVV is expavg(VVV,len2).

!ON BALANCE VOULUME MODIFIED (***preferred version***):
!Using built-in OBV indicator (runs much faster)
pd1 is 7.
pd2 is 10.
OBVM is expavg([OBV],pd1).
sigOBVM is expavg(OBVM,pd2).
—Richard Denning
info@TradersEdgeSystems.com
for AIQ Systems
BACK TO LIST

TRADERSSTUDIO: APRIL 2020
The importable TradersStudio files based on Vitali Apirine’s article in this issue, “On-Balance Volume Modified (OBVM),” can be obtained on request via email to info@TradersEdgeSystems.com. The code is also available below.
'ON-BALANCE VOUUME MODIFIED (OBVM)
'Author: Vitali Apirine, TASC Apr 2020
'Coded by: Richard Denning 2/9/20
'www.TradersEdgeSystems.com

'FUNCTION RETURNS OBVM AND sigOBVM:
Function OBVM(len1, len2, ByRef sigOBVM)
Dim daySum, F, volSum1, volSum2, OBV
daySum = 500
F = IIF(C > C[1],1,IIF(C < C[1],-1,0))
volSum1 = Summation(V / 1000 * F, daySum)
volSum2 = 1000 + volSum1
OBV = IIF(CurrentBar = FirstBar,1000,volSum2)
OBVM = XAverage(OBV,len1)
sigOBVM = XAverage(OBVM,len2)
End Function
'---------------------------------------------
'INDICATOR PLOT:
Sub OBVM_IND(len1,len2)
'default len1=7, len2=10
Dim theOBVM As BarArray
Dim sigOBVM As BarArray
If BarNumber = FirstBar Then sigOBVM = 0
theOBVM = OBVM(len1,len2,sigOBVM)
plot1(theOBVM)
plot2(sigOBVM)
End Sub
'----------------------------------------------
SIMPLE CROSSOVER TRADING SYSTEM THAT USES OBVM:
Sub OBVM_sys(len1,len2)
Dim theOBVM As BarArray
Dim sigOBVM As BarArray
If BarNumber = FirstBar Then
 sigOBVM = 0
 theOBVM = 0
End If
theOBVM = OBVM(len1,len2,sigOBVM)
If CrossesOver(theOBVM,sigOBVM) Then
 Buy("LE",1,0,Market,Day)
End If
If CrossesUnder(theOBVM,sigOBVM) Then
 ExitLong("LX","",1,0,Market,Day)
End If
End Sub
'----------------------------------------------
I coded the indicator described by the author. Figure 6 shows the OMVM indicator using the default lengths of 7 and 10 bars on a chart of Yahoo! (YHOO) with trading signals. I am also providing a simple trading system that goes long on cross-ups of the OBVM over the signal line and exits the long on cross-downs. Figure 7 shows the equity curve trading 100 shares per trade of the Nasdaq 100 stocks.
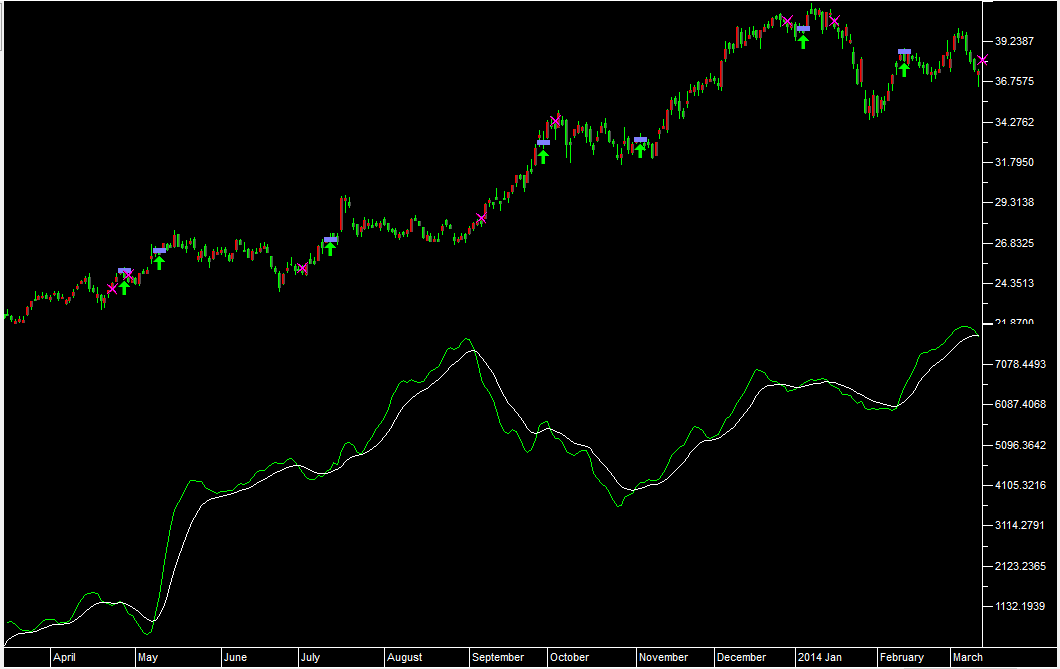
FIGURE 6: TRADERSSTUDIO. This shows the OBVM indicator on chart of YHOO with trading system signals.
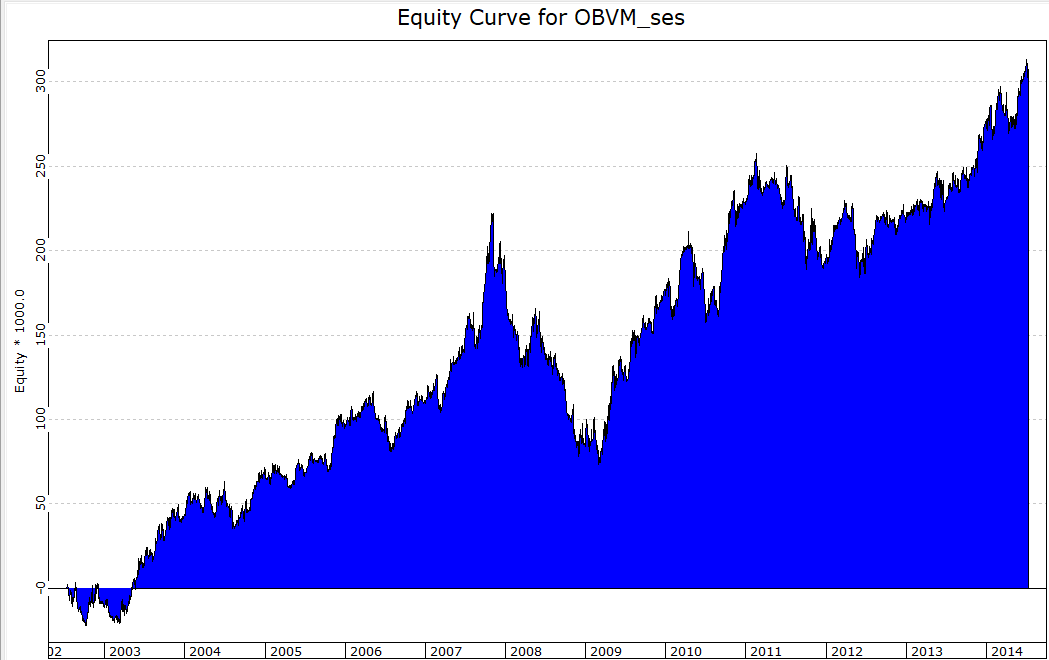
FIGURE 7: TRADERSSTUDIO. Displayed here is the sample equity curve trading 100 shares per trade of the NASDAQ 100 stocks.
—Richard Denning
info@TradersEdgeSystems.com
for TradersStudio
BACK TO LIST

NINJATRADER: APRIL 2020
The OBVM indicator, as discussed by Vitali Apirine in his article in this issue, “On-Balance Volume Modified (OBVM),” is available for download at the following links for NinjaTrader 8 and for NinjaTrader 7:
Once the file is downloaded, you can import the indicator into NinjaTader 8 from within the control center by selecting Tools → Import → NinjaScript Add-On and then selecting the downloaded file for NinjaTrader 8. To import into NinjaTrader 7, from within the control center window, select the menu File → Utilities → Import NinjaScript and select the downloaded file.
You can review the indicator source code in NinjaTrader 8 by selecting the menu New → NinjaScript Editor → Indicators from within the control center window and selecting the OBVM file. You can review the indicator source code in NinjaTrader 7 by selecting the menu Tools → Edit NinjaScript → Indicator from within the control center window and selecting the OBVM file.
NinjaScript uses compiled DLLs that run native, not interpreted, to provide you with the highest performance possible.
A sample chart implementing the indicator is shown in Figure 8.

FIGURE 8: NINJATRADER. The OBVM indicator is shown running on daily chart of the Dow Jones Industrial Average emini futures from April 16, 2019 to February 14, 2020.
—Raymond Deux & Chris Lauber
NinjaTrader, LLC
www.ninjatrader.com
BACK TO LIST

TRADENAVIGATOR: APRIL 2020
We’re making available a file for download within the Trade Navigator library to make it easy for users to implement the on-balance volume modified (OBVM) indicator, as discussed in the article in this issue by Vitali Apirine.
The file name is “SC202004”. To download it, click on Trade Navigator’s blue telephone button, select download special file, and replace the word “upgrade” with “SC202004” (without the quotes). Then click the start button. When prompted to upgrade, click the yes button. If prompted to close all software, click on the continue button. Your library will now download.
This library contains four functions, named “OBVM,” “OBVM signal line,” “OBVM above,” and “OBVM below.” It also contains two studies named “OBVM” and “OBVM crosses.”
Manually creating indicators
If you would like to create these indicators manually, click on the edit dropdown menu and open the trader’s toolbox (or use CTRL+T) and click on the functions tab. Click the new button and a new function dialog window will open. In its text box, type in the code. Ensure that there are no extra spaces at the end of each line. When completed, click on the verify button. You may be presented with an add inputs pop-up message if there are variables in the code. If so, click the yes button, then enter a value in the default value column. If all is well, when you click on the function tab, the code you entered will convert to italic font. Now click on the save button and type a name for the function.
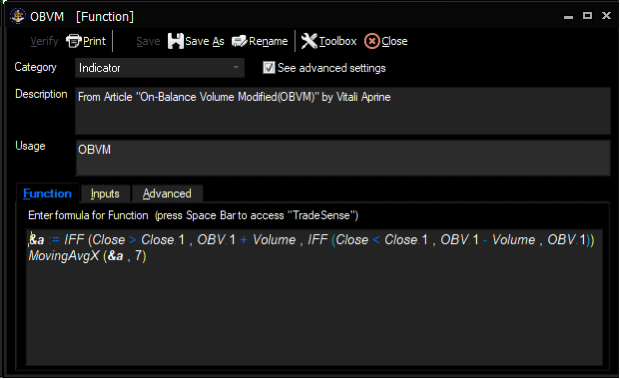
FIGURE 9: TRADE NAVIGATOR. Here, the code is shown for the indicator OBVM.
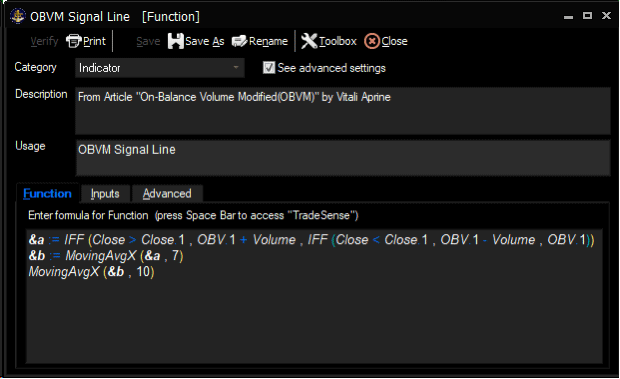
FIGURE 10: TRADE NAVIGATOR. Here, the code is shown for the indicator “OBVM signal line.”
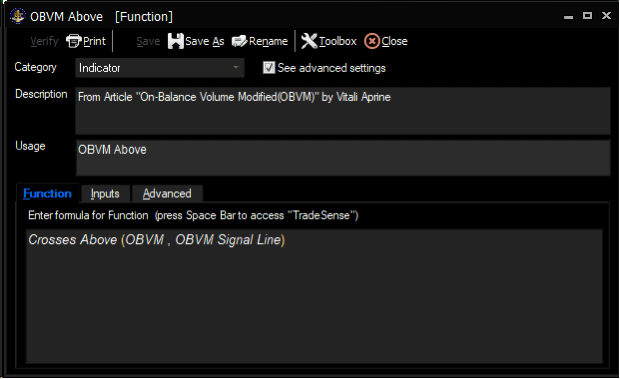
FIGURE 11: TRADE NAVIGATOR. Here, the code is shown for the indicator named “OBVM above.”
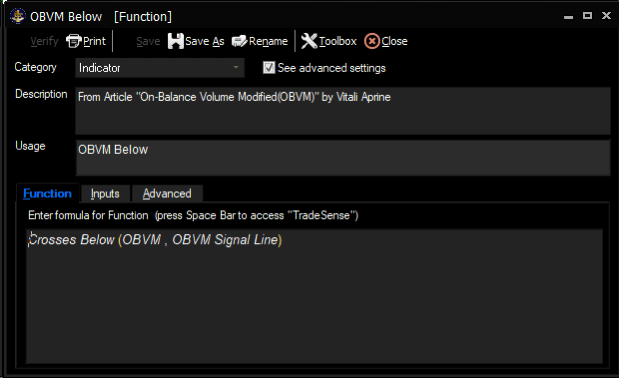
FIGURE 12: TRADE NAVIGATOR. Here, the code is shown for the indicator named “OBVM below.”
Adding to your chart
Once complete, you can insert these tools onto your chart by opening the charting dropdown menu, selecting the add to chart command, then on the indicators or studies tab, find your named tool, select it, and click on the add button. Repeat this procedure to add additional tools as well if you wish.
If you have any difficulties creating or using the indicators and/or studies, our friendly technical support staff is happy to help either by phone or by live chat. Happy trading!
—Genesis Financial Technologies
Tech support 719 884-0245
www.TradeNavigator.com
BACK TO LIST

THE ZORRO PROJECT: APRIL 2020
In his article in this issue, Vitali Apirine proposes a modified on-balance volume indicator (OBVM) by smoothing the original OBV with a 7-day EMA, and applying another 10-day EMA for generating a signal line. According to the author, crossovers and divergences can be used for trade signals. Let’s put that to the test.
Here is the OBVM code in C for the Zorro platform:
var OBVM(vars Prices, int Period)
{
 	vars OBVData = series(OBV(Prices, marketVol()));
return EMA(OBVData, Period);
}

var OBVMSignal(vars OBVMData, int Period)
{
return EMA(OBVMData, Period);
}
The resulting OBVM and signal curves for the S&P 500 are shown in Figure 13.
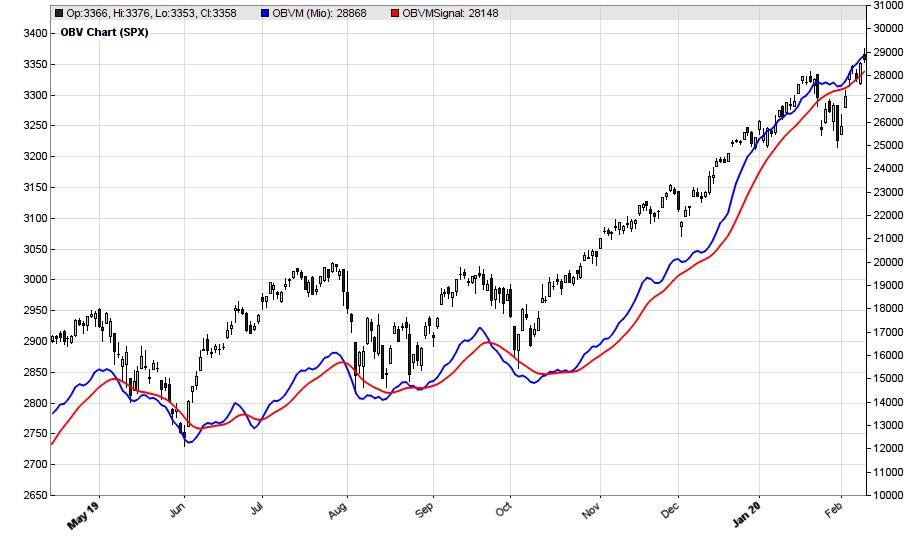
FIGURE 13: ZORRO. Example OBVM and signal curves for the S&P 500 are shown.
Since the OBV follows the sign of price changes, it is strongly correlated to the price curve. We will now test the OBVM’s usefulness for trade signals. Following the author’s suggestions, we’ll use a crossover of the OBVM and the OBVM signal for entering a short or long SPY position. Of course, it’s no problem to manually tweak the indicator and signal periods (7 and 10 were used in the example chart) until they produce great results. But that would not work in live trading, so we optimize them with walk-forward analysis. Here is the C script for Zorro that trades SPY on SPX-OBVM crossovers:
function run()
{
	BarPeriod = 1440; // daily bars

	assetAdd("SPX","STOOQ:^SPX"); // S&P 500 index, from Stooq
	assetAdd("SPY","STOOQ:SPY.US");
	asset("SPY");

	NumWFOCycles = 5; // activate walk forward analysis
	set(PARAMETERS); // do a parameter optimization
	int ShortPeriod = optimize(7,3,20);  // optimize periods
	int LongPeriod = ShortPeriod*optimize(1.3, 1.1, 2.0);

	asset("SPX");
	vars Prices = series(priceClose());
	vars OBVMData = series(OBVM(Prices,ShortPeriod));
	vars OBVMSignals = series(OBVMSignal(OBVMData,LongPeriod));

	asset("SPY");
	if(crossOver(OBVMData,OBVMSignals))
		enterLong();
	else if(crossUnder(OBVMData,OBVMSignals))
		enterShort();

	plot("OBVM (Mio)",OBVMData[0]/1000000,NEW|LINE,BLUE);
	plot("OBVMSignal",OBVMSignals[0]/1000000,LINE,RED);
}
The system produces a positive result (a 20% annual return), but the equity curve (the blue bars) is not really convincing (Figure 14).
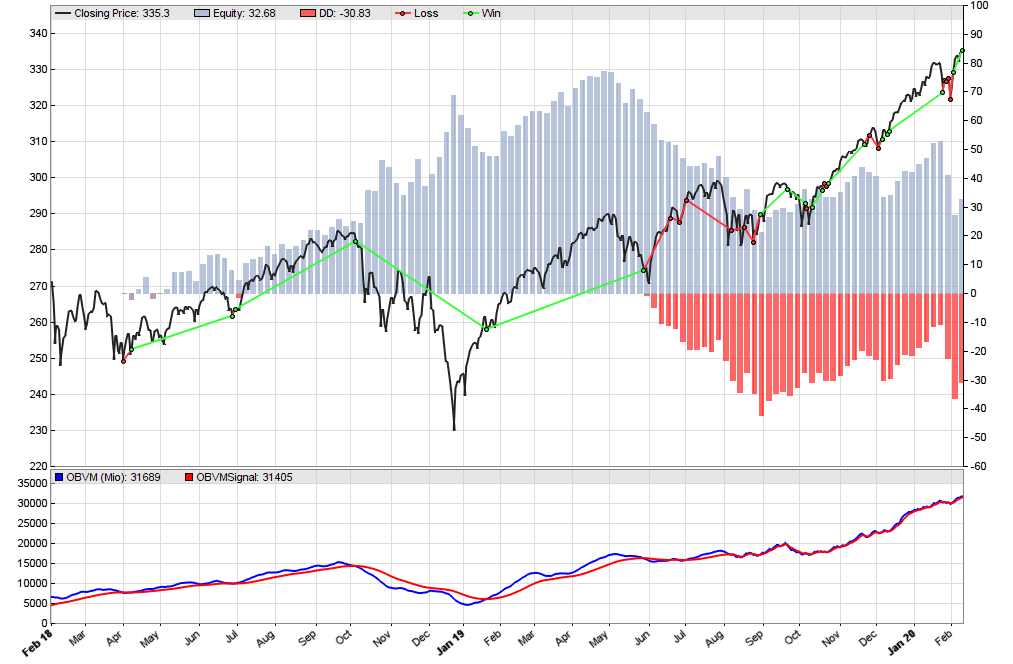
FIGURE 14: ZORRO. The equity curve (blue bars).
We can see that the smoothed OBV crossover system is not superior to a simple SPY buy-and-hold strategy. But the indicator can likely be improved with different signal generation, a better smoothing function than the EMA, and/or adding an anti-whipsaw or trend-detection filter.
The script for the OBVM indicator and the OBVM trading system can be downloaded from https://financial-hacker.com/scripts2020.zip. The Zorro platform can be downloaded from https://zorro-project.com/download.php.
—Petra Volkova
Zorro Project by oP Group
www.zorro-project.com
BACK TO LIST
MICROSOFT EXCEL: APRIL 2020
In his article in this issue, Vitali Apirine takes us on a spin of Joe Granville’s on-balance volume (OBV) indicator. Apirine first suggests a look at how well the classic OBV correlates to the price action of a given symbol (Figure 15). This serves as a confidence-building step prior to looking at his modified version of the indicator (OBVM).

FIGURE 15: EXCEL, OBV. Here is a look at the correlation between a 20-day classic on-balance volume (OBV) to price action using the example stock symbol NVDA.
OBV calculations can start at any time in the past. The resulting values will change with the starting point and are not particularly important. Our interest lies in the shapes and trends of the OBV plot as a reflection of buying and selling pressures.
Next, take a look at Apirine’s use of OBVM (Figure 16). In this chart, I plot OBVM(7) and use a 10-bar EMA of OBVM as a signal line. Both of these parameters can be altered in the user controls area. In his article, Apirine demonstrates a few variations on these settings.

FIGURE 16: EXCEL, OBVM(7,10) BULL AND BEAR SIGNALS. Plotted here is an OBVM(7) and a 10-bar EMA of OBVM as a signal line. OBVM crossing above the signal line suggests a bullish change (green) and a cross below is considered a bearish change (red).
OBVM crossing above the signal line suggests a bullish change (green) and a cross below is considered a bearish change (red).
I find it easier to evaluate these signals and the price action that follows by shading the background for the regions between signals (Figure 17). In a complete trading system with full exit and stop logic, I would terminate the shading at these exit points.

FIGURE 17: EXCEL, OBVM. Using shading in Excel creates the bullish and bearish banding seen here.
Lacking proper exit constructs here, I have allowed the shading run until the next crossover signal.
Tesla (TSLA) is currently getting attention in the market news (Figure 18). TSLA is a clear example of the trend of OBVM being more important than the actual value of OBVM.
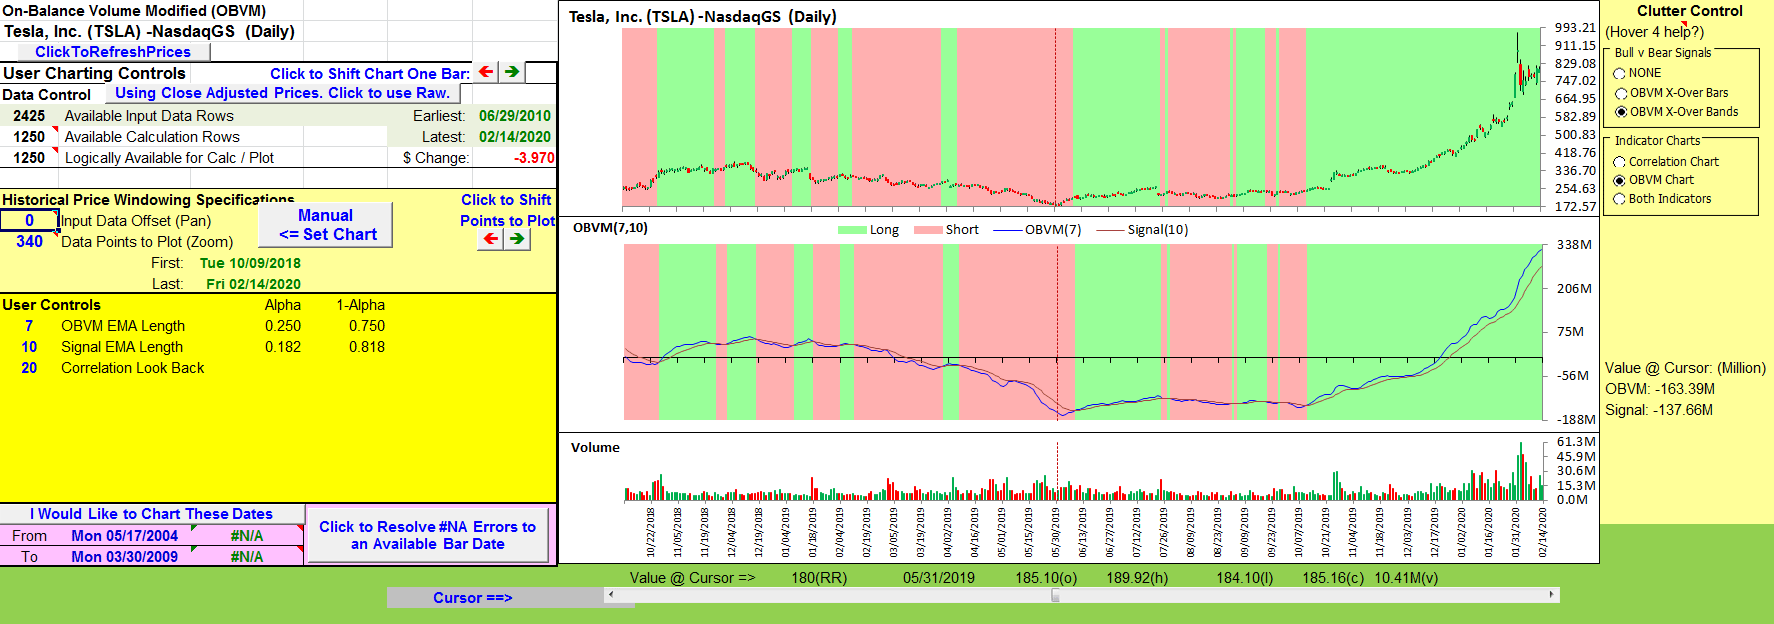
FIGURE 18: EXCEL. An upward OMBV trend, even in negative territory, is a good sign. The example stock symbol used here is TSLA.
These chart displays can be adjusted by way of the buttons in the clutter control area to the right of the charts. This includes the ability to see the correlation and the OBVM charts at the same time (Figure 19).
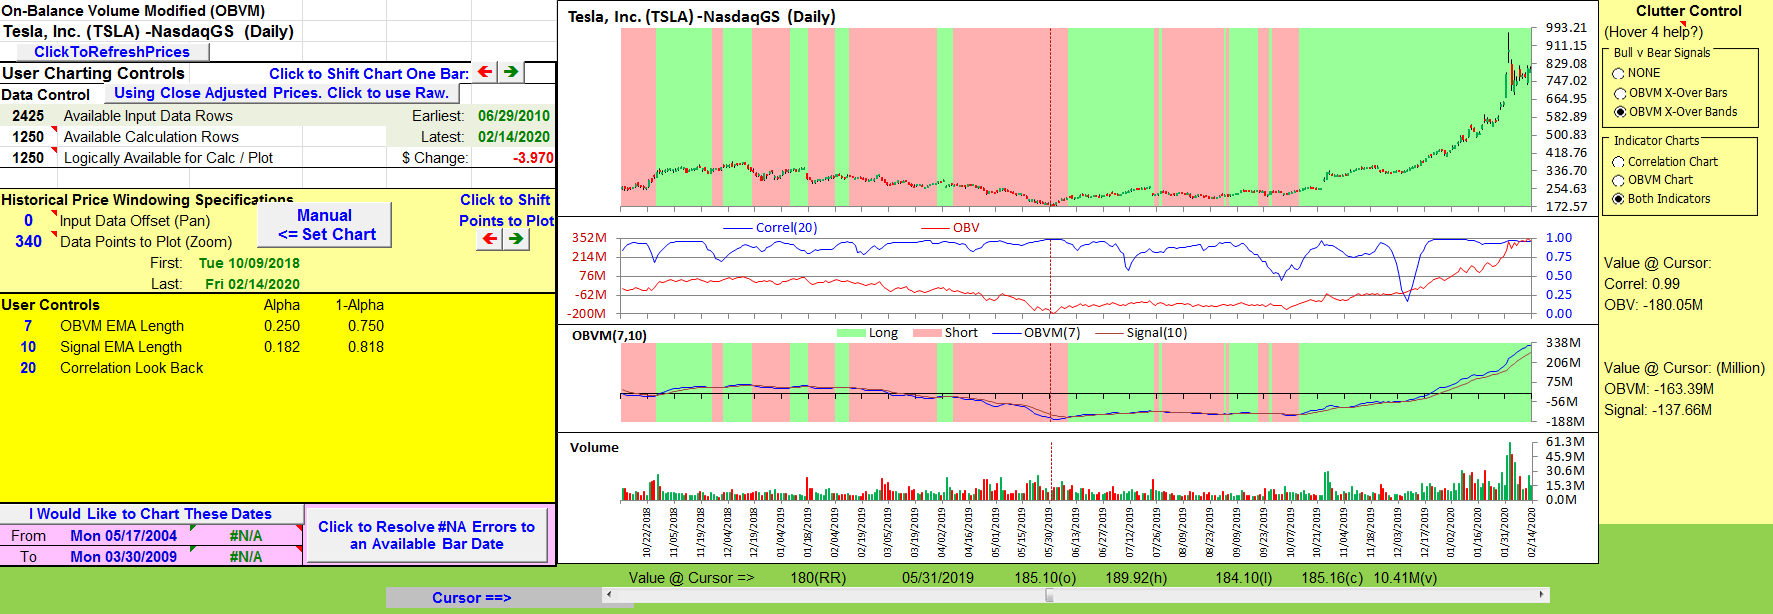
FIGURE 19: EXCEL. You can view both the correlation and the OBVM onscreen at the same time by using the buttons in the “clutter control” area to the right of the chart.
The spreadsheet file can be downloaded here.To successfully download it, follow these steps:
- Right-click on the Excel file link, then
- Select “save as” (or “save target as”) to place a copy of the spreadsheet file on your hard drive.
—Ron McAllister
Excel and VBA programmer
rpmac_xltt@sprynet.com
POSTSCIPT: “ERROR 9” IN EXCEL
On or about January 29, 2020, Yahoo Finance changed the format of the split factor expression used in their historical data downloads. The split expression went from using a slash (/) as in “new share number/old share number” to using a full colon (:) as in “new share number:old share number.”
This caused the then-current version of my VBA code to fail with a “Runtime Error 9: subscript out of range” message.
Fix for “Error 9”
For spreadsheets from the September 2018 issue up to the present (note: it’s already fixed in this month’s spreadsheet), perform the following actions:
Select the debug option to take you into the VBA at the line of code that causes the failure:
CellArray(C_A_RowNdx, C_A_ColNdx + 1) = SplitFactors(1)
Two lines above the failing VBA line is a line that reads:
SplitFactors = Split(CsvColumns(CsvColNdx), "/")
In that line, change the slash (/) to a full colon (:). The corrected line should now read:
SplitFactors = Split(CsvColumns(CsvColNdx), ":")
If you are fixing several spreadsheets and do not want to use a failure to find the fix location, you can use VBA’s FIND dialog (CTRL-F) to look for the following substring:
SplitFactors =
Do include one space and the equal sign in your FIND string. Then select the “current project” option. There should only be one instance.
Spreadsheets prior to the September 2018 issue do not hard fail for this change; they just get weird results in the split columns of the input price data tab (in other words, it’s a soft fail). The reason is that these older spreadsheets used different data retrieval and formatting logic.
To fix the older spreadsheets, perform the following steps:
In the VBA editor, use FIND (CTRL-F). Select the “current project” option, and search for the following:
OtherChar:="/"
You are looking for a hit in a line that reads:
Other:=True, OtherChar:="/", _
This line is part of a multiline block of code starting with a line that reads:
SplitRange.Offset(0, 1).Resize(SpRows, 1).TextToColumns
Change the slash to a colon so that the line reads:
Other:=True, OtherChar:=":", _
—Ron McAllister
BACK TO LIST
Originally published in the April 2020 issue of
Technical Analysis of STOCKS & COMMODITIES magazine.
All rights reserved. © Copyright 2020, Technical Analysis, Inc.


