TRADERS’ TIPS
July 2020

For this month’s Traders’ Tips, the focus is John F. Ehlers’ article in this issue, “Truncated Indicators.” Here, we present the July 2020 Traders’ Tips code with possible implementations in various software.
You can right-click on any chart to open it in a new tab or window and view it at it’s originally supplied size, often much larger than the version printed in the magazine.
The Traders’ Tips section is provided to help the reader implement a selected technique from an article in this issue or another recent issue. The entries here are contributed by software developers or programmers for software that is capable of customization.

TRADESTATION: JULY 2020
In his article “Truncated Indicators” in this issue, author John Ehlers introduces a method that can be used to modify some indicators, improving how accurately they are able to track and respond to price action. By limiting the data range, that is, truncating the data, indicators may be able to better handle extreme price events. A reasonable goal, especially during times of high volatility.
Here, we are providing TradeStation EasyLanguage code for both an indicator and strategy based on the author’s work.
Indicator: Truncated BP Filter
// Truncated BP Filter
// John F. Ehlers
// TASC JUL 2020

inputs:
	Period( 20 ),
	Bandwidth( .1 ),
	Length( 10 ) ;
variables:
	L1( 0 ), G1( 0 ), S1( 0 ),
	count( 0 ), BP( 0 ), BPT( 0 ) ;
arrays:
	Trunc[100]( 0 ) ;

//Standard Bandpass
L1 = Cosine( 360 / Period ) ;
G1 = Cosine( Bandwidth * 360 / Period ) ;
S1 = 1 / G1 - SquareRoot( 1 / ( G1 * G1 ) - 1 ) ;
BP = .5 * ( 1 - S1 ) * ( Close - Close[2] )
	 + L1 * ( 1 + S1 ) * BP[1] - S1 * BP[2] ;

If CurrentBar <= 3 then
	BP = 0 ;

//Stack the Trunc Array
for Count = 100 downto 2
begin
	Trunc[count] = Trunc[count - 1] ;
end ;

//Truncated Bandpass
Trunc[Length + 2] = 0 ;
Trunc[Length + 1] = 0 ;

for count = Length downto 1
begin
	Trunc[count] = .5 * ( 1 - S1 )
		* ( Close[count - 1] - Close[count + 1] )
		+ L1 * ( 1 + S1 ) * Trunc[count + 1]
		- S1 * Trunc[count + 2] ;
end ;

BPT = Trunc[1]; //convert to a variable

Plot1(BP, "BP Filt" ) ;
Plot2( BPT, "Trunc BP Filt") ;
Plot4( 0, "ZL" ) ;

Strategy: Truncated BP Filter

// Truncated BP Filter
// John F. Ehlers
// TASC JUL 2020

inputs:
	Period( 20 ),
	Bandwidth( .1 ),
	Length( 10 ) ;
variables:
	L1( 0 ), G1( 0 ), S1( 0 ),
	count( 0 ), BP( 0 ), BPT( 0 ) ;
arrays:
	Trunc[100]( 0 ) ;

//Standard Bandpass
L1 = Cosine( 360 / Period ) ;
G1 = Cosine( Bandwidth * 360 / Period ) ;
S1 = 1 / G1 - SquareRoot( 1 / ( G1 * G1 ) - 1 ) ;
BP = .5 * ( 1 - S1 ) * ( Close - Close[2] )
	 + L1 * ( 1 + S1 ) * BP[1] - S1 * BP[2] ;

If CurrentBar <= 3 then
	BP = 0 ;

//Stack the Trunc Array
for Count = 100 downto 2
begin
	Trunc[count] = Trunc[count - 1] ;
end ;

//Truncated Bandpass
Trunc[Length + 2] = 0 ;
Trunc[Length + 1] = 0 ;

for count = Length downto 1
begin
	Trunc[count] = .5 * ( 1 - S1 )
		* ( Close[count - 1] - Close[count + 1] )
		+ L1 * ( 1 + S1 ) * Trunc[count + 1]
		- S1 * Trunc[count + 2] ;
end ;

BPT = Trunc[1]; //convert to a variable


if BPT crosses over 0  then
	Buy next bar at Market
else if BPT crosses under 0  Then
	SellShort next bar at Market ;
To download the EasyLanguage code, please visit our TradeStation and EasyLanguage support forum. The files for this article can be found here: https://community.tradestation.com/Discussions/Topic.aspx?Topic_ID=168100. The filename is “TASC_JUL2020.ZIP.” For more information about EasyLanguage in general, please see https://www.tradestation.com/EL-FAQ.
A sample chart is shown in Figure 1.
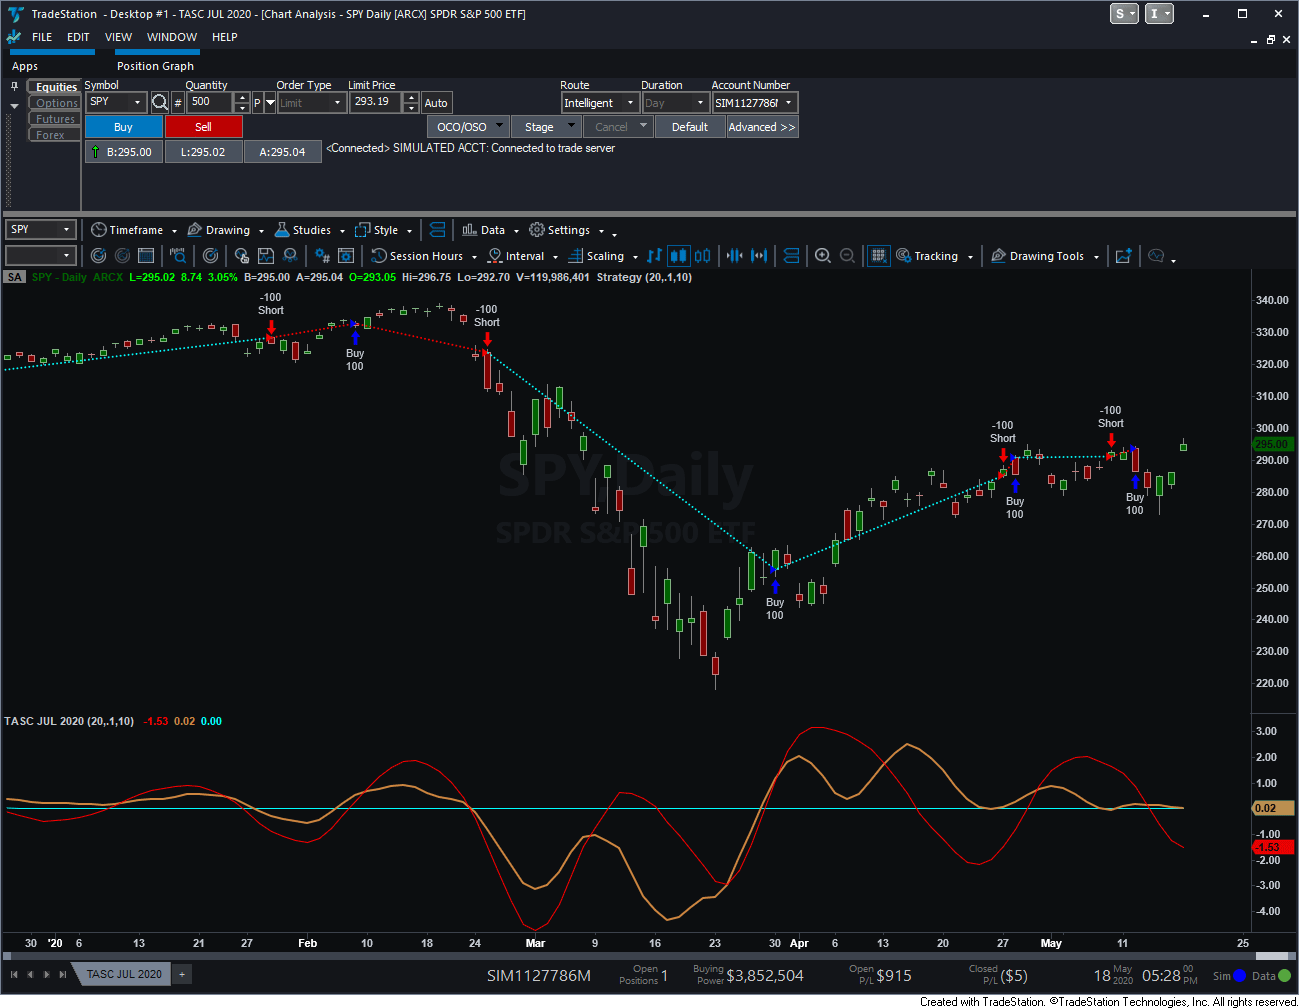
FIGURE 1: TRADESTATION. The truncated bandpass filter indicator and strategy are applied to a daily chart of the SPY ETF.
This article is for informational purposes. No type of trading or investment recommendation, advice, or strategy is being made, given, or in any manner provided by TradeStation Securities or its affiliates.
—Doug McCrary
TradeStation Securities, Inc.
www.TradeStation.com
BACK TO LIST

WEALTH-LAB: JULY 2020
In his article in this issue, “Truncated Indicators,” author John Ehlers shows how to improve a bandpass filter’s ability to reflect price by limiting the data range. Filtering out the temporary spikes and price extremes should positively affect the indicator stability. Enter a new indicator—the TruncatedBandPass filter.
Despite the math behind it may not appear as easy to some, Wealth-Lab proves that prototyping a trading system should not be a complex task. In fact, our strategy from rules feature makes it possible for everyone to achieve without having to invest much effort.
For example, crossovers of the truncated bandpass with zero could indicate a trend change. Let’s see if the idea has merit:
- Step 1. Install (or update) the TASCIndicators library to its most-recent version from our website or using the built-in Extension Manager.
- Step 2. Add an entry and exit block, then drag and drop “Indicator crosses above (below) value” from general indicators under the conditions tab on top of each one (respectively).
- Step 3. For each entry and exit, choose the TruncatedBandPass as Indicator and zero as the value to cross where prompted.
Figure 2 shows an example of creating a rules-based strategy in Wealth-Lab.
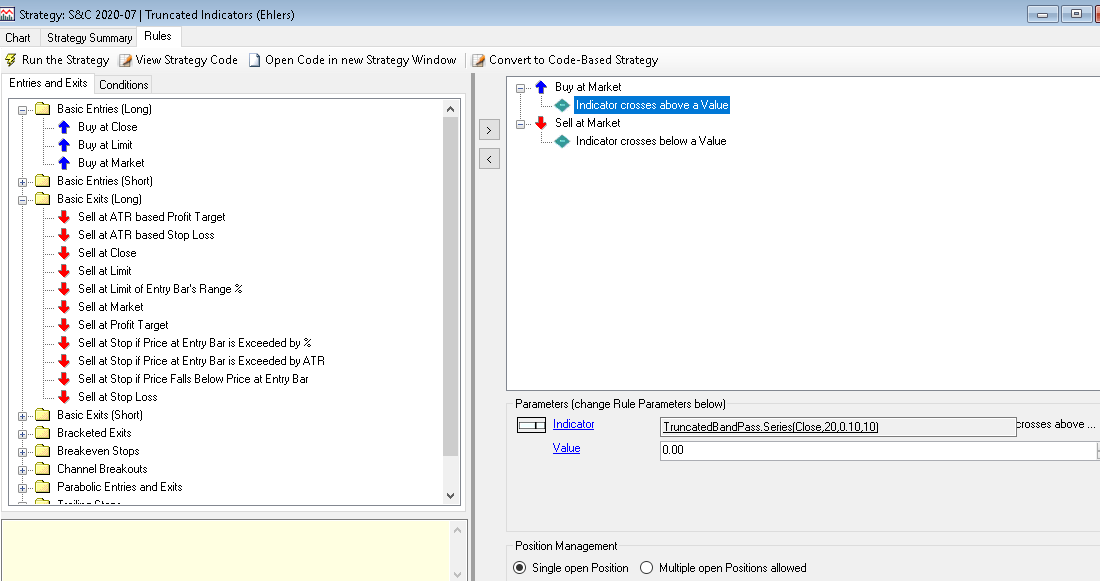
FIGURE 2: WEALTH-LAB. Here is an example of creating a rule-based strategy with the truncated bandpass in Wealth-Lab.
A quick test shows we’re onto something, and with some more tweaking, we may be able to make a trading system out of it, as we’ve done in Figure 3.
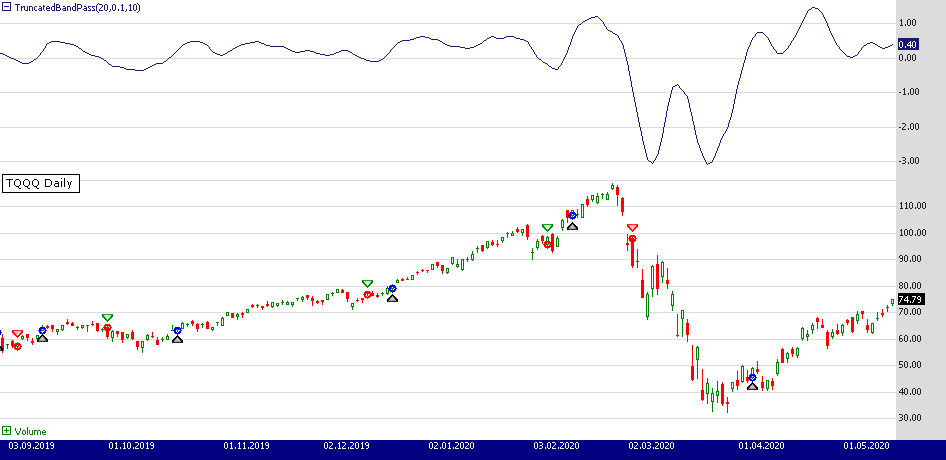
FIGURE 3: WEALTH-LAB. The example trading system is applied to a daily chart of TQQQ. (Data provided by AlphaVantage)
Whether you’ve prototyped the trading system code using our strategy from rules feature described above or whether you’ve downloaded the code from Wealth-Lab (hit Ctrl-O and choose download...), to peek into the code behind it, simply click “Open code in new strategy window.”
Wealth-Lab strategy code (C#):

using System;
using System.Collections.Generic;
using System.Text;
using System.Drawing;
using WealthLab;
using WealthLab.Indicators;
using TASCIndicators;

namespace WealthLab.Strategies
{
	public class TASC2020_07 : WealthScript
	{
		protected override void Execute()
		{
			var tbp = TruncatedBandPass.Series(Close, 20, 0.10, 10);

			HideVolume();
			ChartPane pane1 = CreatePane( 25,true,true);
			PlotSeries( pane1,tbp,Color.MidnightBlue,LineStyle.Solid,1);

			for(int bar = GetTradingLoopStartBar( 21); bar < Bars.Count; bar++)
			{
				if (IsLastPositionActive)
				{
					Position p = LastPosition;

					if (CrossUnder(bar, tbp, 0))
						SellAtMarket( bar + 1, p);
				}
				else
				{
					if (CrossOver(bar, tbp, 0))
						BuyAtMarket( bar + 1);
				}
			}
		}
	}
}
—Robert Sucher & Gene (Eugene) Geren, Wealth-Lab team
MS123, LLC
www.wealth-lab.com
BACK TO LIST

eSIGNAL: JULY 2020
For this month’s Traders’ Tip, we’ve provided the study “TruncatedIndicators.efs” based on the article in this issue by John Ehlers, “Truncated Indicators.” The study is designed to improve cycle indicators by introducing truncation.
The study contains formula parameters that may be configured through the edit chart window (right-click on the chart and select “edit chart”). A sample chart is shown in Figure 4.
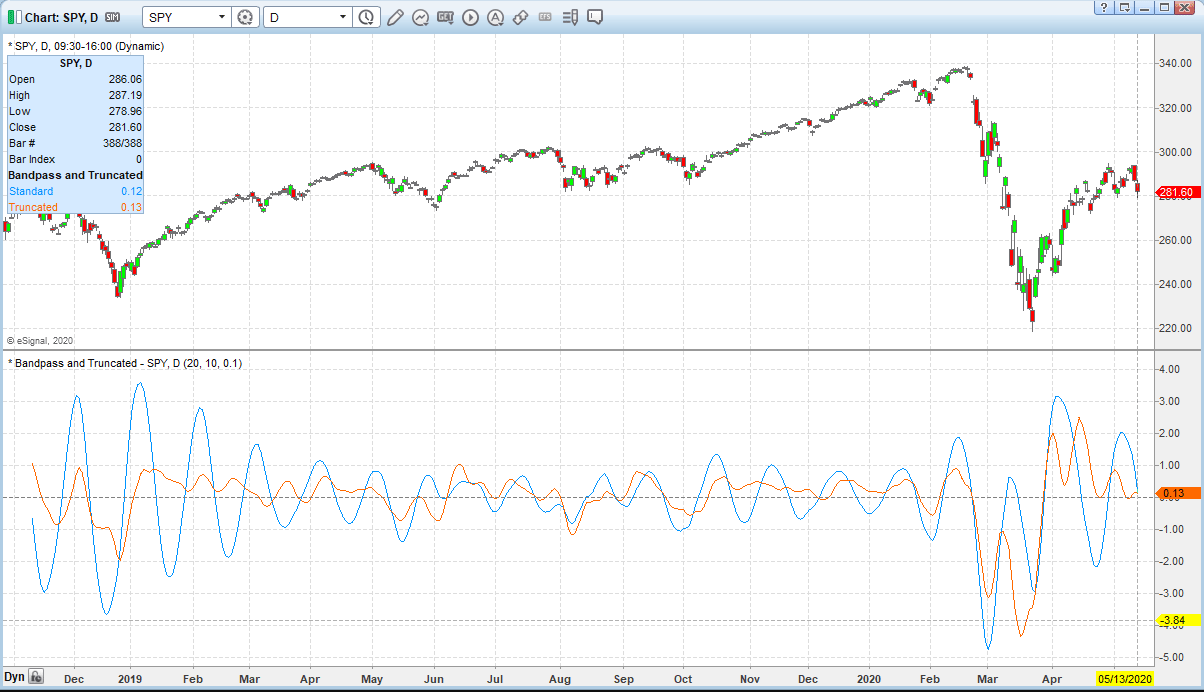
FIGURE 4: ESIGNAL. Here is an example of the study plotted on a daily chart of the SPY.
To discuss this study or download a complete copy of the formula code, please visit the EFS Library Discussion Board forum under the forums link from the support menu at www.esignal.com or visit our EFS KnowledgeBase at https://www.esignal.com/support/kb/efs/.
The eSignal formula script (EFS) is also available for copying & pasting below.
/**********************************
Provided By:
Copyright 2019 Intercontinental Exchange, Inc. All Rights Reserved.
eSignal is a service mark and/or a registered service mark of Intercontinental Exchange, Inc.
in the United States and/or other countries. This sample eSignal Formula Script (EFS)
is for educational purposes only.
Intercontinental Exchange, Inc. reserves the right to modify and overwrite this EFS file with each new release.

Description:
   Truncated Indicators
   by John F. Ehlers


Version:            1.00  05/13/2020

Formula Parameters:                     Default:
Period                                  20
Length                                  10
Bandwidth                               0.1

Notes:
The related article is copyrighted material. If you are not a subscriber
of Stocks & Commodities, please visit www.traders.com.

**********************************/
var fpArray = new Array();
var bInit = false;

function preMain() {
    setStudyTitle("Bandpass and Truncated");
    setCursorLabelName("Standard", 0);
    setCursorLabelName("Truncated", 1);
    setPriceStudy(false);
    setDefaultBarFgColor(Color.RGB(0x00,0x94,0xFF), 0);
    setDefaultBarFgColor(Color.RGB(0xFE,0x69,0x00), 1);
    setPlotType( PLOTTYPE_LINE , 0 );
    setPlotType( PLOTTYPE_LINE , 1 );
    addBand( 0, PLOTTYPE_DOT, 1, Color.grey);


    var x=0;
    fpArray[x] = new FunctionParameter("Period", FunctionParameter.NUMBER);
	with(fpArray[x++]){
        setLowerLimit(1);
        setDefault(20);
    }
    fpArray[x] = new FunctionParameter("Length", FunctionParameter.NUMBER);
	with(fpArray[x++]){
        setLowerLimit(1);
        setUpperLimit(98);
        setDefault(10);
    }
    fpArray[x] = new FunctionParameter("Bandwidth", FunctionParameter.NUMBER);
	with(fpArray[x++]){
        setLowerLimit(0);
        setDefault(.1);
    }

}

var bVersion = null;
var L1 = null;
var G1 = null;
var S1 = null;
var BP = null;
var BP_1 = null;
var BP_2 = null;
var BPT = null;
var Trunc = [];
var xClose = null;


function main(Period,Length,Bandwidth) {
    if (bVersion == null) bVersion = verify();
    if (bVersion == false) return;

    if ( bInit == false ) {
        L1 = Math.cos(2 * Math.PI / Period)
        G1 = Math.cos(Bandwidth * 2 * Math.PI / Period)
        S1 = 1 / G1 - Math.sqrt(1 / (G1*G1) - 1)
        xClose = close();
        BP_1 = 0;
        BP = 0;
        for (var i = 0; i <= 100; i++){
            Trunc[i] = 0
        }

        bInit = true;
    }

    if (getCurrentBarCount() <= Length) return;
    if (getBarState() == BARSTATE_NEWBAR) {
        BP_2 = BP_1;
        BP_1 = BP;
    }

    if (getCurrentBarCount() <= 3) BP = 0;
    else BP = .5 * (1 - S1) * (xClose.getValue(0) - xClose.getValue(-2)) + L1 * (1 + S1) * BP_1 - S1 * BP_2;

    //Stack the Trunc Array
    for (var i = 100; i > 1; i--) {
        Trunc[i] = Trunc[i-1]
    }

    //Truncated Bandpass
    Trunc[Length + 2] = 0;
    Trunc[Length + 1] = 0;
    for (var i = Length; i > 0; i--) {
        Trunc[i] = .5 * (1 - S1) * (xClose.getValue(-i + 1) - xClose.getValue(-i - 1)) + L1 * (1 + S1) * Trunc[i + 1] - S1 * Trunc[i + 2];
    }

    BPT = Trunc[1] //convert to a variable

    return [BP, BPT]
}

function verify(){
    var b = false;
    if (getBuildNumber() < 779){

        drawTextAbsolute(5, 35, "This study requires version 10.6 or later.",
            Color.white, Color.blue, Text.RELATIVETOBOTTOM|Text.RELATIVETOLEFT|Text.BOLD|Text.LEFT,
            null, 13, "error");
        drawTextAbsolute(5, 20, "Click HERE to upgrade.@URL=https://www.esignal.com/download/default.asp",
            Color.white, Color.blue, Text.RELATIVETOBOTTOM|Text.RELATIVETOLEFT|Text.BOLD|Text.LEFT,
            null, 13, "upgrade");
        return b;
    }
    else
        b = true;

    return b;
}
—Eric Lippert
eSignal, an Interactive Data company
800 779-6555, www.eSignal.com
BACK TO LIST

NINJATRADER: JULY 2020
The BandPassFilter indicator discussed in John Ehlers’ article in this issue, “Truncated Indicators,” is available for download at the following links for NinjaTrader 8 and for NinjaTrader 7:
Once the file is downloaded, you can import the indicator into NinjaTader 8 from within the Control Center by selecting Tools → Import → NinjaScript Add-On and then selecting the downloaded file for NinjaTrader 8. To import in NinjaTrader 7, from within the Control Center window, select the menu File → Utilities → Import NinjaScript and select the downloaded file.
You can review the indicator’s source code in NinjaTrader 8 by selecting the menu New → NinjaScript Editor → Indicators from within the Control Center window and selecting the BandPassFilter file. You can review the indicator’s source code in NinjaTrader 7 by selecting the menu Tools → Edit NinjaScript → Indicator from within the Control Center window and selecting the BandPassFilter file.
A sample chart is shown in Figure 5.
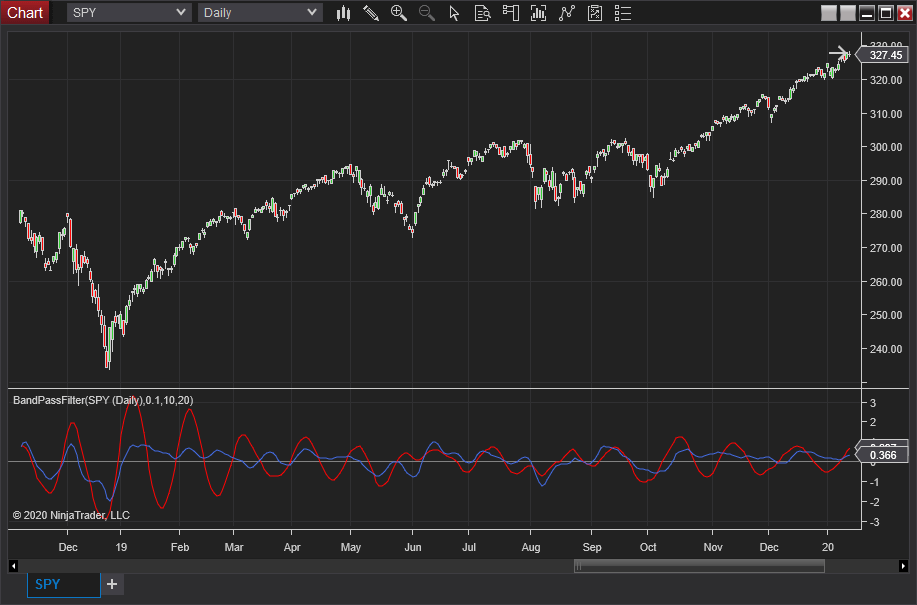
FIGURE 5: NINJATRADER. The BandPassFilter indicator is shown on SPY from December 2018 to December 2019.
NinjaScript uses compiled DLLs that run native, not interpreted, to provide you with the highest performance possible.
—Jim Dooms
NinjaTrader, LLC
www.ninjatrader.com
BACK TO LIST

QUANTACULA STUDIO: JULY 2020
John Ehlers’ article in this issue, “Truncated Indicators,” features his bandpass indicator, which we’ve already integrated into the Quantacula TASC library. This means the indicator is ready for use both in Quantacula Studio and the Quantacula.com website.
We decided to test the indicator out by creating a trading model using drag & drop building blocks in Quantacula Studio. This type of model is composed of entry, exit, condition, and qualifier blocks. You drop conditions onto entries and exits to specify when to get into and out of a trade. You can drop qualifiers onto conditions to give them more specific criteria (see Figure 6)
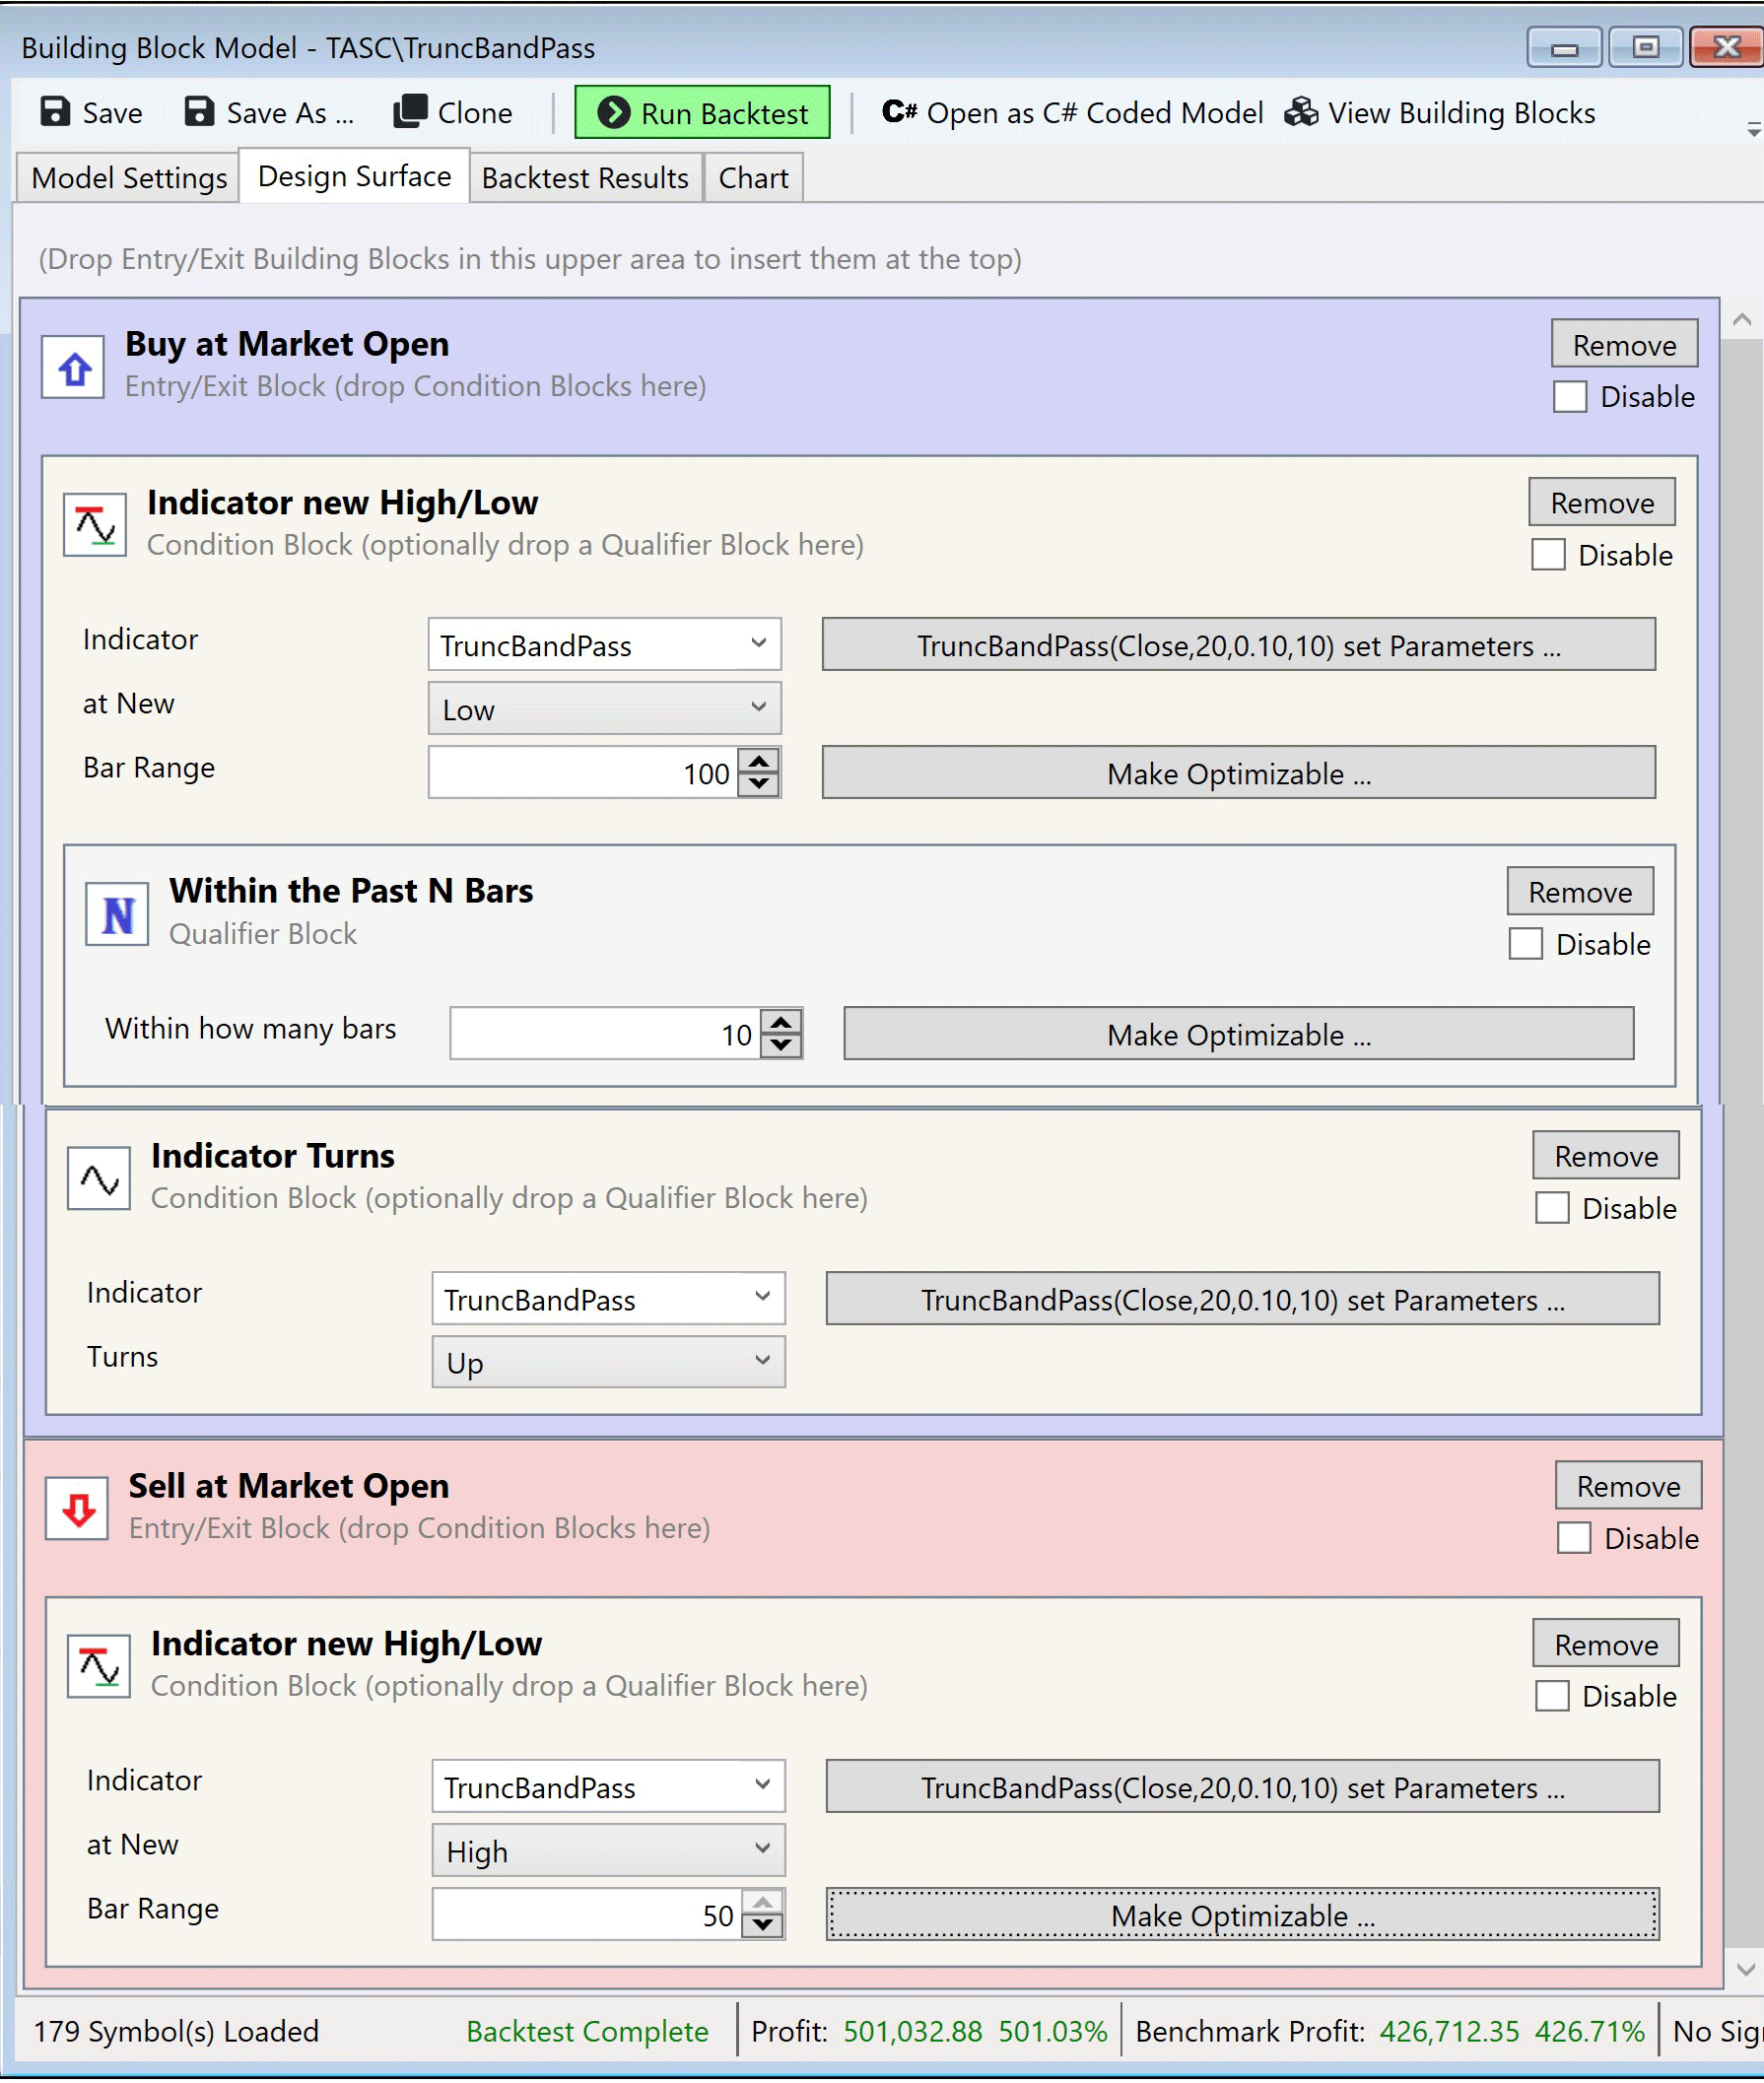
FIGURE 6: QUANTACULA. Shown here is the TruncBandPass trading model mocked up in Quantacula Studio Building Blocks.
We used two conditions for the entry here, indicator new high/low to specify that TruncBandPass should make a 100-bar new low. The second condition we used is indicator turns up/down, to specify that TruncBandPass should turn up, that is, move up after having moved down. We used the qualifier within the past N bars to give the first condition some flexibility. This results in a buy after the TruncBandPass turns up after having hit a 100-bar low sometime within the past 10 bars. We exit the trade when TruncBandPass hits a 50-bar new high.
We backtested the trading model on the Nasdaq 100 stocks, using the QPremium universe that automatically accounts for symbols that dropped into and out of the index over time. We used $100,000 starting capital, a trade size of 15% of equity, and 1.5:1 margin. Over the past 10 years, the model performed quite well, returning an annualized gain of 19.84% (see Figure 7).
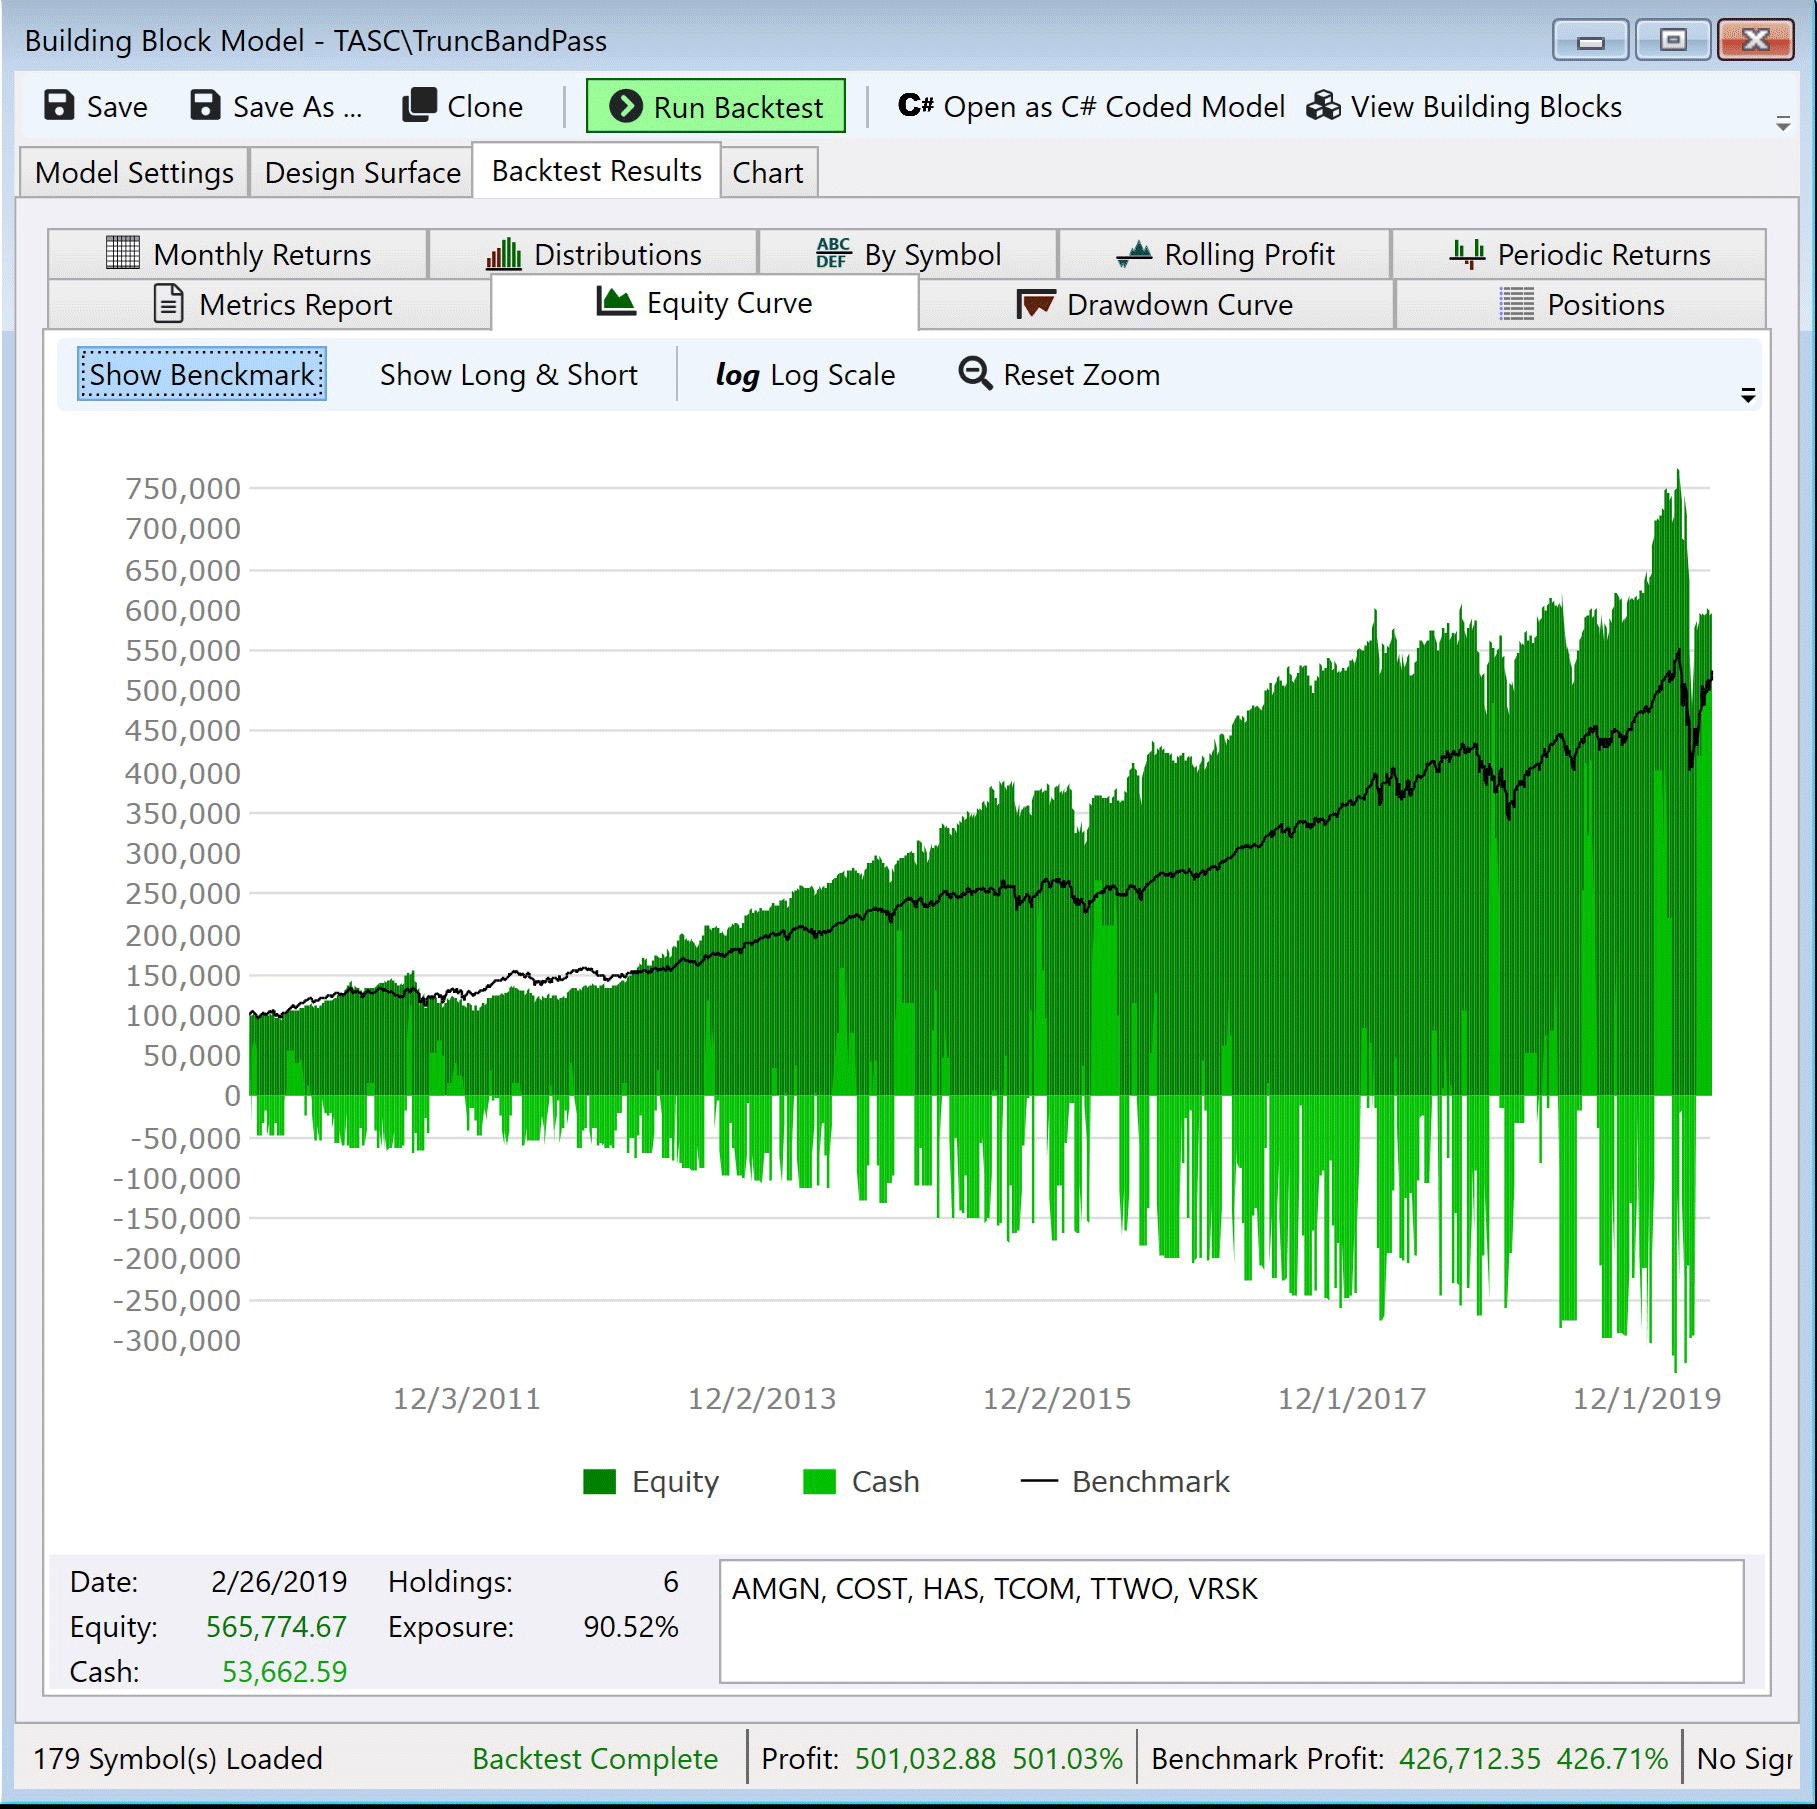
FIGURE 7: QUANTACULA. The resulting equity curve for the example TruncBandPass trading model is shown.
—Dion Kurczek, Quantacula LLC
info@quantacula.com
www.quantacula.com
BACK TO LIST

NEUROSHELL TRADER: JULY 2020
The truncated bandpass filter described by John Ehlers in his article in this issue, “Truncated Indicators,” can be easily implemented in NeuroShell Trader using NeuroShell Trader’s ability to call external dynamic linked libraries (DLLs). DLLs can be written in C, C++, and Power Basic.
After moving the code given in Ehlers’ article to your preferred compiler and creating a DLL, you can insert the resulting indicator as follows:
- Select new indicator from the insert menu.
- Choose the external program & library calls category.
- Select the appropriate external DLL call indicator.
- Set up the parameters to match your DLL.
- Select the finished button.
Users of NeuroShell Trader can go to the Stocks & Commodities section of the NeuroShell Trader free technical support website to download a copy of this or any previous Traders’ Tips.
A sample chart is shown in Figure 8.
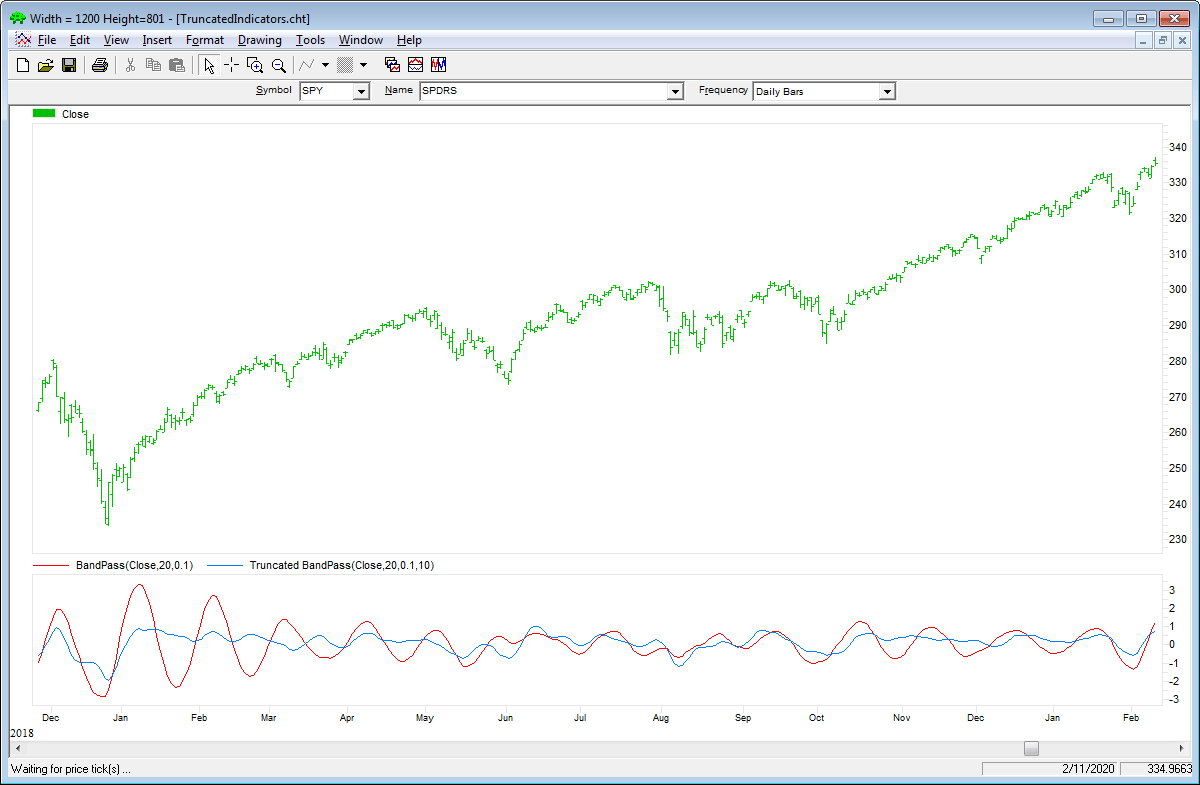
FIGURE 8: NEUROSHELL TRADER. This NeuroShell Trader chart shows the standard bandpass and truncated bandpass filters.
—Marge Sherald, Ward Systems Group, Inc.
301 662-7950, sales@wardsystems.com
www.neuroshell.com
BACK TO LIST

THE ZORRO PROJECT: JULY 2020
Cumulative indicators, such as the EMA or MACD, are affected not only by previous candles, but by a theoretically infinite history of candles. Although this effect is often assumed to be negligible, John Ehlers demonstrates in his article in this issue that it is not so. Or at least not for a narrow-band bandpass filter.
Bandpass filters are normally used for detecting cycles in price curves. But they do not work well with steep edges in the price curve. Sudden price jumps cause a narrow-band filter to “ring like a bell” and generate artificial cycles that can cause false triggers. As a solution, Ehlers proposes to truncate the candle history of the filter. Limiting the history to 10 bars effectively dampened the filter output and produced a better representation of the cycles in the price curve.
For limiting the history of a cumulative indicator, we’re not using Ehlers’ code here, but instead we’ll write a general “truncate” function that works for any indicator:
var indicator(vars Data,int Period,var Param);

var truncate(function Indicator,vars Data,int Period,var Param)
{
  indicator = Indicator;
  var *Trunc = zalloc(UnstablePeriod*sizeof(var));
  var Ret;
  int i;
  for(i = UnstablePeriod-1; i >= 0; i--) {
    SeriesBuffer = Trunc;
    Ret = indicator(Data+i,Period,Param);
    shift(Trunc,0,UnstablePeriod);
  }
  return Ret;
}
This function does basically the same as Ehlers’ code for his bandpass filter. It accesses the internal history buffer of the cumulative indicator that’s passed as the first argument. The SeriesBuffer variable replaces that buffer with an external array that’s temporarily allocated on the C heap. UnstablePeriod is a global variable already used for limiting the history range of traditional indicators, such as EMA or MACD.
The following code shows how the truncate function is used with our narrow bandpass filter:
function run()
{
   BarPeriod = 1440;
   StartDate = 20181101;

   assetAdd("SPY","STOOQ:SPY.US"); // load price history from Stooq
   asset("SPY");

  UnstablePeriod = 10;
  vars Prices = series(priceClose());
  var PB = BandPass(Prices, 20, 0.1);
  var Trunc = truncate(BandPass, Prices, 20, 0.1);
  plot("Bandpass",BP,NEW|LINE,RED);
  plot("Truncated",Trunc,LINE,BLUE);
}
The chart shown in Figure 9 confirms Ehlers’ observation that the truncated narrow bandpass (blue line) represents cycles better than the original bandpass (red line). For comparison I’ve added a medium-wide bandpass filter as it is normally used in trading systems (green line). This filter doesn’t “ring” either, truncated or not. So what’s the better choice for detecting cycles, a truncated narrow bandpass or a nontruncated wide bandpass?
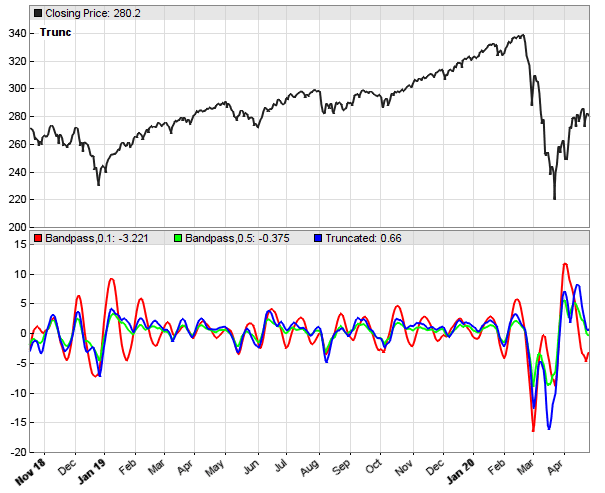
FIGURE 9: ZORRO PROJECT. The chart displays a truncated narrow bandpass (blue line). For comparison, the green line is a nontruncated medium-wide bandpass filter.
To find out, we feed the three bandpass variants with a sine chirp and compare their responses. The resulting plots are shown in Figure 10.
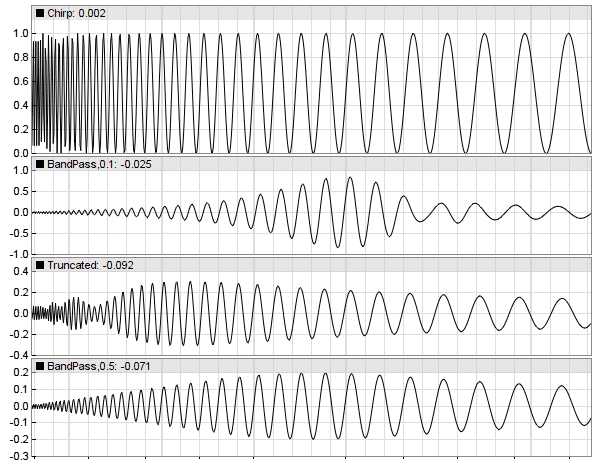
FIGURE 10: ZORRO PROJECT. Shown for comparison are sine chirp responses from three bandpass variants (the original narrow bandpass, the truncated narrow bandpass, and the wide bandpass).
The top panel is the chirp, a sine wave with a period rising from 5 to 60 cycles. The panels below that show the chirp responses of the original narrow bandpass, the truncated narrow bandpass, and the wide bandpass. We can see that the truncated bandpass got a wider bandwidth, artifacts at low cycles, and a shifted center frequency. A nontruncated filter with an already wider bandwidth seems here the better solution.
The advantage of truncating is that the indicator output is clearly defined, regardless of the lookback period of the trading system. A disadvantage is speed—truncating makes indicators much slower because they run in a loop. Not very relevant for normal trading systems, but relevant for HFT (high-frequency trading) systems.
The truncate function and the test scripts can be downloaded from the 2020 script repository on https://financial-hacker.com. The Zorro platform can be downloaded from zorro-project.com. Zorro version 2.27 or above is needed.
—Petra Volkova
The Zorro Project by oP group GmbH
www.zorro-project.com
BACK TO LIST

TRADERSSTUDIO: JULY 2020
The importable TradersStudio files based on John Ehlers’ article in this issue, “Truncated Indicators,” can be obtained on request via email to info@TradersEdgeSystems.com. The code is also available below.
'TRUNCATED INDICATORS
'Author: John F. Ehlers, TASC July 2020
'Coded by Richard Denning, 5/17/2020
'www.TradersEdgeSystems.com

'FUNCTION THAT CALCULATES BP:
Function Ehlers_BP(Period, Bandwidth, Length)
'LENGTH must be less than 98 due to array size
    Dim L1 As BarArray
    Dim G1 As BarArray
    Dim S1 As BarArray
    Dim count
    Dim BP As BarArray
    'Dim BPT As BarArray
    Dim Trunc As Array

    If BarNumber=FirstBar Then
        'Period = 20
        'Bandwidth = .1
        'Length = 10
        L1 = 0
        G1 = 0
        S1 = 0
        count = 0
        BP = 0
        'BPT = 0
    End If

    ReDim (Trunc, 101)

'Standard Bandpass
    L1 = TStation_Cosine(360 / Period)
    G1 = TStation_Cosine(Bandwidth*360 / Period)
    S1 = 1 / G1 - Sqr(1 / (G1*G1) - 1)
    BP = .5*(1 - S1)*(Close - Close[2]) + L1*(1 + S1)*BP[1] - S1*BP[2]
Ehlers_BP = BP
End Function
'----------------------------------------------------------------------
'FUNCTION THAT CALCULATES BPT:
Function Ehlers_BPT(Period, Bandwidth, Length)  ', byref BP as bararray)
'LENGTH must be less than 98 due to array size
    Dim L1 As BarArray
    Dim G1 As BarArray
    Dim S1 As BarArray
    Dim count
    Dim BP As BarArray
    Dim BPT As BarArray
    Dim Trunc As Array

    If BarNumber=FirstBar Then
        'Period = 20
        'Bandwidth = .1
        'Length = 10
        L1 = 0
        G1 = 0
        S1 = 0
        count = 0
        'BP = 0
        BPT = 0
    End If

    ReDim (Trunc, 101)

'Standard Bandpass
    L1 = TStation_Cosine(360 / Period)
    G1 = TStation_Cosine(Bandwidth*360 / Period)
    S1 = 1 / G1 - Sqr(1 / (G1*G1) - 1)
    'See separate function (Ehlers_BP) for BP calculation:
    'BP = .5*(1 - S1)*(Close - Close[2]) + L1*(1 + S1)*BP[1] - S1*BP[2]

'Stack the Trunc Array
For count=100 To 2 Step -1
    Trunc[count] = Trunc[count-1]
Next

'Truncated Bandpass
Trunc[Length + 2] = 0
Trunc[Length + 1] = 0
For count = Length To 1 Step -1
    Trunc[count] = .5*(1 - S1)*(Close[count - 1] - Close[count + 1]) + L1*(1 + S1)*Trunc[count + 1] - S1*Trunc[count + 2]
Next

'Convert to a variable
BPT = Trunc[1]
Ehlers_BPT = BPT
End Function
'------------------------------------------------------------------------------------------------------------------------
'INDICATOR PLOT THAT PLOTS BP AND BPT:
Sub Ehlers_BPT_IND(Period, Bandwidth, Length)
Dim BP As BarArray
Dim BPT As BarArray
If BarNumber = FirstBar Then BP = 0
BP = EHLERS_BP(Period, Bandwidth, Length)
BPT = EHLERS_BPT(Period, Bandwidth, Length)
plot1(BP)
plot2(BPT)
End Sub
'---------------------------------------------
I coded the indicators described by the author. Figure 11 shows the bandpass (BP) and truncated bandpass (BPT) indicators using the default lengths of 20, 0.1, 10 on a chart of Google (GOOGL).
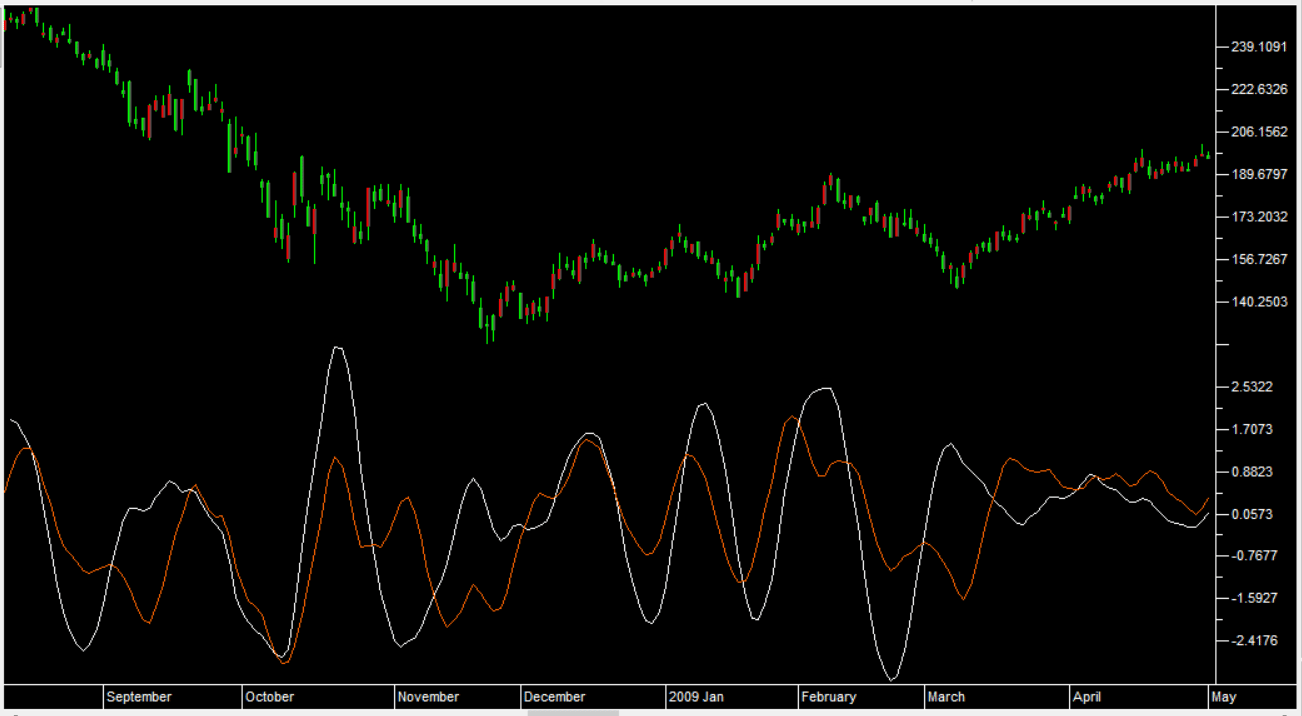
FIGURE 11: TRADERSSTUDIO. The bandpass (BP) and truncated bandpass (BPT) indicators are shown on a chart of MSFT.
—Richard Denning
info@TradersEdgeSystems.com
for TradersStudio
BACK TO LIST

TRADENAVIGATOR: JULY 2020
In “Truncated Indicators” in this issue, author John Ehlers presents a truncation technique for cycle indicators and demonstrates the technique using a truncated bandpass filter.
To install these new tools into Trade Navigator, first obtain the program update by clicking on the telephone button (or use the file pulldown menu, then select update data). Then select download special file, and click on the start button. You will then be guided through an upgrade of your Trade Navigator. If prompted to “re-import libraries,” please do so. This will import the new tools into the software. Once that is completed, you will find a study named “Ehlers BandPass filters.”
You can insert these indicators onto your chart by opening the charting dropdown menu, selecting the add to chart command, then on the studies tab, finding the new study, selecting it, then clicking on the add button.
If you need assistance with upgrading or applying the study, our technical support staff is happy to help via phone or via live chat through our website.
A sample chart is shown in Figure 12.
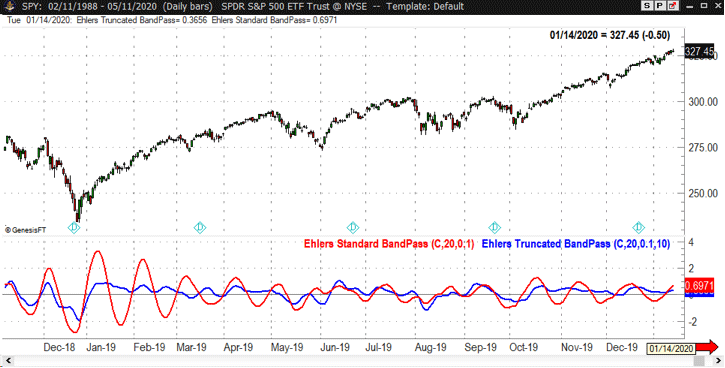
FIGURE 12: TRADE NAVIGATOR. This chart displays the Ehlers truncated bandpass filter.
—Genesis Financial Data
Tech support 719 884-0245
www.TradeNavigator.com
BACK TO LIST
MICROSOFT EXCEL: JULY 2020
In his article in this issue, “Truncated Indicators,” John Ehlers takes us aside to look at the impact of sharp price movements on two fundamentally different types of filters: finite impulse response, and infinite impulse response filters. Given recent market conditions, this is a very well timed subject.
In this article, Ehlers suggests “truncation” as an approach to the way the trader calculates filters. He explains why truncation is not appropriate for finite impulse response filters but why truncation can be beneficial to infinite impulse response filters. He then explains how to apply truncation to infinite impulse response filters using his bandpass filter as an example.
Figure 13 replicates the figure from his article using Excel.
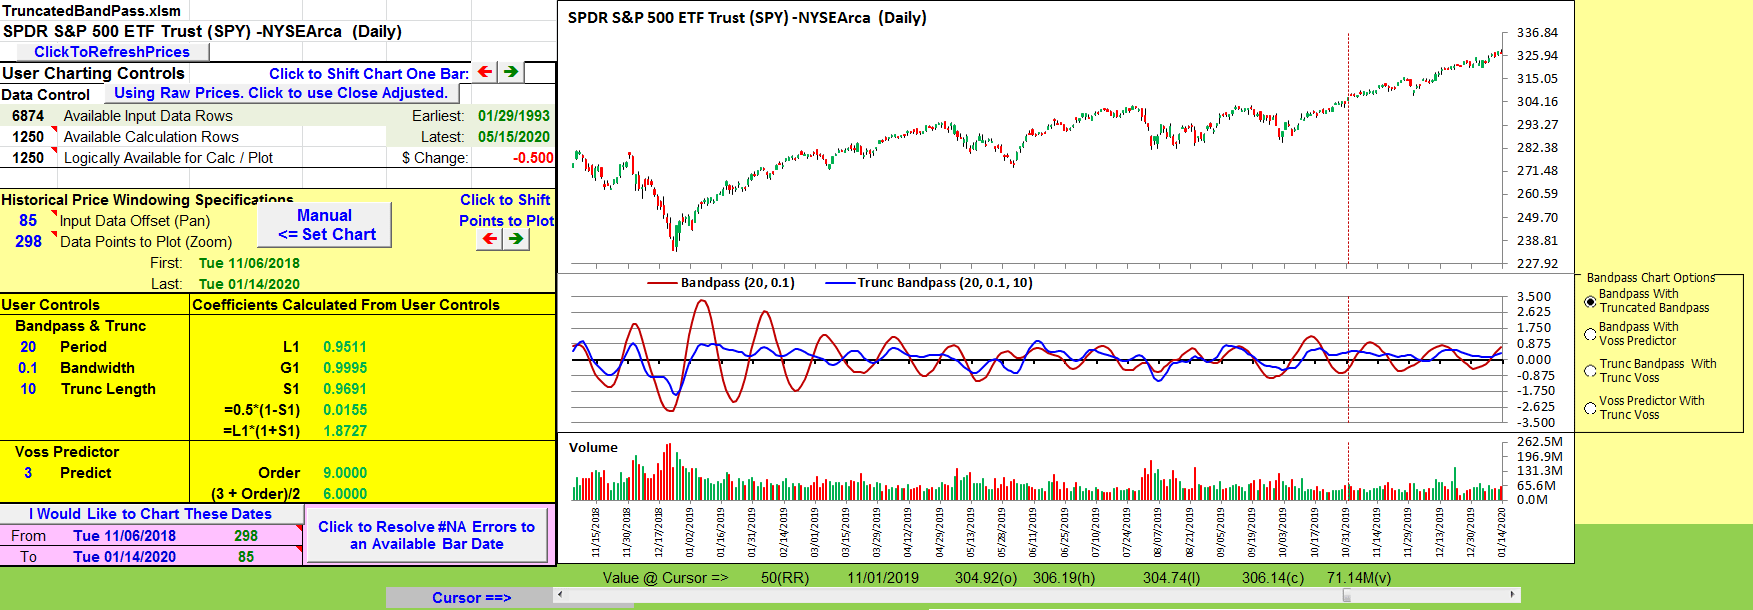
FIGURE 13: EXCEL. Bandpass and truncated bandpass filters.
Next, it seemed appropriate to take a look at this concept within a filter or indicator that uses the normal bandpass filter as a starting point.
A quick dive into my Traders’ Tips spreadsheet archive brought me to an August 2019 S&C article by John Ehlers titled “A Peek Into The Future.” That article introduced the Voss predictive filter, where the first step in the Voss computation is the bandpass filter.
Three columns of cell formulas make up the Voss filter and I already have the bandpass column. So it is a simple exercise to port the Voss filter forward to the current spreadsheet to demonstrate the result of bandpass truncation in a more complex environment.
Figure 14 replicates the chart from Ehlers’ August 2019 article. Figure 15 is the same chart using the truncated bandpass filter as the first stage of Voss calculations. Figure 16 below puts the two Voss calculations side by side.
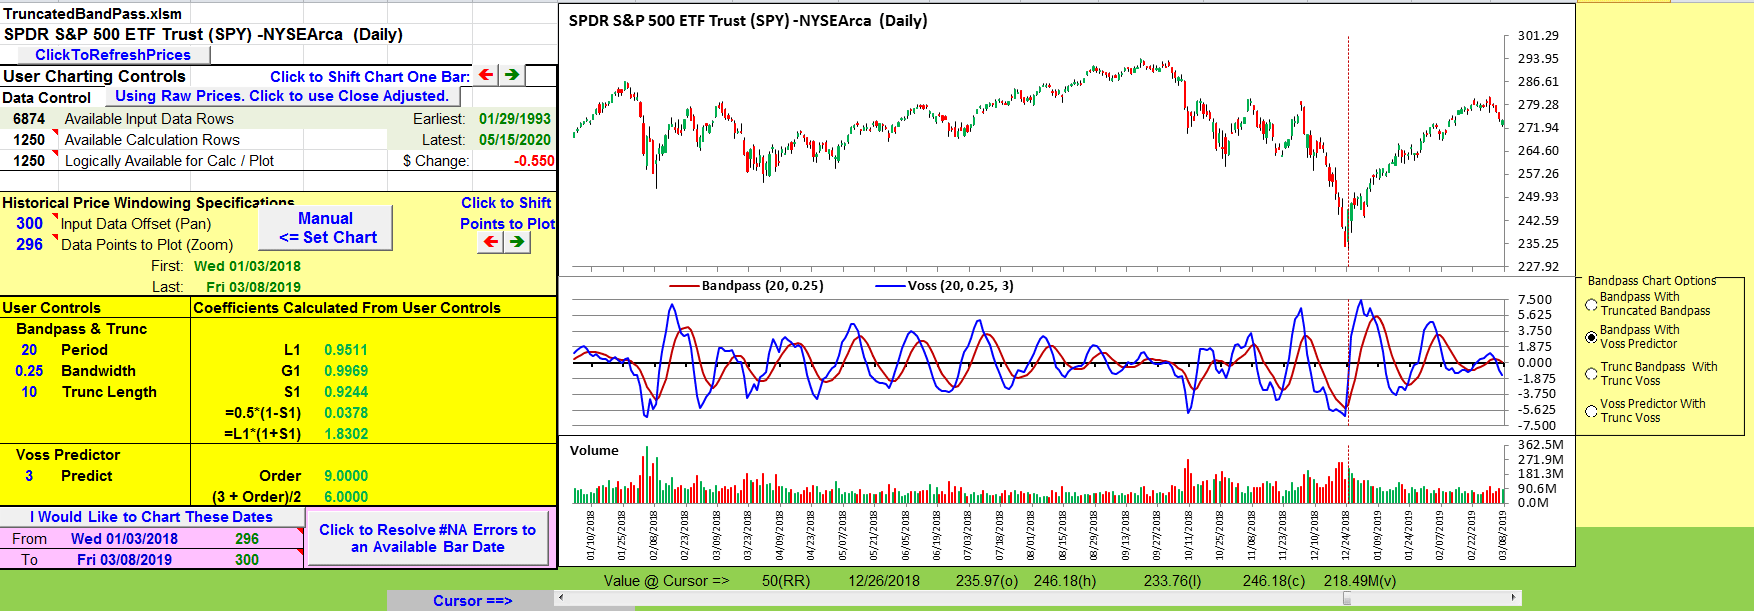
FIGURE 14: EXCEL. Voss predictive filter. Note: The Voss article used a wider bandwidth setting of 0.25.
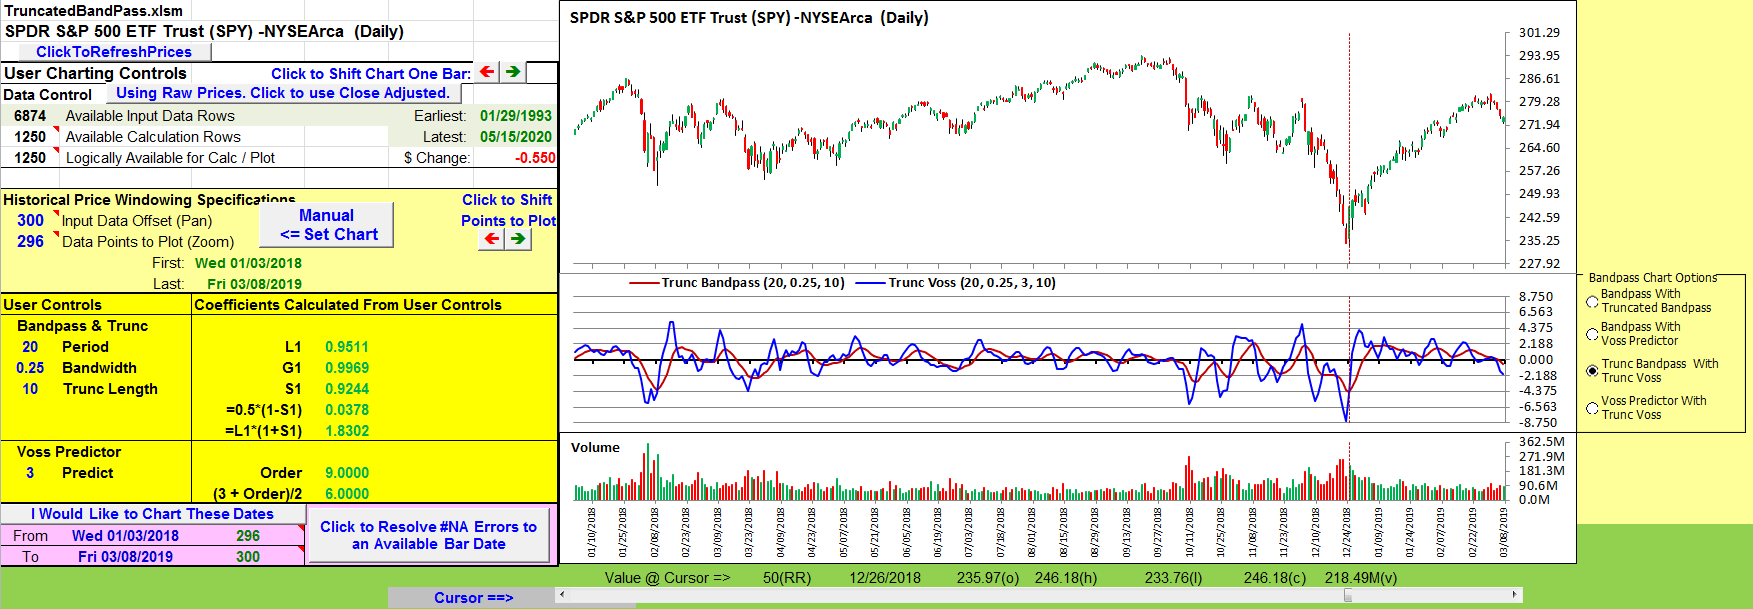
FIGURE 15: EXCEL. Voss filter calculated using the truncated bandpass filter.
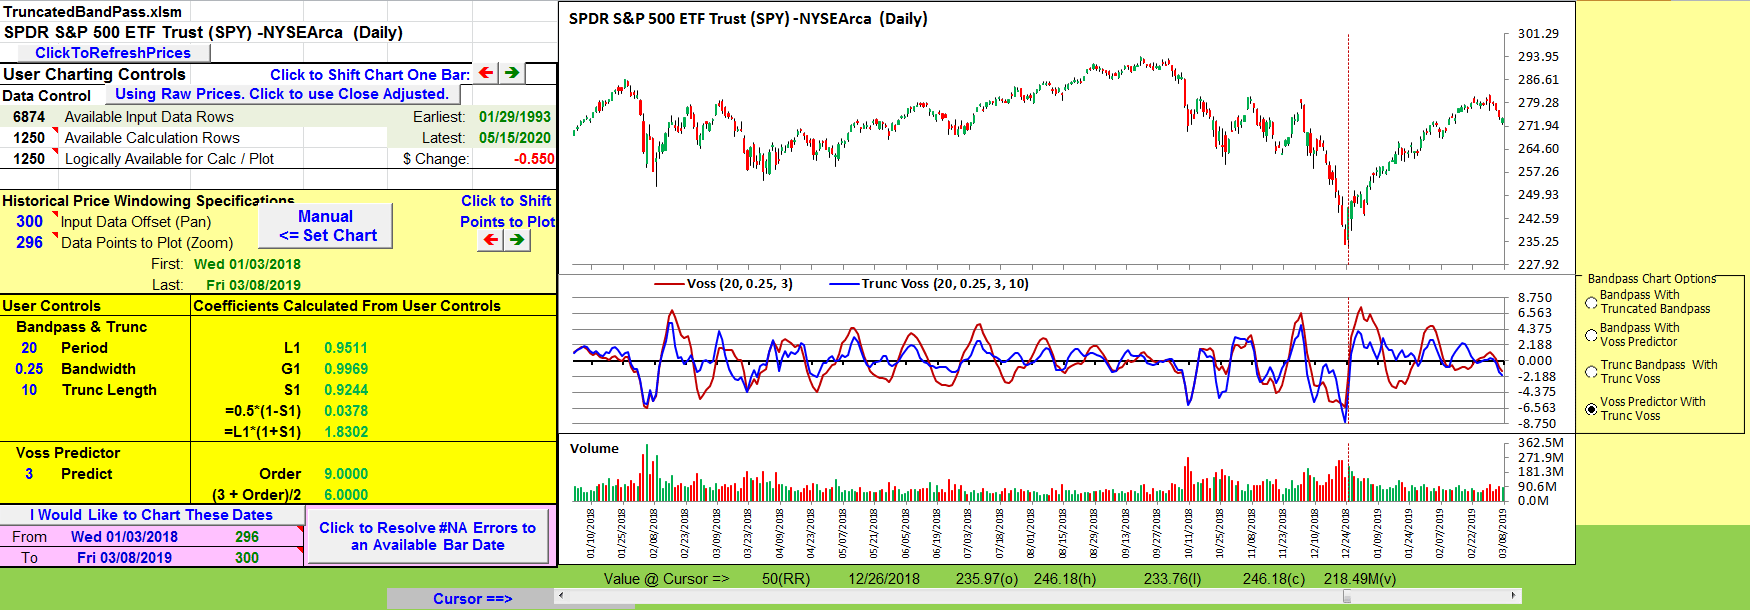
FIGURE 16: EXCEL. Voss filter and truncated Voss filter.
At this writing, we are well into the impact that Covid-19 is having on the world economy. Figure 17 takes a look at the recent S&P 500 index with the Voss filter and the truncated Voss filter.
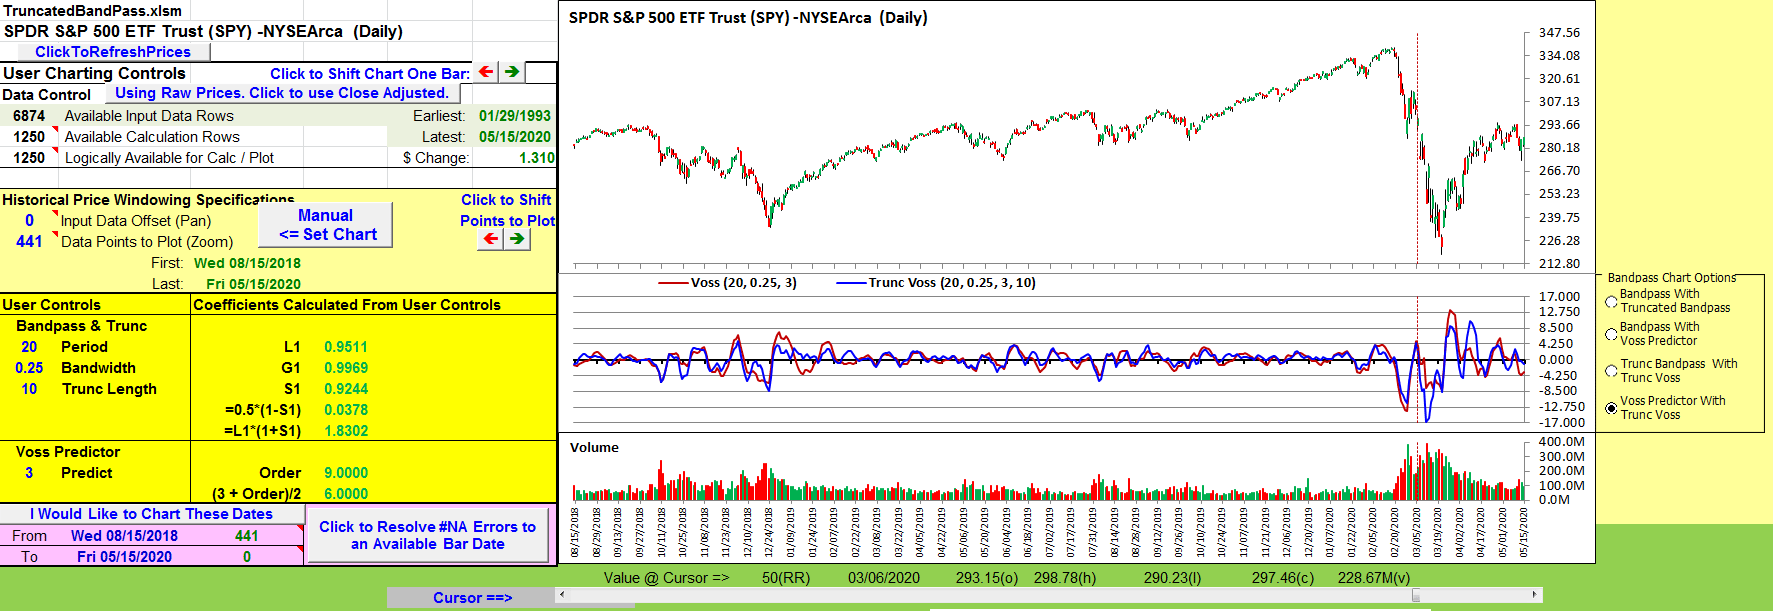
FIGURE 17: EXCEL. Forward space the chart in Figure 16 to today.
Some technical explanations behind the creation of this spreadsheet
User-defined function: BPTrunc—A VBA code implementation of Ehlers’ truncated bandpass filter.
In his article in this issue, Ehlers mentions “mathematical sleight of hand tricks.”
In the time available, I have not been able to come up with any mathematical jujitsu that would keep an implementation of the truncated bandpass filter entirely within native Excel cell formula capabilities. The problem is due to the bandpass filter formulation requiring two of its previous output values as a feedback input.
Truncation requires that we break that backward reference at the specified truncation length. The EasyLanguage code given in the sidebar in his article introduces a pair of zero feedback values just beyond the truncation length to provide that break.
Between the truncated version needing the two oldest feedback values to be zero, the complexity of the bandpass filter formula itself, and the requirement that it be calculated fresh at each bar, I was stymied as to how to create a purely Excel cell formula computation for this.
Perhaps a better mathematician than I could figure out a refactoring of the bandpass filter, similar to Ehlers’ discussion in his article of the “transfer response of a filter,” that would allow this bandpass truncation to be coded with native Excel cell formula capabilities.
Instead, I have used VBA to create a user-defined function (UDF)—“BPTrunc”—that can be used directly in complex cell formulas.
The only real drawback to the UDF approach is that it is inherently slower to calculate than a native cell formula solution. Thus, for this spreadsheet, there is a noticeable delay in response when the user changes any of the control values or buttons.
For this spreadsheet, I have chosen to use BPTrunc in a column by itself to facilitate on-chart side by side comparisons. But it is not a requirement of BPTrunc to be used standalone in a cell formula. The BPTrunc function is portable.
The following is for those comfortable with VBA and who might wish to try the truncated bandpass filter in other spreadsheets that have used the bandpass filter.
The easiest approach is to have the VBA editor export a copy of the module from this spreadsheet to your hard drive.
Close this spreadsheet. Open your target spreadsheet and use the VBA editor to import the “truncated bandpass” module from where you stored it. Then modify cell formulas that use the bandpass filter, similar to what I have done here for the Voss filter calculation.
To download this spreadsheet
The spreadsheet file for this Traders’ Tip can be downloaded from Traders.com in the Traders’ Tips area. To successfully download it, follow these steps:
- Right-click on the Excel file link, then
- Select “save as” (or “save target as”) to place a copy of the spreadsheet file on your hard drive.
—Ron McAllister
Excel and VBA programmer
rpmac_xltt@sprynet.com
BACK TO LIST
Originally published in the July 2020 issue of
Technical Analysis of STOCKS & COMMODITIES magazine.
All rights reserved. © Copyright 2020, Technical Analysis, Inc.