TRADERS’ TIPS
September 2020

For this month’s Traders’ Tips, the focus is James Garofallou’s article in this issue, “Tracking Relative Strength In Four Dimensions.” Here, we present the September 2020 Traders’ Tips code with possible implementations in various software.
You can right-click on any chart to open it in a new tab or window and view it at it’s originally supplied size, often much larger than the version printed in the magazine.
The Traders’ Tips section is provided to help the reader implement a selected technique from an article in this issue or another recent issue. The entries here are contributed by software developers or programmers for software that is capable of customization.

TRADESTATION: SEPTEMBER 2020
In “Tracking Relative Strength In Four Dimensions” in this issue, author James Garofallou introduces us to a new method of measuring the relative strength of a security. This new technique creates a much broader reference than would be obtained by using a single security or index and combines several dimensions, as the author calls them, into a single rank value.
Here, we are providing TradeStation EasyLanguage code for an indicator based on the author’s work as well as a function to assist with the calculations.
Indicator: RSI In 4 Dim
// Relative Strength in 4 Dimensions
// TASC Sep 2020
// James Garofallou, PhD

inputs:
	periods( 10 ) ;

variables:
	RS2( 0 ),RS3( 0 ),RS4( 0 ),
	RS5( 0 ),RS6( 0 ),RS7( 0 ),
	RS8( 0 ),RS9( 0 ),RS10( 0 ),
	RS11( 0 ),RS12( 0 ),
	RS2t2( 0 ),RS2t3( 0 ),RS2t4( 0 ),
	RS2t5( 0 ), RS2t6( 0 ),RS2t7( 0 ),
	RS2t8( 0 ),RS2t9( 0 ), RS2t10( 0 ),
	RS2t11( 0 ),RS2t12( 0 ),
	RS3x( 0 ), RS_4( 0 ), RS4Osc( 0 ), Mv( 0 ) ;

RS2 = Close / Close Data2 ;
RS3 = Close / Close Data3 ;
RS4 = Close / Close Data4 ;
RS5 = Close / Close Data5 ;
RS6 = Close / Close Data6 ;
RS7 = Close / Close Data7 ;
RS8 = Close / Close Data8 ;
RS9 = Close / Close Data9 ;
RS10 = Close / Close Data10 ;
RS11 = Close / Close Data11 ;
RS12 = Close / Close Data12 ;

RS2t2 = CalcRS2t( RS2, Periods ) ;
RS2t3 = CalcRS2t( RS3, Periods ) ;
RS2t4 = CalcRS2t( RS4, Periods ) ;
RS2t5 = CalcRS2t( RS5, Periods ) ;
RS2t6 = CalcRS2t( RS6, Periods ) ;
RS2t7 = CalcRS2t( RS7, Periods ) ;
RS2t8 = CalcRS2t( RS8, Periods ) ;
RS2t9 = CalcRS2t( RS9, Periods ) ;
RS2t10 = CalcRS2t( RS10, Periods ) ;
RS2t11 = CalcRS2t( RS11, Periods ) ;
RS2t12 = CalcRS2t( RS12, Periods ) ;

RS3x = RS2t2 + RS2t3 + RS2t4 + RS2t5
	+ RS2t6	+ RS2t7 + RS2t8 + RS2t9
	+ RS2t10 + RS2t11 + RS2t12 ;

RS_4 = ( RS3x / 11 ) * 10 ;
RS4Osc = Average( RS_4, 3 ) ;
Mv = Average( RS4Osc, 5 ) ;
Plot1( RS4Osc, "RS4 Osc" ) ;
Plot2( Mv, "RS4 Signal"  ) ;

Function: CalcRS2t
// Relative Strength in 4 Dimensions
// TASC Sep 2020
// James Garofallou, PhD

inputs: Price( numericseries ), Length( numericsimple ) ;
variables: Fast( 0 ), Med( 0 ), Slow( 0 ), VSlow( 0 ), RS2t( 0 ) ;

Fast = XAverage( Price, Length ) ;
Med = Average( Fast, 7 ) ;
Slow = Average( Fast, 15 ) ;
VSlow = Average ( Slow, 30 ) ;

if Fast >= Med and Med >= Slow and Slow >= VSlow then
       RS2t = 10
else if Fast >= Med and Med >= Slow and Slow < VSlow then
       RS2t = 9
else if Fast < Med and Med >= Slow and Slow >= VSlow then
       RS2t = 9
else if Fast < Med and Med >= Slow and Slow < VSlow then
       RS2t = 5
else
       RS2t = 0 ;

CalcRS2t = RS2t ;
To download the EasyLanguage code and a demonstration workspace for TradeStation 10, please visit our TradeStation and EasyLanguage support forum. The files for this article can be found here: https://community.tradestation.com/Discussions/Topic.aspx?Topic_ID=168100. The filename is
“TASC_SEP2020.ZIP.” For more information about Easy
Language in general, please see https://www.tradestation.com/EL-FAQ.
A sample chart is shown in Figure 1.
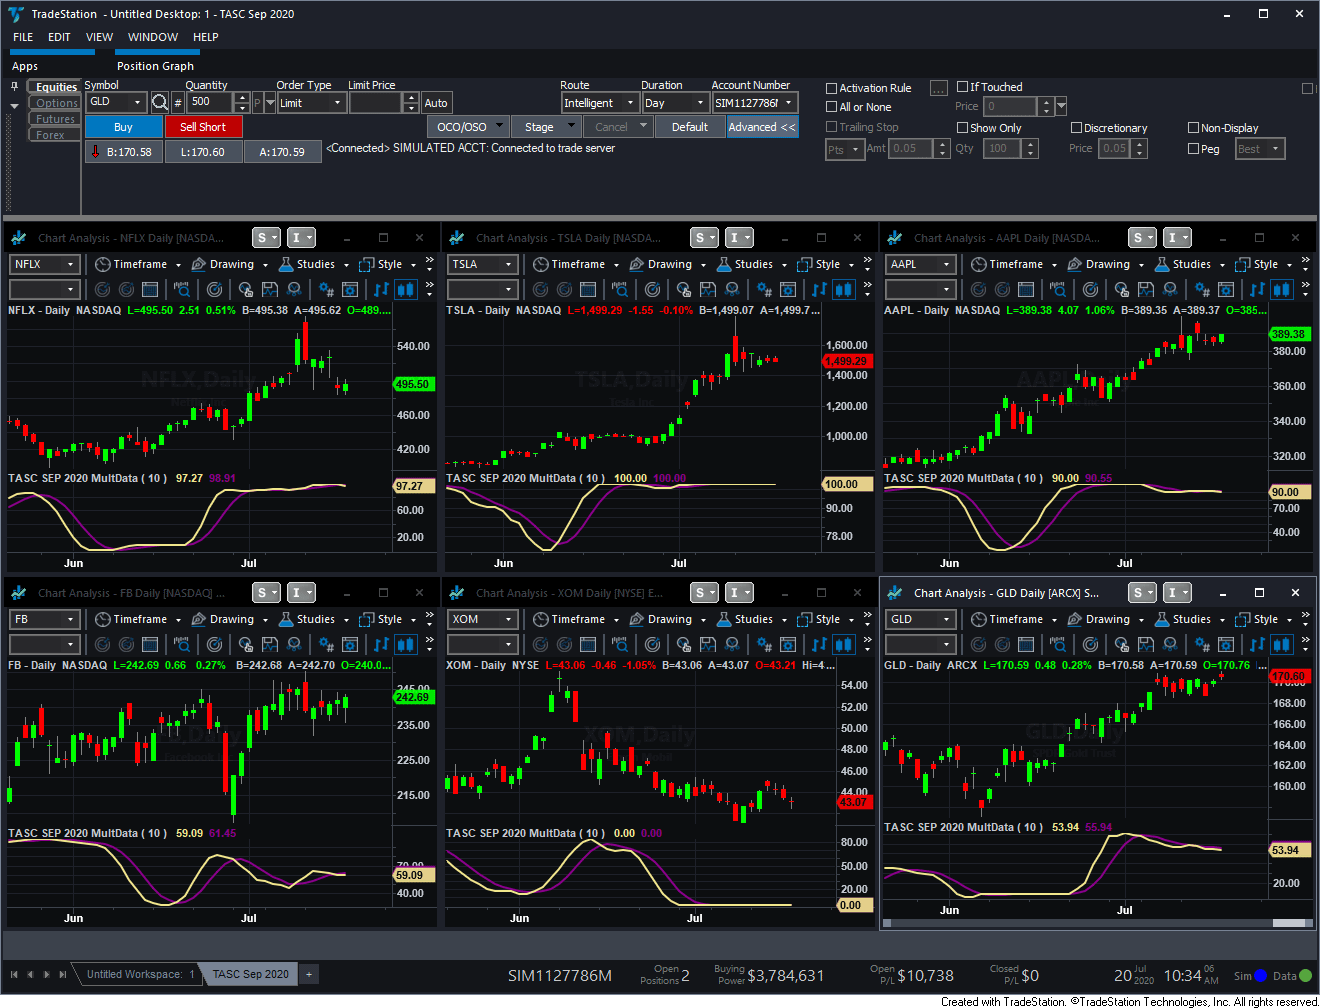
FIGURE 1: TRADESTATION. Here is an example of evaluating the relative strength
of NFLX, FB, TSLA, AAPL, XOM, and GLD using the author’s relative strength technique.
This article is for informational purposes. No type of trading or investment recommendation, advice, or strategy is being made, given, or in any manner provided by TradeStation Securities or its affiliates.
—Doug McCrary
TradeStation Securities, Inc.
www.TradeStation.com
BACK TO LIST

eSIGNAL: SEPTEMBER 2020
For this month’s Traders’ Tip, we’ve provided the Relative Strength.efs study based on the article in this issue by James Garofallou, “Tracking Relative Strength In Four Dimensions.” This study compares a security to another in four dimensions, as explained in the article.
The study contains formula parameters that may be configured through the edit chart window (right-click on the chart and select “edit chart”). A sample chart is shown in Figure 2.
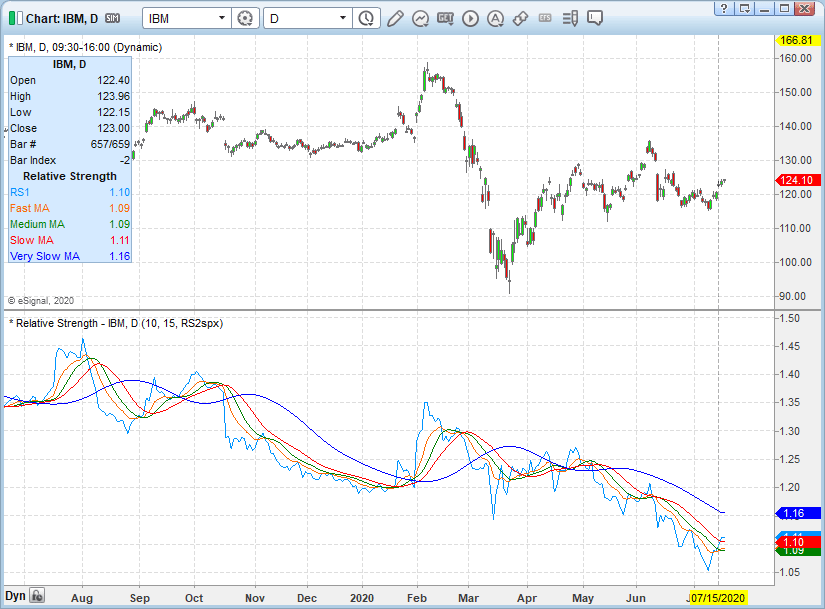
FIGURE 2: eSIGNAL. An example of the study plotted on a daily chart of IBM.
To discuss this study or download a complete copy of the formula code, please visit the EFS library discussion board forum under the forums link from the support menu at www.esignal.com or visit our EFS KnowledgeBase at www.esignal.com/support/kb/efs/. The eSignal formula script (EFS) is also available for copying & pasting here:
/**********************************
Provided By:
Copyright 2019 Intercontinental Exchange, Inc. All Rights Reserved.
eSignal is a service mark and/or a registered service mark of Intercontinental Exchange, Inc.
in the United States and/or other countries. This sample eSignal Formula Script (EFS)
is for educational purposes only.
Intercontinental Exchange, Inc. reserves the right to modify and overwrite this EFS file with each new release.

Description:
   Tracking Relative Strength In Four Dimensions
   by James Garofallou


Version:            1.00  07/13/2020

Formula Parameters:                     Default:
Periods                                  10
Periods1                                 15
Ret                                      RS2spx

Notes:
The related article is copyrighted material. If you are not a subscriber
of Stocks & Commodities, please visit www.traders.com.

**********************************/
var fpArray = new Array();
var bInit = false;

function preMain() {
    setStudyTitle("Relative Strength");
    setPriceStudy(false);
    setDefaultBarFgColor(Color.RGB(0x00,0x94,0xFF), 0);
    setDefaultBarFgColor(Color.RGB(0xFE,0x69,0x00), 1);
    setDefaultBarFgColor(Color.green, 2);
    setDefaultBarFgColor(Color.red, 3);
    setDefaultBarFgColor(Color.blue, 4);
    setIntervalsBackfill(true);


    var x=0;
    fpArray[x] = new FunctionParameter("Periods", FunctionParameter.NUMBER);
	with(fpArray[x++]){
        setLowerLimit(1);
        setDefault(10);
    }

    fpArray[x] = new FunctionParameter("Periods1", FunctionParameter.NUMBER);
	with(fpArray[x++]){
        setName("Periods for RS5")
        setLowerLimit(1);
        setDefault(15);
    }

    fpArray[x] = new FunctionParameter("Ret", FunctionParameter.STRING);
	with(fpArray[x++]){
        setName("What to Display");
        addOption("RS2spx");
        addOption("RS2t");
        addOption('RS4');
        addOption('RS5');
        setDefault("RS2spx");
    }


}

var bVersion = null;
var xClose = null;
var Fast = null;
var Med = null;
var Slow = null;
var Vslow = null;
var Tier1 = null;
var Tier2 = null;
var Tier3 = null;
var Tier4 = null;
var RS2t = null;
var xCloseSym = null;
var xRS1 = [];

var Syms = [];
var xRS3x = null;
var RS4 = null;
var RS4osc = null;
var Mv = null;

var RS5 = null;
var mvRS4 = null;
var RS4up = null;


function main(Periods, Periods1, Ret) {
    if (bVersion == null) bVersion = verify();
    if (bVersion == false) return;

    if ( bInit == false ) {
        xClose = close();

        if (Ret == "RS4" || Ret == "RS5"  ){
            Syms = ['FXAIX', 'FNCMX', 'FSMDX', 'FSSNX', 'FSPGX', 'FLCOX', 'FPADX', 'FSRNX', 'FSAGX', 'FSUTX', 'FTBFX' ]
        }
        else Syms = ['FXAIX'];

        for (i = 0; i < Syms.length; i++) {
            xCloseSym = close( sym(Syms[i]) );
            xRS1[i] = efsInternal("Calc_RS1", xClose, xCloseSym);
        }

        Fast = ema(Periods, xRS1[0]);
        Med = sma(7, Fast);
        Slow = sma(15, Fast);
        Vslow = sma(30, Slow);

        if (Ret == "RS4" || Ret == "RS5"  ){
            xRS3x = efsInternal("Calc_RS3", xRS1);
            RS4 = efsInternal("Calc_RS4", xRS3x);
            RS4osc = sma(3,RS4);
            Mv = sma(5, RS4osc);

            if (Ret == "RS5") {
                mvRS4 = wma(4,RS4);
                RS4up = efsInternal("Calc_RS4up", RS4, mvRS4);
                x = efsInternal("Calc_x", RS4);
                RS5 = efsInternal("Calc_R5",RS4up, Periods1, x)
            }
        }


        bInit = true;
    }

    if (Ret == "RS2t") {
        if (Fast.getValue(0)>=Med.getValue(0) && Med.getValue(0)>=Slow.getValue(0) && Slow.getValue(0)>=Vslow.getValue(0)) {
            Tier1=10;
        }
        else Tier1=0;

        if (Fast.getValue(0)>=Med.getValue(0) && Med.getValue(0)>=Slow.getValue(0) && Slow.getValue(0)<Vslow.getValue(0)) {
            Tier2=9;
        }
        else Tier2=0;

        if (Fast.getValue(0)<Med.getValue(0) && Med.getValue(0)>=Slow.getValue(0) && Slow.getValue(0)>=Vslow.getValue(0)) {
            Tier3=9;
        }
        else Tier3=0;

        if (Fast.getValue(0)<Med.getValue(0) && Med.getValue(0)>=Slow.getValue(0) && Slow.getValue(0)<Vslow.getValue(0)) {
            Tier4=5;
        }
        else Tier4=0;

        var RS2t=Tier1+Tier2+Tier3+Tier4;
    }

    if (Ret == "RS2spx"){
        setCursorLabelName("RS1", 0);
        setCursorLabelName("Fast MA", 1);
        setCursorLabelName("Medium MA", 2);
        setCursorLabelName("Slow MA", 3);
        setCursorLabelName("Very Slow MA", 4);
        return [xRS1[0].getValue(0), Fast.getValue(0), Med.getValue(0), Slow.getValue(0), Vslow.getValue(0)]
    }
    else if (Ret == "RS2t") {
        setCursorLabelName("RS2t", 0);
        return RS2t;
    }
    else if (Ret == "RS4"){
        setCursorLabelName("RS4", 0);
        setCursorLabelName("RS4r Oscillator", 1);
        setCursorLabelName("SMA5", 2);
        addBand(80, PS_DASH, 1, Color.grey )
        addBand(100, PS_DASH, 1, Color.grey )
        return [Math.round(RS4.getValue(0)), RS4osc.getValue(0), Mv.getValue(0)];
    }
    else if (Ret == "RS5") {
        setCursorLabelName("RS5", 0);
        return RS5.getValue(0)
    }
    else return;

}

function Calc_R5 (RS4up, Periods1, x){
    var ret = 0;

    if (RS4up) {
        var Sum = 0;
        for (var i = 0; i < Periods1; i++)
            {
                Sum = Sum + x.getValue(-i)
            }
        ret = Sum / Periods1 * 100;
    }
    else  ret = 0;

    return ret;
}

function Calc_x (RS4){
    var ret = 0;
    if (RS4.getValue(0) >= 80) ret = 1
    else ret = 0;
    return ret;
}

function Calc_RS4up(RS4, mvRS4){
    var ret = (RS4.getValue(0) >= 0 || RS4.getValue(0) > mvRS4.getValue(0))
    return ret;
}

function Calc_RS4 (xRS3x){
    var ret = (xRS3x.getValue(0) / 11) * 10;
    return ret;
}

function Calc_RS1 (xClose, xCloseSym) {
    var RS1 = 0;

    if (xCloseSym.getValue(0) > 0 ) {
        RS1 = xClose.getValue(0) / xCloseSym.getValue(0)
    }
    else {
        var myRS1 = ref(-1);
        RS1 = myRS1[0]
    }

    return RS1;
}

function Calc_RS3(xRS1){
    var ret = 0;
    for (i = 0; i < xRS1.length; i++){
        ret = ret + xRS1[i].getValue(0);
    }
    return ret;
}

function verify(){
    var b = false;
    if (getBuildNumber() < 779){

        drawTextAbsolute(5, 35, "This study requires version 10.6 or later.",
            Color.white, Color.blue, Text.RELATIVETOBOTTOM|Text.RELATIVETOLEFT|Text.BOLD|Text.LEFT,
            null, 13, "error");
        drawTextAbsolute(5, 20, "Click HERE to upgrade.@URL=https://www.esignal.com/download/default.asp",
            Color.white, Color.blue, Text.RELATIVETOBOTTOM|Text.RELATIVETOLEFT|Text.BOLD|Text.LEFT,
            null, 13, "upgrade");
        return b;
    }
    else
        b = true;

    return b;
}
—Eric Lippert
eSignal, an Interactive Data company
800 779-6555, www.eSignal.com
BACK TO LIST

OMNITRADER: SEPTEMBER 2020
The following OmniLanguage has been developed by Nirvana Systems based on James Garofallou’s article in this issue for use by readers.
RS2
#Indicator
#PARAM "Periods", 10
#PARAM "SymbolIndex", 0
Dim RS1, Fast, Med, Slow, VSlow, Tier1, Tier2, Tier3, Tier4, RS2t, RefClose as Single

Select Case SymbolIndex
	Case 0: RefClose = GetClose("FXAIX")
	Case 1: RefClose = GetClose("FNCMX")
	Case 2: RefClose = GetClose("FSMDX")
	Case 3: RefClose = GetClose("FSSNX")
	Case 4: RefClose = GetClose("FSPGX")
	Case 5: RefClose = GetClose("FLCOX")
	Case 6: RefClose = GetClose("FPADX")
	Case 7: RefClose = GetClose("FSRNX")
	Case 8: RefClose = GetClose("FSAGX")
	Case 9: RefClose = GetClose("FSUTX")
	Case 10: RefClose = GetClose("FTBFX")
End Select

If RefClose > 0 then
	RS1=(C/RefClose)	'Value of RS1: black
Else
	RS1=RS1[1]
End if

Fast=EMA(RS1,Periods) 	'Fast MA: Orange
Med=SMA(Fast,7) 	'Medium MA: Green
Slow=SMA(Fast,15) 	'Slow MA: Red
Vslow=SMA(Slow,30) 	'V Slow MA: Blue

If Fast>=Med and Med>=Slow and Slow>=Vslow then
	Tier1=10
Else
	Tier1=0
End if

If Fast>=Med and Med>=Slow and Slow<Vslow then
	Tier2=9
Else
	Tier2=0
End if

If Fast<Med and Med>=Slow and Slow>=Vslow then
	Tier3=9
Else
	Tier3=0
End if

If Fast<Med and Med>=Slow and Slow<Vslow then
	Tier4=5
Else
	Tier4=0
End if

RS2t=Tier1+Tier2+Tier3+Tier4 	'Value of RS2t for SPX

Plot("RS2spx", RS1, Black, 1) 	'Instructions to Plot Chart
Plot("Fast MA",Fast, DarkOrange, 9)
Plot("Medium MA",Med, MediumSeaGreen, 9)
Plot("Slow MA", Slow, Crimson, 9)
Plot("Very Slow MA", VSlow, SteelBlue, 9)
Return RS2t

RS4
#Indicator
#PARAM "Periods", 10
Dim RS3x, RS4Value, RS4osc, Spx, Ndx, Mcp, Sml, Lgr, Gld As Single
Dim Lva, Emg, Rel, Utl, Bnd, Mv As Single

Spx=RS2(Periods, 0) 	'SPX 500: FXAIX
Ndx=RS2(Periods, 1) 	'NASDQ 100: FNCMX
Mcp=RS2(Periods, 2) 	'Mid Cap: FSMDX
Sml=RS2(Periods, 3) 	'Small Cap: FSSNX
Lgr=RS2(Periods, 4) 	'Large Growth: FSPGX
Lva=RS2(Periods, 5) 	'Large Val: FLCOX
Emg=RS2(Periods, 6) 	'Emerging Market: FPADX
Rel=RS2(Periods, 7) 	'Real Estate: FSRNX
Gld=RS2(Periods, 8) 	'Gold: FSAGX
Utl=RS2(Periods, 9) 	'Utilities: FSUTX
Bnd=RS2(Periods, 10) 	'Total Bond: FTBFX

RS3x=(Spx+Ndx+Mcp+Sml+Lgr+Lva+Emg+Rel+Gld+Utl+Bnd)
                      	'Raw summed score of RS3x
RS4Value=(RS3x/11)*10 	'Scaled to 0 to 100
RS4osc=SMA(RS4Value,3) 	'RS Oscillator
Mv=SMA(RS4osc,5) 	'RSosc's Signal line

Plot("RS4r Oscillator", RS4osc, DarkSlateBlue, 6)
Plot("SMA5", Mv, Crimson, 3)
SetScales(0, 100)
PlotLabel(80)
PlotLabel(100)

Return ROUND(RS4Value) 		'Rounded to integers

RS5
#Indicator
#PARAM "Periods", 10
Dim RS4Value, mvRS4, R5, X as single
Dim RS4up As Boolean

RS4Value=RS4(Periods)
mvRS4=WMA(RS4Value,4) 		'Moving Avg of RS4
RS4up=(RS4Value>=80 Or RS4Value>mvRS4) 	'RS4 is above signal line

If RS4Value>=80 then				'RS4 must be >= 80
	X=1
Else
	X=0
End if

If RS4up then
	R5=(Sum(X,Periods)/Periods)*100 	'Avg of >80 scores in period
Else
	R5=0
End if

Return ROUND(R5)
—Nirvana Systems Inc.
BACK TO LIST

METASTOCK: SEPTEMBER 2020
James Garofallou’s article in this issue “Tracking Relative Strength in Four Dimensions” introduces an expanded calculation of the standard relative strength comparative indicator. The MetaStock version requires separating the formula into several helper indicators. The final calculation of RS4r and RS5 is the only formula intended to be plotted on a chart.
Please note: You must make the helper indicators first. If you change the names of the helper indicators, you must change the references to them in the RS4r formula. We recommend not changing the names unless you are familiar with the MetaStock formula language.
Also note: You can change the funds used in the RS4r calculation by changing the ticker symbols used in the helper indicators. Each one lists a single fund’s symbol on the first line of the formula.
The code is shown here:
RS4r:
Formula:
rsFXAIX:= FmlVar("- RS3 - FXAIX","RSVAL");
rsFNCMX:= FmlVar("- RS3 - FNCMX","RSVAL");
rsFSMDX:= FmlVar("- RS3 - FSMDX","RSVAL");
rsFSSNX:= FmlVar("- RS3 - FSSNX","RSVAL");
rsFSPGX:= FmlVar("- RS3 - FSPGX","RSVAL");
rsFLCOX:= FmlVar("- RS3 - FLCOX","RSVAL");
rsFPADX:= FmlVar("- RS3 - FPADX","RSVAL");
rsFSAGX:= FmlVar("- RS3 - FSAGX","RSVAL");
rsFSUTX:= FmlVar("- RS3 - FSUTX","RSVAL");
rsFTBFX:= FmlVar("- RS3 - FTBFX","RSVAL");
rsFSRNX:= FmlVar("- RS3 - FSRNX","RSVAL");

RS4r:= ( (rsFXAIX + rsFNCMX + rsFSMDX + rsFSSNX +
rsFSPGX + rsFLCOX + rsFPADX + rsFSAGX + rsFSUTX +
rsFTBFX + rsFSRNX) / 11 ) * 10;

RS5 := (Sum(RS4r, 15) / 15);

RS4r;
RS5

- RS3 - FLCOX:
Formula:
sec:= Security("ONLINE:FLCOX.O", C);
rs:= C/sec;
mafa:= Mov(rs, 10, E);
mame:= Mov(mafa, 7, S);
masl:= Mov(mafa, 15, S);
mavs:= Mov(masl, 30, S);

rsfa:= mafa > mame;
rsme:= mame > masl;
rssl:= masl > mavs;

rsval:= If(rsfa AND rsme AND rssl, 10, 0) +
If(rsfa AND rsme AND rssl=0, 9, 0) +
If(rsfa=0 AND rsme AND rssl, 9, 0) +
If(rsfa=0 AND rsme AND rssl=0, 5, 0);

- RS3 - FNCMX:
Formula:
sec:= Security("ONLINE:FNCMX.O", C);
rs:= C/sec;
mafa:= Mov(rs, 10, E);
mame:= Mov(mafa, 7, S);
masl:= Mov(mafa, 15, S);
mavs:= Mov(masl, 30, S);

rsfa:= mafa > mame;
rsme:= mame > masl;
rssl:= masl > mavs;

rsval:= If(rsfa AND rsme AND rssl, 10, 0) +
If(rsfa AND rsme AND rssl=0, 9, 0) +
If(rsfa=0 AND rsme AND rssl, 9, 0) +
If(rsfa=0 AND rsme AND rssl=0, 5, 0);

- RS3 - FPADX:
Formula:
sec:= Security("ONLINE:FPADX.O", C);
rs:= C/sec;
mafa:= Mov(rs, 10, E);
mame:= Mov(mafa, 7, S);
masl:= Mov(mafa, 15, S);
mavs:= Mov(masl, 30, S);

rsfa:= mafa > mame;
rsme:= mame > masl;
rssl:= masl > mavs;

rsval:= If(rsfa AND rsme AND rssl, 10, 0) +
If(rsfa AND rsme AND rssl=0, 9, 0) +
If(rsfa=0 AND rsme AND rssl, 9, 0) +
If(rsfa=0 AND rsme AND rssl=0, 5, 0);

- RS3 - FSAGX:
Formula:
sec:= Security("ONLINE:FSAGX.O", C);
rs:= C/sec;
mafa:= Mov(rs, 10, E);
mame:= Mov(mafa, 7, S);
masl:= Mov(mafa, 15, S);
mavs:= Mov(masl, 30, S);

rsfa:= mafa > mame;
rsme:= mame > masl;
rssl:= masl > mavs;

rsval:= If(rsfa AND rsme AND rssl, 10, 0) +
If(rsfa AND rsme AND rssl=0, 9, 0) +
If(rsfa=0 AND rsme AND rssl, 9, 0) +
If(rsfa=0 AND rsme AND rssl=0, 5, 0);

- RS3 - FSMDX:
Formula:
sec:= Security("ONLINE:FSMDX.O", C);
rs:= C/sec;
mafa:= Mov(rs, 10, E);
mame:= Mov(mafa, 7, S);
masl:= Mov(mafa, 15, S);
mavs:= Mov(masl, 30, S);

rsfa:= mafa > mame;
rsme:= mame > masl;
rssl:= masl > mavs;

rsval:= If(rsfa AND rsme AND rssl, 10, 0) +
If(rsfa AND rsme AND rssl=0, 9, 0) +
If(rsfa=0 AND rsme AND rssl, 9, 0) +
If(rsfa=0 AND rsme AND rssl=0, 5, 0);

- RS3 - FSPGX:
Formula:
sec:= Security("ONLINE:FSPGX.O", C);
rs:= C/sec;
mafa:= Mov(rs, 10, E);
mame:= Mov(mafa, 7, S);
masl:= Mov(mafa, 15, S);
mavs:= Mov(masl, 30, S);

rsfa:= mafa > mame;
rsme:= mame > masl;
rssl:= masl > mavs;

rsval:= If(rsfa AND rsme AND rssl, 10, 0) +
If(rsfa AND rsme AND rssl=0, 9, 0) +
If(rsfa=0 AND rsme AND rssl, 9, 0) +
If(rsfa=0 AND rsme AND rssl=0, 5, 0);

- RS3 - FSRNX:
Formula:
sec:= Security("ONLINE:FSRNX.O", C);
rs:= C/sec;
mafa:= Mov(rs, 10, E);
mame:= Mov(mafa, 7, S);
masl:= Mov(mafa, 15, S);
mavs:= Mov(masl, 30, S);

rsfa:= mafa > mame;
rsme:= mame > masl;
rssl:= masl > mavs;

rsval:= If(rsfa AND rsme AND rssl, 10, 0) +
If(rsfa AND rsme AND rssl=0, 9, 0) +
If(rsfa=0 AND rsme AND rssl, 9, 0) +
If(rsfa=0 AND rsme AND rssl=0, 5, 0);

- RS3 - FSSNX:
Formula:
sec:= Security("ONLINE:FSSNX.O", C);
rs:= C/sec;
mafa:= Mov(rs, 10, E);
mame:= Mov(mafa, 7, S);
masl:= Mov(mafa, 15, S);
mavs:= Mov(masl, 30, S);

rsfa:= mafa > mame;
rsme:= mame > masl;
rssl:= masl > mavs;

rsval:= If(rsfa AND rsme AND rssl, 10, 0) +
If(rsfa AND rsme AND rssl=0, 9, 0) +
If(rsfa=0 AND rsme AND rssl, 9, 0) +
If(rsfa=0 AND rsme AND rssl=0, 5, 0);

- RS3 - FSUTX:
Formula:
sec:= Security("ONLINE:FSUTX.O", C);
rs:= C/sec;
mafa:= Mov(rs, 10, E);
mame:= Mov(mafa, 7, S);
masl:= Mov(mafa, 15, S);
mavs:= Mov(masl, 30, S);

rsfa:= mafa > mame;
rsme:= mame > masl;
rssl:= masl > mavs;

rsval:= If(rsfa AND rsme AND rssl, 10, 0) +
If(rsfa AND rsme AND rssl=0, 9, 0) +
If(rsfa=0 AND rsme AND rssl, 9, 0) +
If(rsfa=0 AND rsme AND rssl=0, 5, 0);

- RS3 - FTBFX:
Formula:
sec:= Security("ONLINE:FTBFX.O", C);
rs:= C/sec;
mafa:= Mov(rs, 10, E);
mame:= Mov(mafa, 7, S);
masl:= Mov(mafa, 15, S);
mavs:= Mov(masl, 30, S);

rsfa:= mafa > mame;
rsme:= mame > masl;
rssl:= masl > mavs;

rsval:= If(rsfa AND rsme AND rssl, 10, 0) +
If(rsfa AND rsme AND rssl=0, 9, 0) +
If(rsfa=0 AND rsme AND rssl, 9, 0) +
If(rsfa=0 AND rsme AND rssl=0, 5, 0);

- RS3 - FXAIX:
Formula:
sec:= Security("ONLINE:FXAIX.O", C);
rs:= C/sec;
mafa:= Mov(rs, 10, E);
mame:= Mov(mafa, 7, S);
masl:= Mov(mafa, 15, S);
mavs:= Mov(masl, 30, S);

rsfa:= mafa > mame;
rsme:= mame > masl;
rssl:= masl > mavs;

rsval:= If(rsfa AND rsme AND rssl, 10, 0) +
If(rsfa AND rsme AND rssl=0, 9, 0) +
If(rsfa=0 AND rsme AND rssl, 9, 0) +
If(rsfa=0 AND rsme AND rssl=0, 5, 0);
—William Golson
MetaStock Technical Support
www.MetaStock.com
BACK TO LIST

WEALTH-LAB: SEPTEMBER 2020
This month, we’ll show how to screen for symbols that meet a specified criteria as of the most recent date. The criteria here is the value of an oscillator like RS4 or RS5 (which are discussed in James Garofallou’s article in this issue, “Tracking Relative Strength In Four Dimensions”): the strongest-ranked funds get the preference.
To set things up, first have your index funds (or whatever instruments are required) in a Wealth-Lab DataSet and update their data. Then in the screener code, type in your symbol names instead of the author’s choice of funds:
{"FXAIX", "FNCMX", "FSMDX", "FSSNX", "FSPGX", "FLCOX", "FPADX", "FSRNX", "FSAGX", "FSUTX", "FTBFX"};
By running the screener on a DataSet of chosen symbols in portfolio backtest mode, you’ll get a list of signals to buy on the open in the alerts view as in Figure 3.
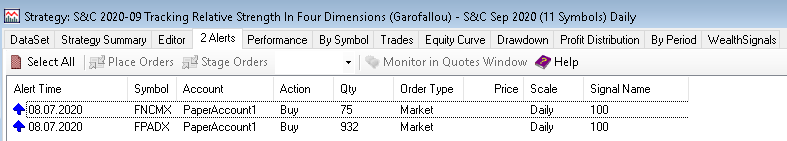
FIGURE 3: WEALTH-LAB. This shows a view of the alerts tab with two signals with the highest reading of the RS5 oscillator.
If you wish to visualize the oscillators, doubleclick on any trading signal. Wealth-Lab will plot them on a chart, as in Figure 4.
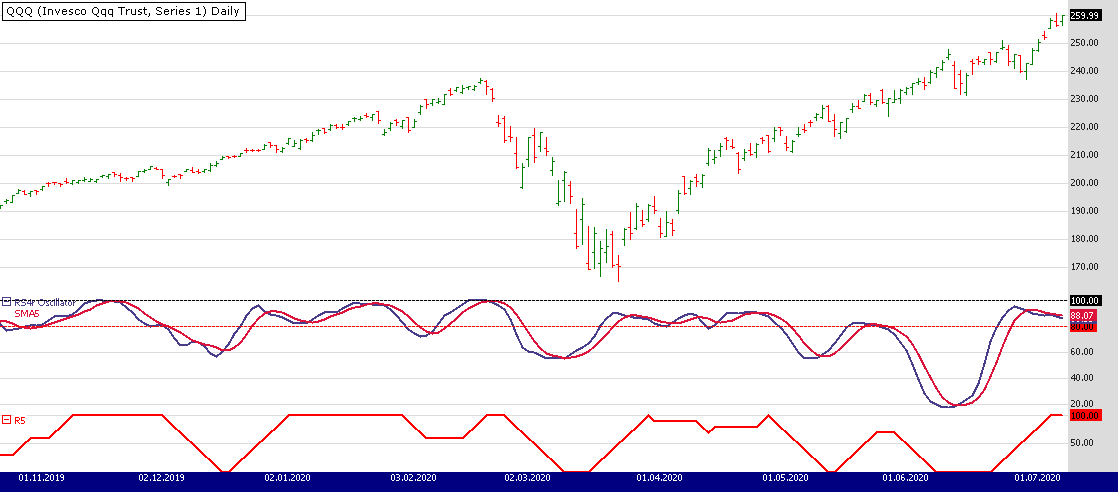
FIGURE 4: WEALTH-LAB. This shows a sample plot of the RS4 and RS5 oscillators built using author’s default set of 11 index funds on the daily chart of QQQ. Index fund data provided by Tiingo.
On a closing note, simply download public strategies from Wealth-Lab (hit Ctrl-O and choose download...) to get the trading system code. The code is also shown here:
Wealth-Lab strategy code (C#):

using System;
using System.Collections.Generic;
using System.Text;
using System.Drawing;
using WealthLab;
using WealthLab.Indicators;

namespace WealthLab.Strategies
{
	public class TASC2020_09 : WealthScript
	{
		LineStyle ls = LineStyle.Solid;

		public DataSeries RS2t(DataSeries ds, string index, int period = 10, bool plotSeries = false)
		{
			var rs = new DataSeries(ds, string.Format("RS2t({0},{1},{2}", ds.Description, index, period));
			var extSym = GetExternalSymbol( index, true);
			var RS1 = ds / extSym.Close;

			var Fast = EMAModern.Series(RS1, period);
			var Med = SMA.Series(Fast, 7);
			var Slow = SMA.Series(Fast, 15);
			var Vslow = SMA.Series(Slow, 30);

			int Tier1 = 0, Tier2 = 0, Tier3 = 0, Tier4 = 0;

			for (int bar = GetTradingLoopStartBar( Math.Max(period * 3, 30)); bar < ds.Count; bar++)
			{
				Tier1 = (Fast[bar] >= Med[bar] && Med[bar] >= Slow[bar] && Slow[bar] >= Vslow[bar]) ? 10 : 0;
				Tier2 = (Fast[bar] >= Med[bar] && Med[bar] >= Slow[bar] && Slow[bar] < Vslow[bar]) ? 9 : 0;
				Tier3 = (Fast[bar] < Med[bar] && Med[bar] >= Slow[bar] && Slow[bar] >= Vslow[bar]) ? 9 : 0;
				Tier4 = (Fast[bar] < Med[bar] && Med[bar] >= Slow[bar] && Slow[bar] < Vslow[bar]) ? 5 : 0;

				rs[bar] = Tier1 + Tier2 + Tier3 + Tier4;
			}

			if (plotSeries)
			{
				var rp = CreatePane( 50, false, true);
				PlotSeries( rp, RS1, Color.Black, ls, 1);
				PlotSeries( rp, Fast, Color.DarkOrange, ls, 2);
				PlotSeries( rp, Med, Color.MediumSeaGreen, ls, 2);
				PlotSeries( rp, Slow, Color.Crimson, ls, 2);
				PlotSeries( rp, Vslow, Color.SteelBlue, ls, 2);
			}

			return rs;
		}

		protected override void Execute()
		{
			int period = 10;
			var lstIndices = new List<string>()
			{ "FXAIX", "FNCMX", "FSMDX", "FSSNX", "FSPGX", "FLCOX", "FPADX", "FSRNX", "FSAGX", "FSUTX", "FTBFX"};

			var RS3x = Close * 0;
			foreach (var fund in lstIndices)
			{
				RS3x += RS2t(Close, fund, period);
			}

			var RS4 = (RS3x / lstIndices.Count) * 10;
			for (int bar = 0; bar < RS4.Count; bar++) RS4[bar] = Math.Round(RS4[bar]);
			var RS4osc = SMA.Series(RS4, 3);
			var Mv = SMA.Series(RS4osc, 5);

			var rp = CreatePane( 40, false, true);
			PlotSeries( rp, RS4osc, Color.DarkSlateBlue, ls, 2, "RS4r Oscillator");
			PlotSeries( rp, Mv, Color.Crimson, ls, 2, "SMA5");
			HideVolume();

			DrawHorzLine( rp, 80, Color.Red, LineStyle.Dashed, 1);
			DrawHorzLine( rp, 100, Color.Black, LineStyle.Dashed, 1);

			var mvRS4 = WMA.Series(RS4, 4);
			var R5 = new DataSeries(Close, string.Format("R5({0})",period));
			var x = Open * 0;
			for (int bar = 1; bar < RS4.Count; bar++)
			{
				bool RS4up = (RS4[bar] >= 80 || RS4[bar] > mvRS4[bar]);
				x[bar] = RS4[bar] >= 80 ? 1 : 0;
			}

			//Avg of >80 scores in period
			for (int bar = 1; bar < RS4.Count; bar++)
				R5[bar] = (Sum.Series(x, period)[bar] / period) * 100;

			var rp5 = CreatePane( 20, false, true);
			PlotSeries( rp5, R5, Color.Red, ls, 2, "R5");

			int b = Bars.Count - 1; // the last chart bar number
			if (b < Math.Max(period * 3, 30)) return;
			//if ( RS4osc[b] > 80 ) BuyAtMarket( b+1, Math.Round(RS4osc[b]).ToString());
			if ( R5[b] > 80 ) BuyAtMarket( b+1, Math.Round(R5[b]).ToString());
		}
	}
}
—Gene Geren (Eugene)
Wealth-Lab team
www.wealth-lab.com
BACK TO LIST

THINKORSWIM: SEPTEMBER 2020
We have put together a study based on “Tracking Relative Strength In Four Dimensions” by James Garofallou in this issue. We built the studies referenced by using our proprietary scripting language, thinkscript. To ease the loading process, simply click on https://tos.mx/LOZmmQi or enter it into setup→open shared item from within thinkorswim, then choose view thinkScript study and name it “RelativeStrengthRankOrder.” This can then be added to your chart from the edit study and strategies menu within thinkorswim charts. This study can added as a watchlist column akin to the way it is used in the article.
Figure 5 shows the correspondent oscillator plots for the study with the rank-ordered plot itself hidden utilizing a two-year, three-day chart of FSAGX. Using it as a watchlist column will allow you to display this indicator similarly to the way the author uses it in his article. See James Garofallou’s article for more details on how to interpret this indicator.
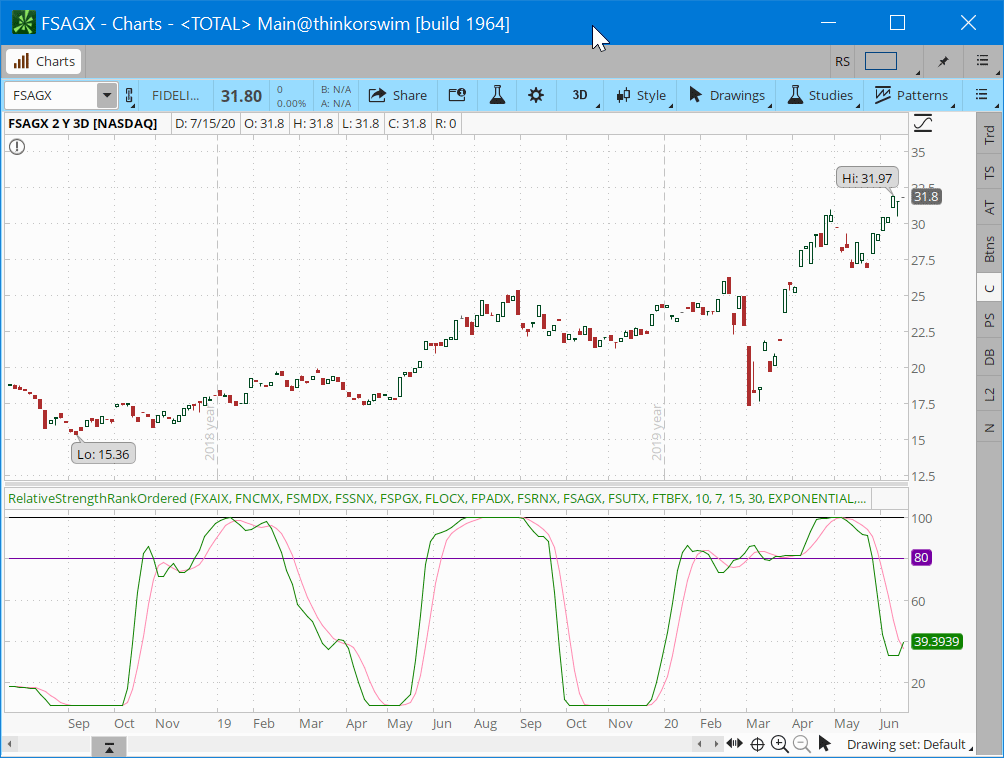
FIGURE 5: THINKORSWIM. Displayed here are the oscillator plots for the referenced study on a sample chart of FSAGX.
—thinkorswim
A division of TD Ameritrade, Inc.
www.thinkorswim.com
BACK TO LIST

NEUROSHELL TRADER: SEPTEMBER 2020
The RS4r indicator described by James Garofallou in his article in this issue, “Tracking Relative Strength In Four Dimensions,” can be easily implemented in NeuroShell Trader by combining some of NeuroShell Trader’s 800+ indicators. To implement the indicator, select new indicator from the insert menu and use the indicator wizard to set up the following indicators:
RS1	Divide( Close, Index Close )
Fast	ExpAvg( RS1, 10 )
Med	Avg( Fast,7 )
Slow	Avg( Fast, 15 )
Vslow	Avg( Slow, 30 )

Cond1	A>=B( Med, Slow )
Cond2 	And2( A>=B( Fast, Med ), A>=B( Slow, Vslow ) )
Cond3	Or2( A>=B( Fast, Med ), A>=B( Slow, Vslow ) )
RS2t 	IfThenElse( Cond1, IfThenElseIfThen( Cond2, 10, Cond3, 9, 5 ), 0 )

RS3x	Add3 ( Add4( RS2t(Close, Spx Close), RS2t(Close, Ndx Close), RS2t(Close, Mcp Close), RS2t(Close, Sml Close)), Add4( RS2t(Close, Lgr Close), RS2t(Close, Lva Close) , RS2t(Close, Emg Close), RS2t(Close, Rel Close)), Add3( RS2t(Close, Gld Close), RS2t(Close, Utl Close), RS2t(Close, Bnd Close) ) )

RS4	Multiply( Divide( RS3x, 11), 10 )
RS4osc	Avg ( RS4, 3 )
RS4r	Round( RS4 )

Cond	Or2( A>=B( RS4r, 80 ), A>B( RS4r, WgtAvg ( Rs4r, 4 ) ) )
R5	IfThenElse( Cond, Multiply( 100, Avg( A>=B ( RS4r, 80 ), 15 ) ), 0 )
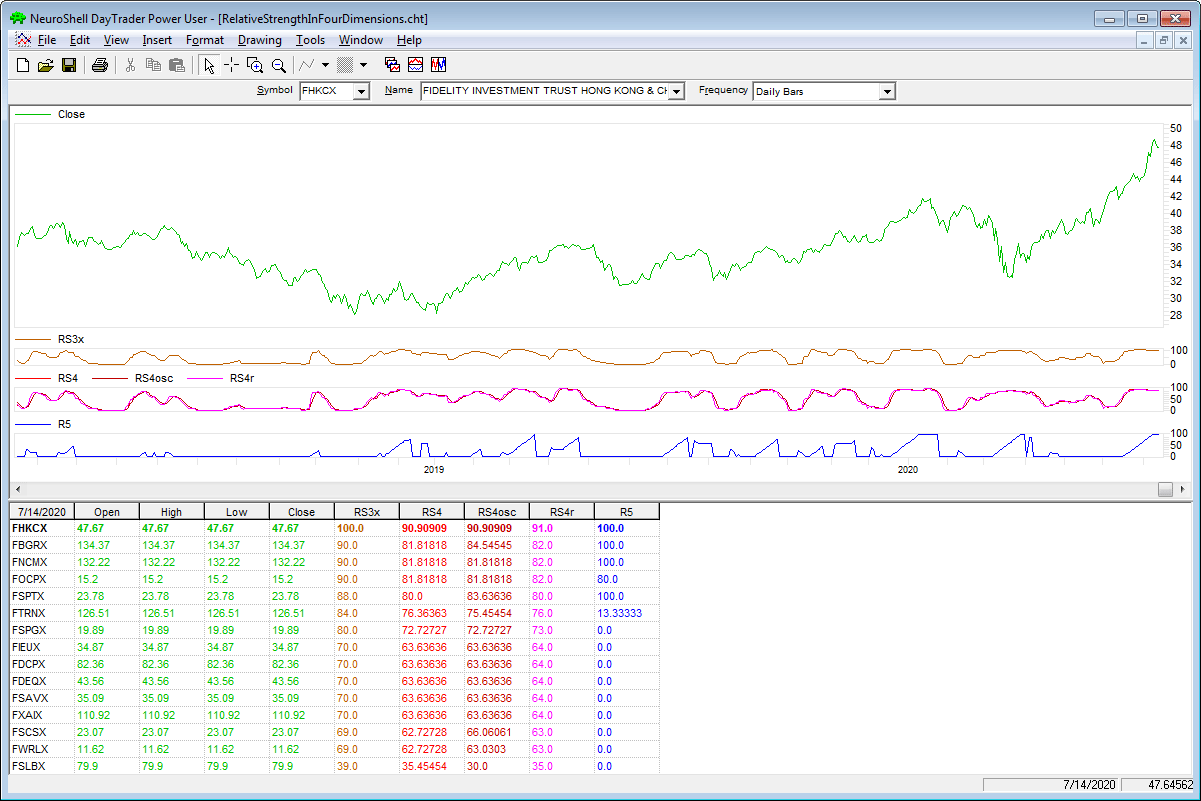
FIGURE 6: NEUROSHELL TRADER. This NeuroShell Trader chart shows sector funds ranked by RS4r values.
NeuroShell Trader users can go to the Stocks & Commodities section of the NeuroShell Trader free technical support website to download a copy of this or any previous Traders’ Tips.
—Marge Sherald, Ward Systems Group, Inc.
301 662-7950, sales@wardsystems.com
www.neuroshell.com
BACK TO LIST

QUANTACULA STUDIO: SEPTEMBER 2020
We implemented the RS2t indicator in the TASC Extension for Quantacula.com and Quantacula Studio. You can drag and drop the indicator onto a chart to plot and visualize its values historically. Additionally, Quantacula lets you build a rotation model by simply selecting a weight indicator and a few other parameters, namely:
- number of securities from the universe to hold at one time
- whether the weight indicator should sort by high or low values
- how often to rebalance the portfolio
Using the rotation model, you can drop the RS2t right onto the model builder, and select highest weight value to easily test the relative strength capability of the indicator. In our testing, the rotation model indeed performed better when highest weight value was selected over lowest weight value, validating the RS2t indicator’s premise as an index for relative strength.
A sample chart plotting the RS2t is shown in Figure 7.
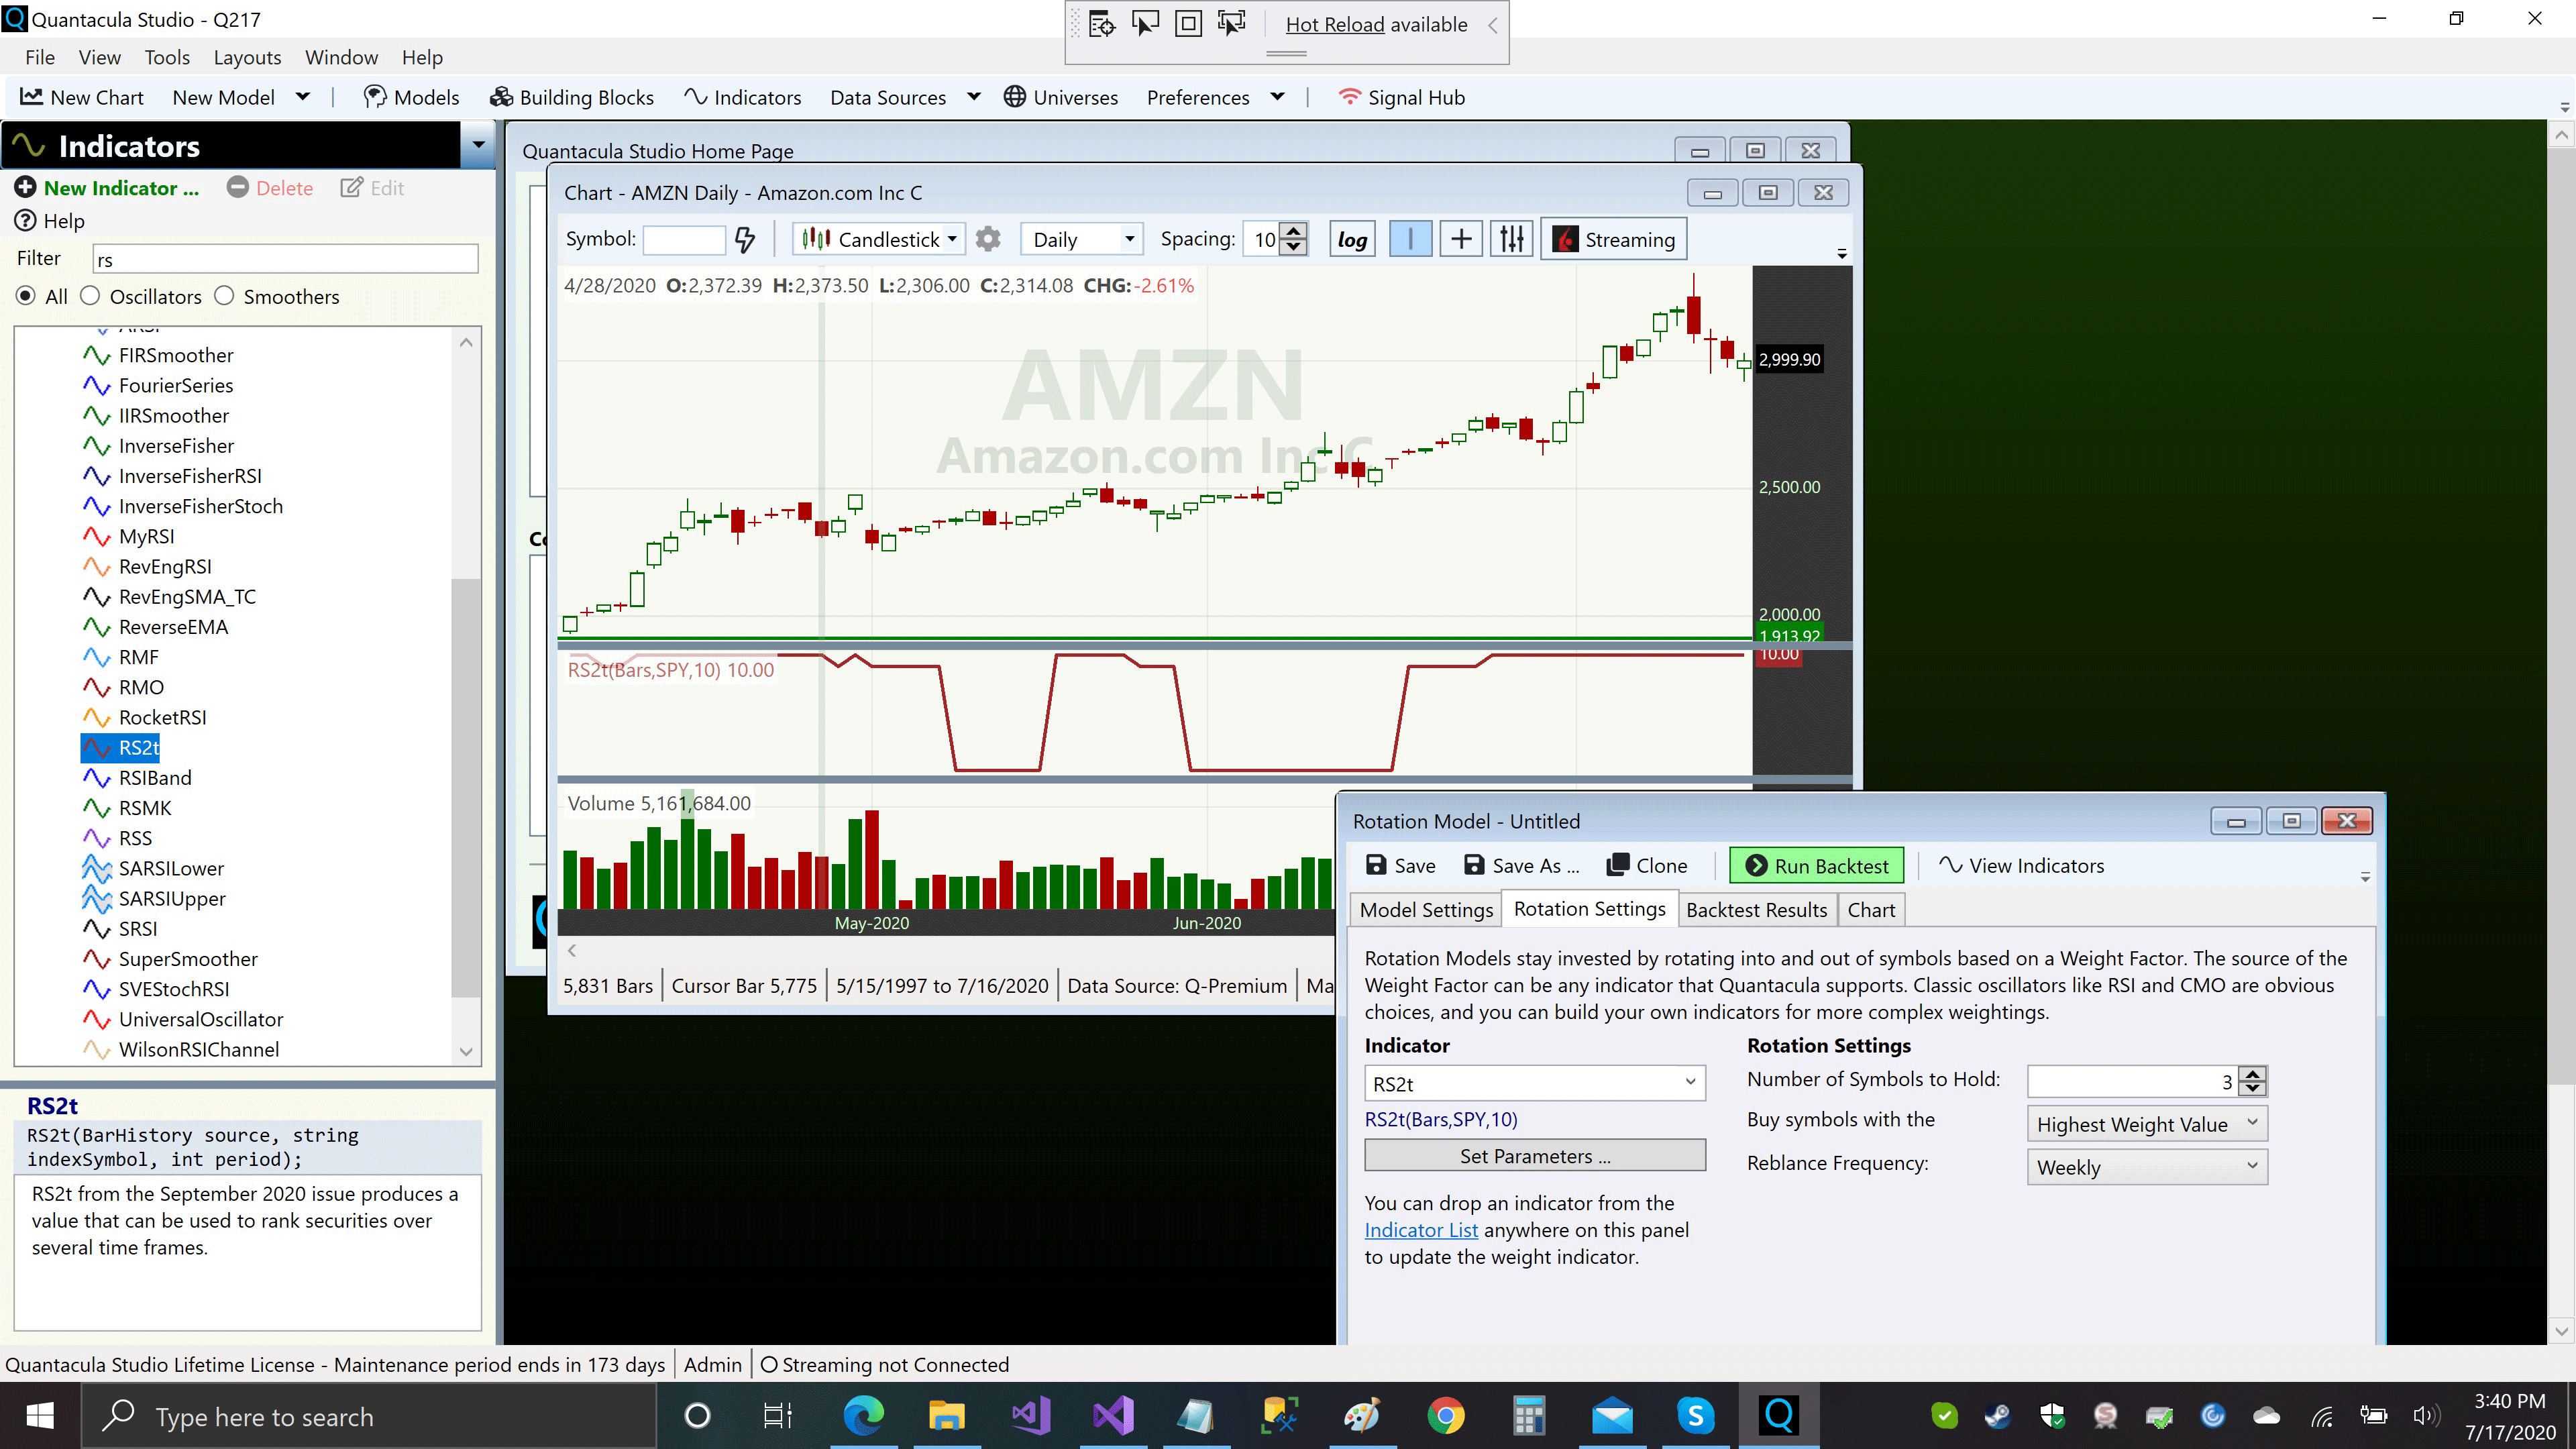
FIGURE 7: QUANTACULA STUDIO. Here is the RS2t indicator plotted as well as a setup for a rotation model.
—Dion Kurczek, Quantacula LLC
info@quantacula.com, www.quantacula.com
BACK TO LIST

OPTUMA: SEPTEMBER 2020
In Optuma you can create a formula for each benchmark index (for example, RS2spx, RS2ndx, RS2mid, etc.) for the technique presented in James Garofallou’s article in this issue, “Tracking Relative Strength In Four Dimensions.” This example is for RS2spx:
IND1 = GETDATA(CODE=SPX:WI);
RS1 = CLOSE()/IND1;
FAST = MA(RS1, CALC=Close, BARS=10, STYLE=Exponential);
MED = MA(FAST, BARS=7, CALC=Close, STYLE=Simple);
SLOW = MA(FAST, BARS=15, CALC=Close);
VSLOW = MA(SLOW, BARS=30, CALC=Close);
S1 = If(MED>=SLOW, 5, 0);
S2 = If((S1>0) and (SLOW>=vSLOW xor FAST>=MED), 4, 0);
S3 = If(S1 > 0 and SLOW>=vSLOW and FAST>=MED, 5, 0);
RS2spx = s1+S2+s3;
RS2spx
Once created, each formula can then be used to calculate RS3x. Here’s an example for five indexes (as opposed to 11, as was used in the article):
RS3x =
SCRIPT(SCRIPTNAME=RS2spx) +
SCRIPT(SCRIPTNAME=RS2ndx) +
SCRIPT(SCRIPTNAME=RS2mid) +
SCRIPT(SCRIPTNAME=RS2sml) +
SCRIPT(SCRIPTNAME=RS2gld);
RS3x
Once RS3x has been created it can be used to create the RS4r:
V1 = SCRIPT(SCRIPTNAME=RS3x);
RS4r = (V1 / 5) * 10;
RS4r
Once RS4r has been calculated it can be used to create the RS5:
V1 = SCRIPT(SCRIPTNAME=RS4r);
RS5 = ACC(V1, RANGE=Look Back Period, BARS=15)/15;
RS5
Figure 8 shows how that looks in a watchlist for the S&P 500 sectors, along with the oscillators on a chart.
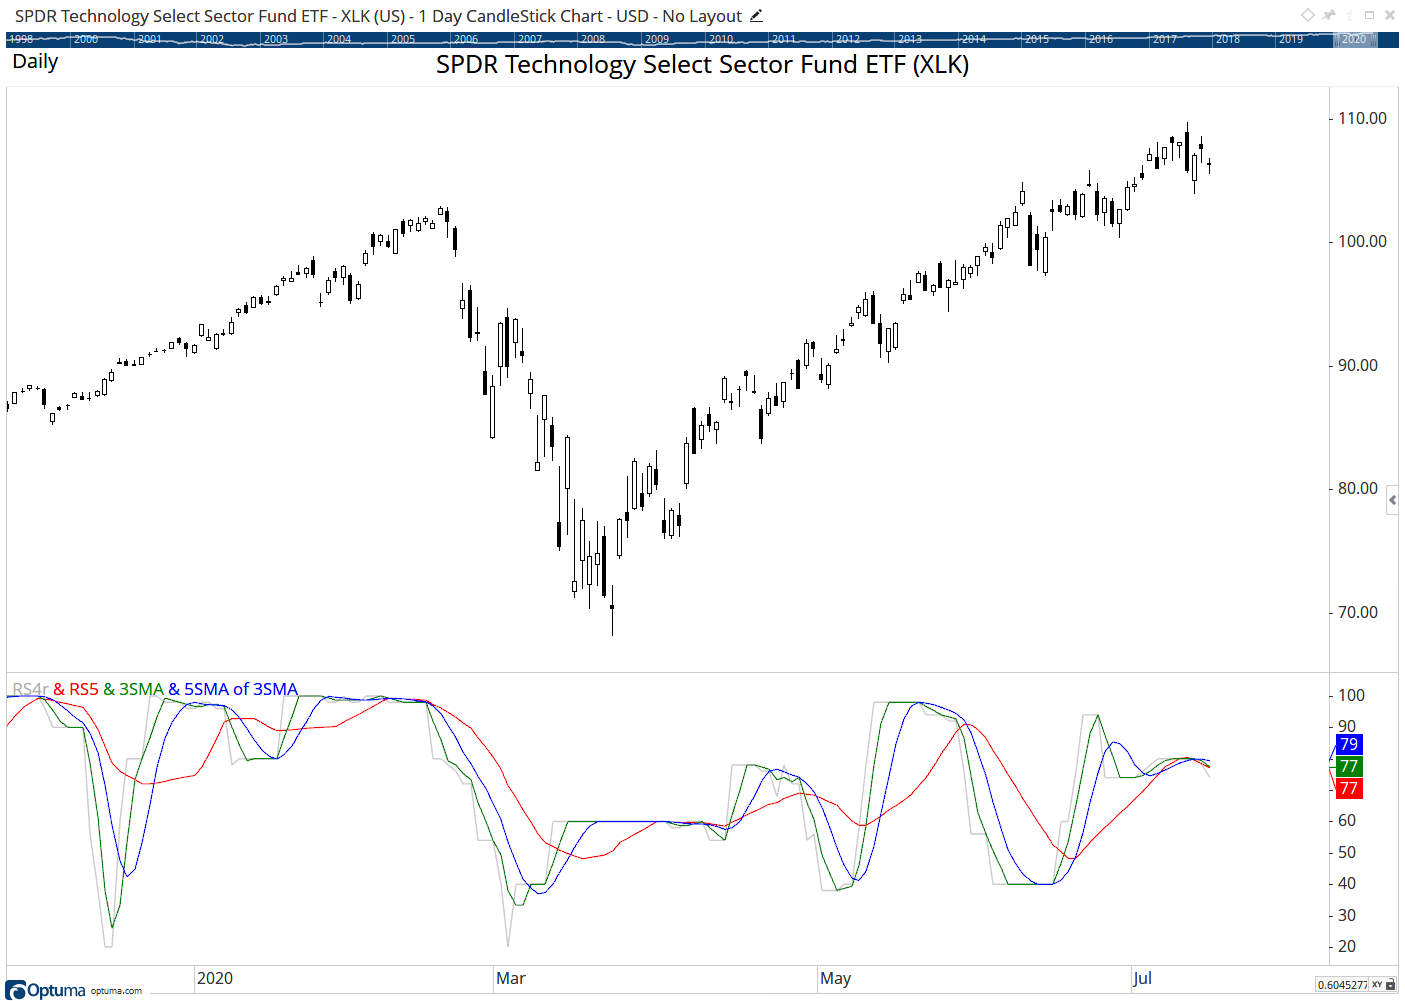
FIGURE 8: OPTUMA. This sample chart displays a watchlist and the oscillators based on James Garofallou’s article.
—support@optuma.com
BACK TO LIST

THE ZORRO PROJECT: SEPTEMBER 2020
In “Tracking Relative Strength In Four Dimensions” in this issue, James Garofallou presents a metric for a security’s strength relative to 11 major market sectors and over several time periods. All this is squeezed into a single value. The first step is the RS2. It normalizes the security to a market index, then calculates four moving averages and encodes their relations in a returned number. Here’s the RS2 code in C for Zorro:
var RS2(var Close, string Index)
{
   assetAdd("IDX",strf("YAHOO:%s",Index));
   if(!asset("IDX")) return quit("Index not found!");
  var RS2 = Close/priceClose(0);
  var Fast = EMA(series(RS2),10*PERIOD);
  var Med = SMA(series(Fast),7*PERIOD);
  var Slow = SMA(series(Fast),15*PERIOD);
  var VSlow = SMA(series(Slow),30*PERIOD);
  if(Fast >= Med && Med >= Slow && Slow >= VSlow)
    return 10;
  else if(Fast >= Med && Med >= Slow && Slow < VSlow)
    return 9;
  else if(Fast < Med && Med >= Slow && Slow >= VSlow)
    return 9;
  else if(Fast < Med && Med >= Slow && Slow < VSlow)
    return 5;
  else
    return 0;
}
The code above takes the close of the security and the name of the index used for normalization. It gets the index price from Yahoo, then calculates four moving averages (MAs) and returns either 10, 9, 5, or 0 depending on how fast the price is rising. Note that all MA periods are multiplied with a predefined PERIOD factor. At first, I was unable to reproduce the author’s charts until I found that his MA periods are not days but apparently candle width units of his chart. He used three-day candles, so I had to multiply all MA periods with a PERIOD of 3. Without this correction, the resulting charts would be very different.
The next step is the RS4, which combines the RS2 values of 11 major market indexes. I used the same Fidelity indexes the author used. The C code for the RS4 indicator is:
var RS4(var Close)
{
  var RS3 = RS2(Close,"FXAIX") // SPX 500
    + RS2(Close,"FNCMX") // Nasdaq
    + RS2(Close,"FSMDX") // Mid Cap
    + RS2(Close,"FSSNX") // Small Cap
    + RS2(Close,"FSPGX") // Large Growth
    + RS2(Close,"FLCOX") // Large Val
    + RS2(Close,"FPADX") // Emerging Market
    + RS2(Close,"FSRNX") // Real Estate
    + RS2(Close,"FSAGX") // Gold
    + RS2(Close,"FSUTX") // Utilities
    + RS2(Close,"FTBFX"); // Total Bond
  return 10*RS3/11;
}
The returned value is normalized by the number of indexes. Now we can replicate the author’s chart with a smoothed RS4, named “RS4osc,” and a further smoothed signal line. For the security, we’re using Fidelity Gold, FSAGX. The code is:
function run()
{
  BarPeriod = 1440;
  StartDate = 20181201;
  EndDate = 20200415;
  LookBack = 200;
  assetAdd("Gold","YAHOO:FSAGX");
  asset("Gold");
  var RS4Osc = SMA(series(RS4(priceClose(0))),3*PERIOD);
  var Mv = SMA(series(RS4Osc),5*PERIOD);
  plot("RS4Osc",RS4Osc,NEW|LINE,BLUE);
  plot("Mv",Mv,LINE,RED);
}
The resulting chart is shown in Figure 9.
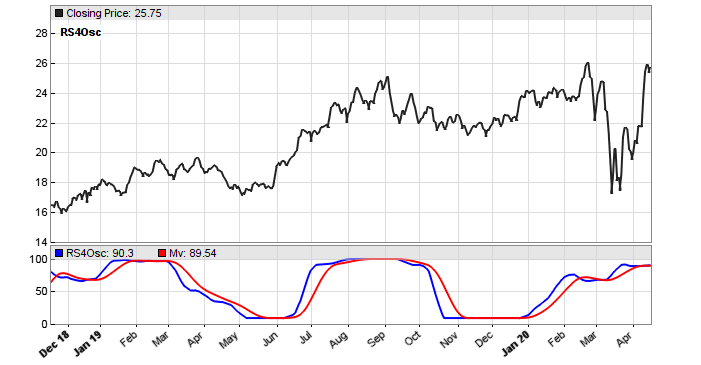
FIGURE 9: ZORRO PROJECT. This chart replicates the author’s chart with a smoothed RS4osc and a smoothed signal line on Fidelity Gold (FSAGX).
So far, so good. But when implementing a new indicator, I’m always curious how it behaves in a real trading system. For finding out, I’m using a basic portfolio rotation system. Of a universe of 10 stocks, it selects the four strongest stocks and invests in them according to their strength. The portfolio is rebalanced at any month. The code is:
function run()
{
  BarPeriod = 1440;
  StartDate = 2012;
  EndDate = 2020;
  LookBack = 200;
  Capital = 10000;

  var Weights[10], Strengths[10];
  string Stock, Stocks[10];
  assetList("assetsIB");
  while(Stock = loop("AAPL","MSFT","XOM","AMZN","JNJ","FB","GE","TSLA","JPM","PG"))
  {
    if(Init) assetHistory(Stock,FROM_STOOQ);
    asset(Stock);
    Stocks[Itor1] = Stock;
    Strengths[Itor1] = RET(30*PERIOD);
  }

  if(month(0) != month(1)) // any new month
  {
    distribute(Weights,Strengths,10,4,0);
    int i;
    for(i = 0; i<10; i++) {
      asset(Stocks[i]);
      int NewShares = Weights[i]*Balance/priceClose(0) - LotsPool;
      if(NewShares > 0)
        enterLong(NewShares);
      else if(NewShares < 0)
        exitLong("",-NewShares);
    }
  }
}
I’ve used 10 major stocks from the S&P 500. The strength is simply defined as the stock return over 30*3 days, which is the same as the “very long” MA period of the RS2. The “distribute” function in the code is a special Zorro function that sorts the stocks according to their strength, and distributes a weight among the four strongest stocks. The remaining six get weight 0. The weights are then converted to positions and rebalanced any month by buying or selling stocks.
The resulting equity curve (note the Covid-19 drop) is shown in Figure 10.
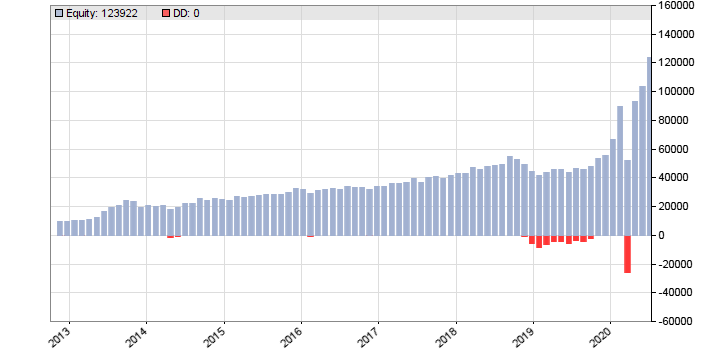
FIGURE 10: ZORRO PROJECT. This shows a sample equity curve for a basic relative strength portfolio rotation system for 10 S&P stocks.
In the backtest from 2013–2020, this system achieves 47% CAGR, mostly due to the strong volatility at the end. It’s a rather risky system and you would probably not want to trade it live. Now what happens when we replace the 90-day return with the RS4? For this we only need to change the line where the strength is calculated:
Strengths[Itor1] = RS4(priceClose(0));
The equity curve of the RS4-based portfolio rotation system is shown in Figure 11.
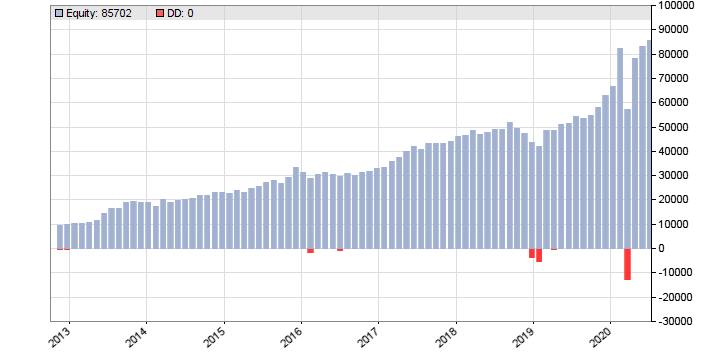
FIGURE 11: ZORRO PROJECT. This shows a sample equity curve for the RS4-based portfolio rotation system.
The CAGR has dropped to 35%. The Covid-19 drop is less significant, but the same can be said about the recovery afterwards. Although the equity curve looks less volatile, the Sharpe ratio is in fact lower, 1.01 compared to 1.11 with the previous return-based system.
Does this mean that the RS4 is inferior to a simple 90-day return? No, because I selected the system and its parameters at random. For really judging the RS4, a lot more testing with a lot more systems would have to be done.
The RS2 and RS4 indicators, as well as the code for the two systems can be downloaded from the 2020 script repository on https://financial-hacker.com. The Zorro platform can be downloaded from https://zorro-project.com.
—Petra Volkova
The Zorro Project by oP group Germany
www.zorro-project.com
BACK TO LIST

AIQ: SEPTEMBER 2020
The importable AIQ EDS file based on James Garofallou’s article in this issue, “The RS4r: Tracking Relative Strength In Four Dimensions,” can be obtained on request via email to info@TradersEdgeSystems.com. The code is also available here:
! The RS4r: Tracking Relative Strength in Four Dimensions
! Author: James Garofallou, PhD, TASC Sept 2020
! Coded by: Richard Denning, 7/18/2020

!INPUTS
C is [close].
len1 is 10.
len2 is 15.
NumIndx is 4.
BuyLvl is 80.

!FORMULAS
SPYc is TickerUDF("SPY",C).      !SP500
QQQc is TickerUDF("QQQ",C).     !NASDAQ100
MDYc is TickerUDF("MDY",C).     !SP400
IWMc is TickerUDF("IWM",C).      !Russel2000

RS1spy is C/SPYc.
RS1qqq is C/QQQc.
RS1mdy is C/MDYc.
RS1iwm is C/IWMc.

FastSPY is Expavg(RS1spy,len1).
MedSPY is Simpleavg(FastSPY,7).
SlowSPY is Simpleavg(FastSPY,15).
VSlowSPY is Simpleavg(SlowSPY,30).

FastQQQ is Expavg(RS1qqq,Len1).
MedQQQ is Simpleavg(FastQQQ,7).
SlowQQQ is Simpleavg(FastQQQ,15).
VSlowQQQ is Simpleavg(SlowQQQ,30).

FastMDY is Expavg(RS1mdy,Len1).
MedMDY is Simpleavg(FastMDY,7).
SlowMDY is Simpleavg(FastMDY,15).
VSlowMDY is Simpleavg(SlowMDY,30).

FastIWM is Expavg(RS1iwm,Len1).
MedIWM is Simpleavg(FastIWM,7).
SlowIWM is Simpleavg(FastIWM,15).
VSlowIWM is Simpleavg(SlowIWM,30).

Tier1spy is iff(FastSPY>=MedSPY and MedSPY>=SlowSPY and SlowSPY>=VslowSPY,10,0).
Tier1qqq is iff(FastQQQ>=MedQQQ and MedQQQ>=SlowQQQ and SlowQQQ>=VslowQQQ,10,0).
Tier1mdy is iff(FastMDY>=MedMDY and MedMDY>=SlowMDY and SlowMDY>=VslowMDY,10,0).
Tier1iwm is iff(FastIWM>=MedIWM and MedIWM>=SlowIWM and SlowIWM>=VslowIWM,10,0).

Tier2spy is iff(FastSPY>=MedSPY and MedSPY>=SlowSPY and SlowSPY<VslowSPY,9,0).
Tier2qqq is iff(FastQQQ>=MedQQQ and MedQQQ>=SlowQQQ and SlowQQQ<VslowQQQ,9,0).
Tier2mdy is iff(FastMDY>=MedMDY and MedMDY>=SlowMDY and SlowMDY<VslowMDY,9,0).
Tier2iwm is iff(FastIWM>=MedIWM and MedIWM>=SlowIWM and SlowIWM<VslowIWM,9,0).

Tier3spy is iff(FastSPY<MedSPY and MedSPY>=SlowSPY and SlowSPY>=VslowSPY,9,0).
Tier3qqq is iff(FastQQQ<MedQQQ and MedQQQ>=SlowQQQ and SlowQQQ>=VslowQQQ,9,0).
Tier3mdy is iff(FastMDY<MedMDY and MedMDY>=SlowMDY and SlowMDY>=VslowMDY,9,0).
Tier3iwm is iff(FastIWM<MedIWM and MedIWM>=SlowIWM and SlowIWM>=VslowIWM,9,0).

Tier4spy is iff(FastSPY<MedSPY and MedSPY>=SlowSPY and SlowSPY<VslowSPY,5,0).
Tier4qqq is iff(FastQQQ<MedQQQ and MedQQQ>=SlowQQQ and SlowQQQ<VslowQQQ,5,0).
Tier4mdy is iff(FastMDY<MedMDY and MedMDY>=SlowMDY and SlowMDY<VslowMDY,5,0).
Tier4iwm is iff(FastIWM<MedIWM and MedIWM>=SlowIWM and SlowIWM<VslowIWM,5,0).

RS2spy is Tier1spy + Tier2spy + Tier3spy + Tier4spy.
RS2qqq is Tier1qqq + Tier2qqq + Tier3qqq + Tier4qqq.
RS2mdy is Tier1mdy + Tier2mdy + Tier3mdy + Tier4mdy.
RS2iwm is Tier1iwm + Tier2iwm + Tier3iwm + Tier4iwm.


RS3x is  (RS2spy+RS2qqq+RS2mdy+RS2iwm).

RS4 is (RS3x/NumIndx)*10.
RS4osc is simpleavg(RS4,3).
mvSig is simpleavg(RS4osc,5).
RS4r is round(RS4).

mvRS4 is expavg(RS4r,4).
RS4up is iff(RS4r >= 80 or RS4r > mvRS4,1,0).

X is iff(RS4 >= 80,1,0).
R5 is iff(RS4up =1,round(simpleavg(X,len2)*100),0).

Buy if R5 >= BuyLvl.
ExitBuy if R5 < BuyLvl.

ShowValues if 1.
Code for the RS4r is included in the EDS file. I also coded a system that uses the RS4r (R5). I used four independent ETFs as indexes rather than the 11 mutual funds that the author used. I used SPY, QQQQ, MDY, and IWM. The trading system buys (long only) when the R5 >= 80 and exits the long position when RS4r < 80. The summary EDS backtest report for trading this system on the Nasdaq 100 stocks (commission & slippage not subtracted) is shown in Figure 13 and a sample trade on DISH with the R5 indicator is shown in Figure 12.
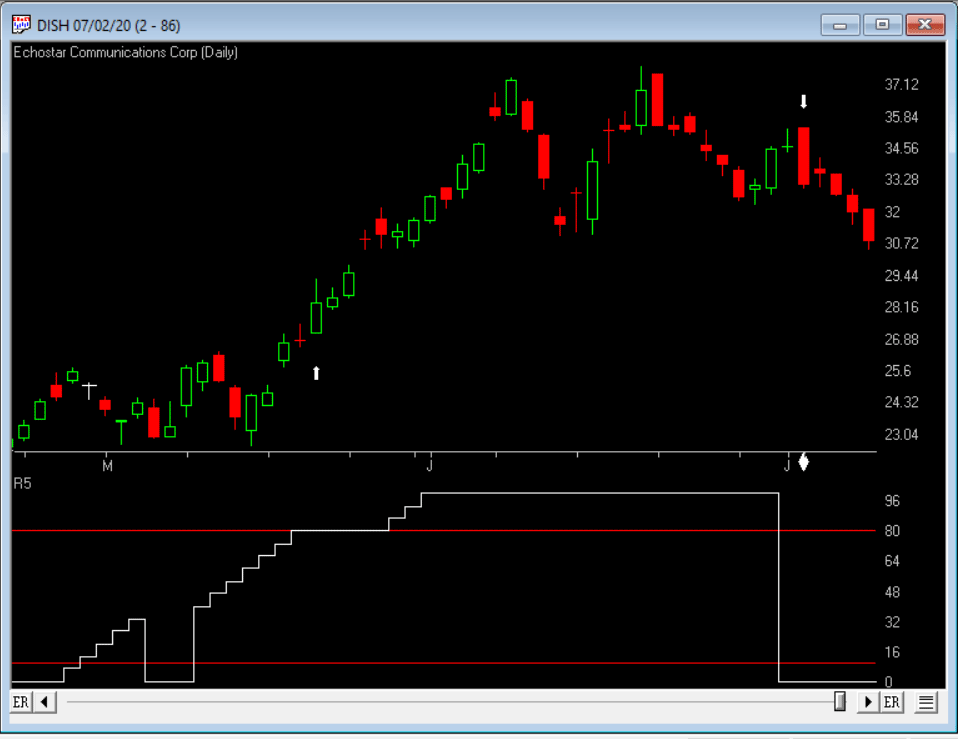
FIGURE 12: AIQ. Chart of DISH with R5 indicator and sample trade using R5 indicator >= 80 to buy.
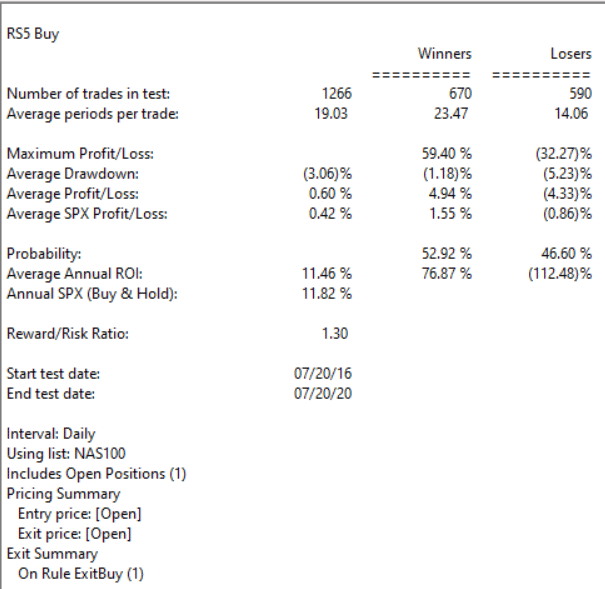
FIGURE 13: AIQ. Summary EDS backtest report for the R5 system that trades the Nasdaq 100 stocks over the last 4 years.
—Richard Denning
info@TradersEdgeSystems.com
for AIQ Systems
BACK TO LIST

TRADERSSTUDIO: SEPTEMBER 2020
The importable TradersStudio files based on James Garofallou’s article in this issue, “The RS4r: Tracking Relative Strength In Four Dimensions,” can be obtained on request via email to info@TradersEdgeSystems.com. The code is also available here:
'RS4r: Tracking Relative Strength In Four Dimensions
'Author: James Garofallou, PhD, TASC Sept 2020
'Coded by: Richard Denning, 7/18/2020

Function RS2t(Periods,IndexC As BarArray)
Dim RS1 As BarArray
Dim Fast,Med,Slow,VSlow,Tier1,Tier2,Tier3,Tier4
If IndexC > 0 Then
  RS1 = C/IndexC
  Else
  RS1=RS1[1]
End If
Fast = XAverage(RS1,Periods)
Med = Average(Fast,7)
Slow = Average(Fast,15)
VSlow = Average(Slow,30)
If Fast>=Med and Med>=Slow and Slow>=Vslow then
   Tier1=10
   else
   Tier1=0
end if
If Fast>=Med and Med>=Slow and Slow<Vslow then
   Tier2=9
   else
   Tier2=0
end if
If Fast<Med and Med>=Slow and Slow>=Vslow then
   Tier3=9
   else
   Tier3=0
end if
If Fast<Med and Med>=Slow and Slow<Vslow then
   Tier4=5
   else
   Tier4=0
end if
RS2t=Tier1+Tier2+Tier3+Tier4
End Function
'------------------------------------------------------
'SYSTEM FILE:
Sub RS4rSys(Len1,Len2,BuyLvl)
'Len1=10,Len2=15, BuyLvl=10

Dim NumIndx
NumIndx = 8 'set NumIndx = number of independent indexes
Dim SPYc As BarArray   'SPY
Dim QQQc As BarArray   'QQQQ
Dim MDYc As BarArray   'MDY
Dim SMLc As BarArray   'IWM
Dim XLREc As BarArray  'VNQ
Dim GLDc As BarArray   'GLD
Dim XLUc As BarArray   'XLU
Dim SPSBc As BarArray  'AGG

'can use ETF or actual index
SPYc = C Of independent1   'SP500 (SPY or SPX)
QQQc = C Of independent2   'NDX100 (QQQQ or NDX)
MDYc = C Of independent3   'SP MIDCAP 400 (MDY or MID)
SMLc = C Of independent4   'SP SMALLCAP 600 (SLY or IWM or SML or RUT)
XLREc = C Of independent5  'SP REAL ESTATE (XLRE or VNQ)
GLDc = C Of independent6   'SP GOLD (GLD or XAU)
XLUc = C Of independent7   'SP UTILITIES (XLU or PHU)
SPSBc = C Of independent8  'SP BONDS (SPSB or AGG)

Dim RS2spy
Dim RS2qqq
Dim RS2mdy
Dim RS2sml
Dim RS2xlre
Dim RS2gld
Dim RS2xlu
Dim RS2spsb

RS2spy = RS2t(Len1,SPYc)
RS2qqq = RS2t(Len1,QQQc)
RS2mdy = RS2t(Len1,MDYc)
RS2sml = RS2t(Len1,SMLc)
RS2xlre = RS2t(Len1,XLREc)
RS2gld = RS2t(Len1,GLDc)
RS2xlu = RS2t(Len1,XLUc)
RS2spsb = RS2t(Len1,SPSBc)

Dim RS3x As BarArray
Dim RS4 As BarArray
Dim RS4osc As BarArray
Dim mvSig As BarArray
Dim RS4r As BarArray

RS3x = (RS2spy+RS2qqq+RS2mdy+RS2sml+RS2xlre+RS2gld+RS2xlu+RS2spsb)
RS4 = (RS3x/NumIndx)*10
RS4osc = Average(RS4,3)
mvSig = Average(RS4osc,5)
RS4r = Round(RS4,0)

Dim mvRS4 As BarArray
Dim RS4up As BarArray
mvRS4 = weightedMA(RS4r,4,0)
RS4up = IIF(RS4r >= 80 Or RS4r > mvRS4,1,0)

Dim X As BarArray

If RS4 >= 80 Then 'RS4r must be >= 80
   X = 1
   Else
   X = 0
End If

Dim R5 As BarArray
If RS4up = 1 Then
   R5 = Round(average(X,Len2)*100,0) 'Avg of > 80 scores in period
   Else
   R5 = 0
End If

If R5 >= BuyLvl Then Buy("LE",1,0,Market,Day)
If R5 < BuyLvl Then ExitLong("LX","",1,0,Market,Day)

'Print FormatDateTime(Date)," RS4 ",RS4," R5 ",R5," RS2sml ",RS2sml

End Sub
Code for the RS4r is included in the system file and code for RS2t is in the function file. I did not code an indicator plot for the RS4r. I also coded a system that uses the RS4r. I used eight independent ETFs as indexes rather than the 11 mutual funds that the author used. I used SPY, QQQQ, MDY, IWM, GLD, XLU, VNQ, and AGG. The trading system buys (long only) when the RS4r >= 10 and exits the long position when RS4r < 10. The equity curve for trading this system on the Nasdaq 100 stocks (commission & slippage not subtracted), 100 shares per trade, is shown in Figure 14 and the quarterly drawdown is shown in Figure 15.
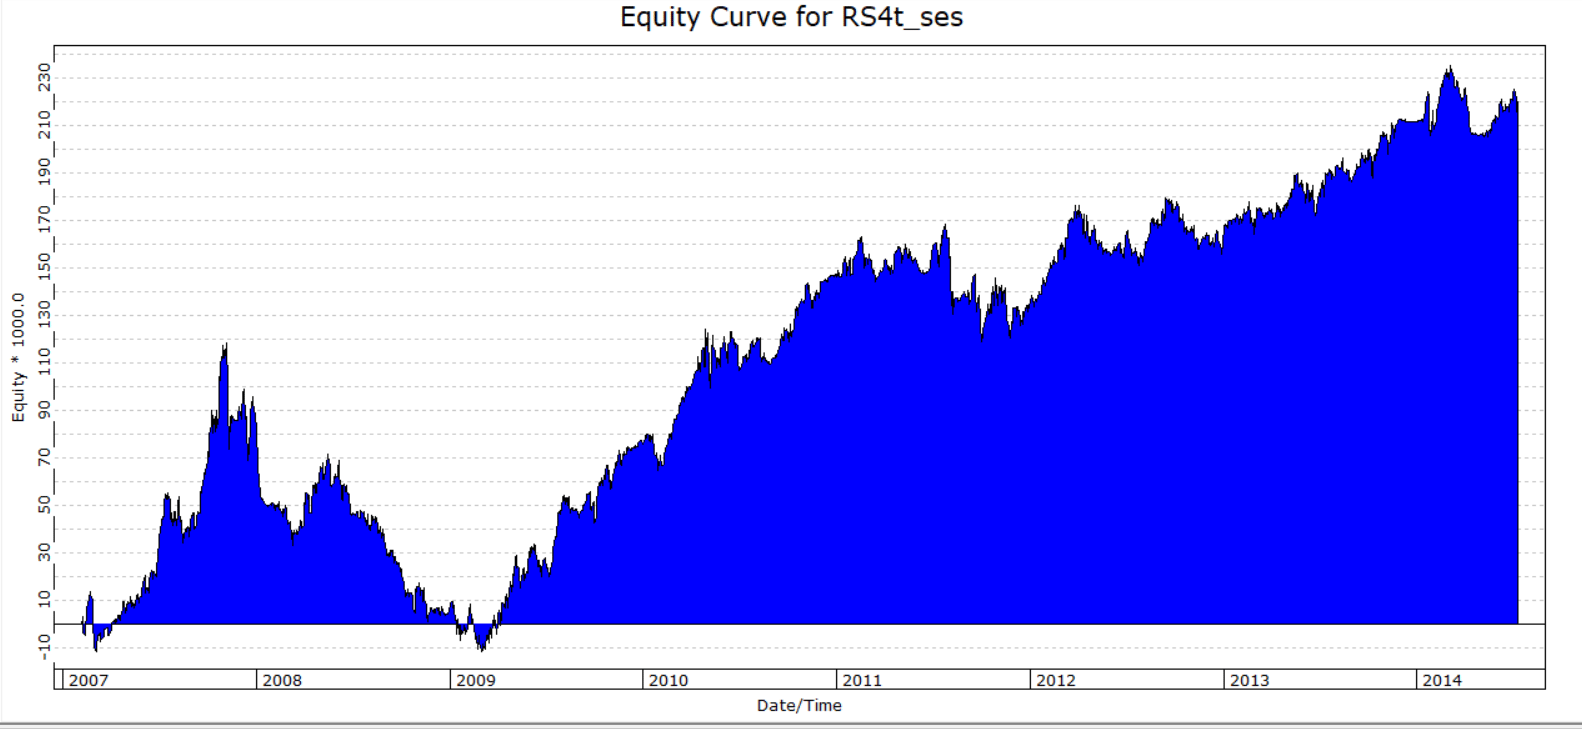
FIGURE 14: TRADERSSTUDIO. Equity curve for a trading system that uses the RS4r and trades the Nasdaq 100 stocks.
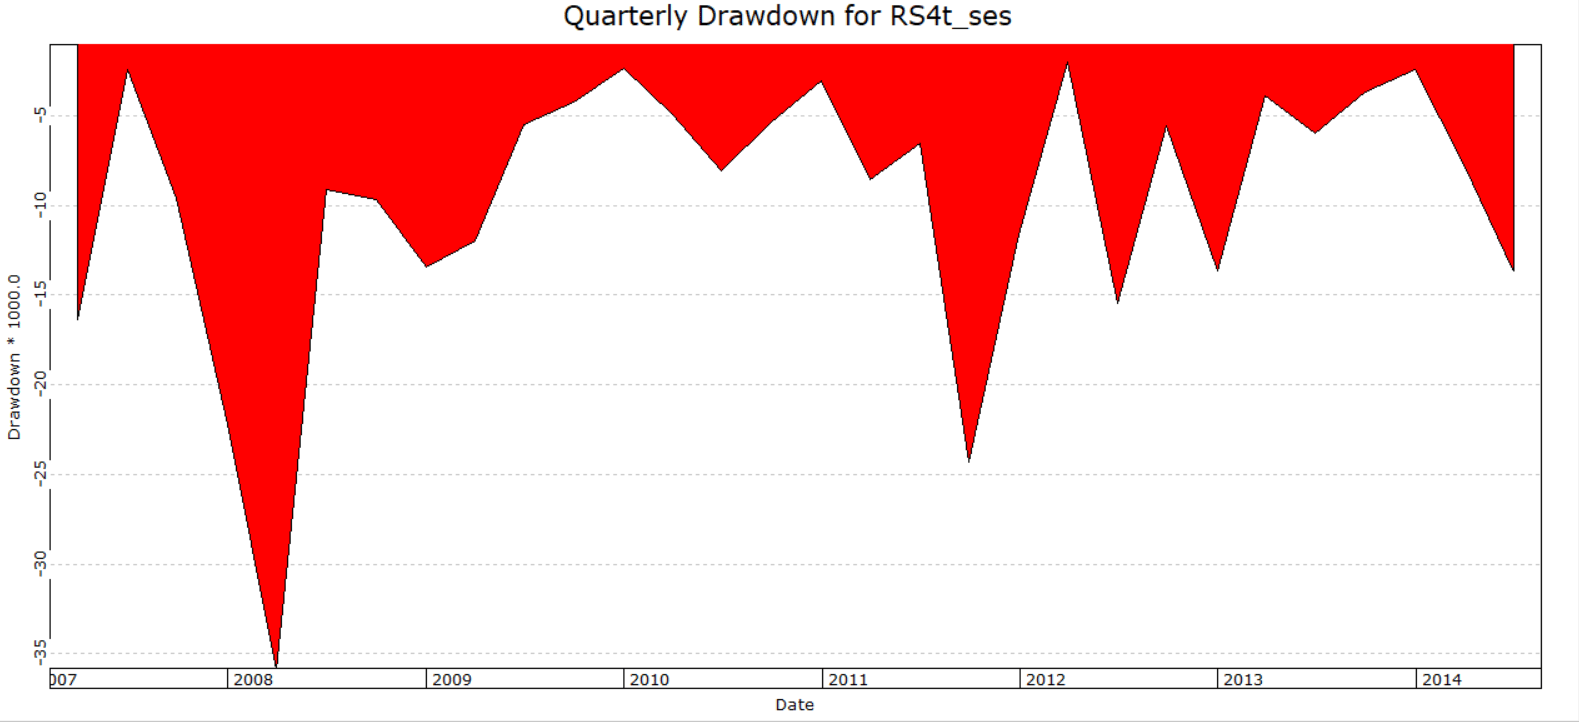
FIGURE 15: TRADERSSTUDIO. Quarterly drawdown for a RS4r system that trades the Nasdaq 100 stocks.
—Richard Denning
info@TradersEdgeSystems.com
for TradersStudio
BACK TO LIST
MICROSOFT EXCEL: SEPTEMBER 2020
In his article in this issue, James Garofallou demonstrates his RS4r indicator, a computational protocol for “tracking relative strength in four dimensions.” The values of RS4r and its companion RS5 may be used to rank symbols of interest as to the likelihood of performing well versus the other symbols under consideration.
This spreadsheet implementation of RS4r is essentially two distinct user-initiated batch processes.
Calculations begin by specifying up to 11 symbols to use as “benchmarks” (Figure 16), then initiating a batch process to collect date and close price history for this list of index or security symbols.
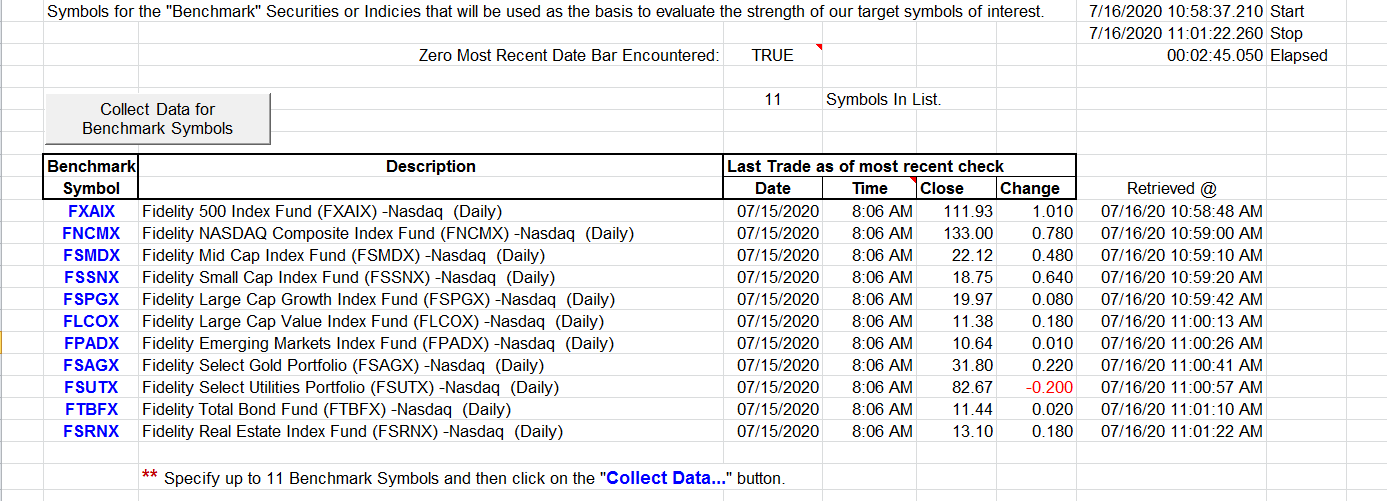
FIGURE 16: EXCEL. “RS4rBenchmarkSymbolList” tab, after benchmark symbol specification and data collection.
Choosing a set of symbols that represent disparate market sectors will lend credence to the finished RS4r and RS5 values. This example uses the same 11 symbols as shown in Figure 2 of the article.
The status bar at the bottom of the window will report benchmark progress in the form of “symbol (#n of yy).”
Note that the “zero most recent data bar encountered” indicator is “TRUE” in this example.
For securities and ETFs, current pricing (with a slight delay) is reported throughout the trading day. For most mutual funds, the NAV (net asset value) pricing is not calculated until after the markets close.
The data source used by this spreadsheet will report a mutual fund bar with zeros in the price fields for a current market open day (see top price row in Figure 17). If such a bar is detected during data retrieval, this spreadsheet will report pricing, RS4r, and RS5 values as of the previous bar (7/15/2020).
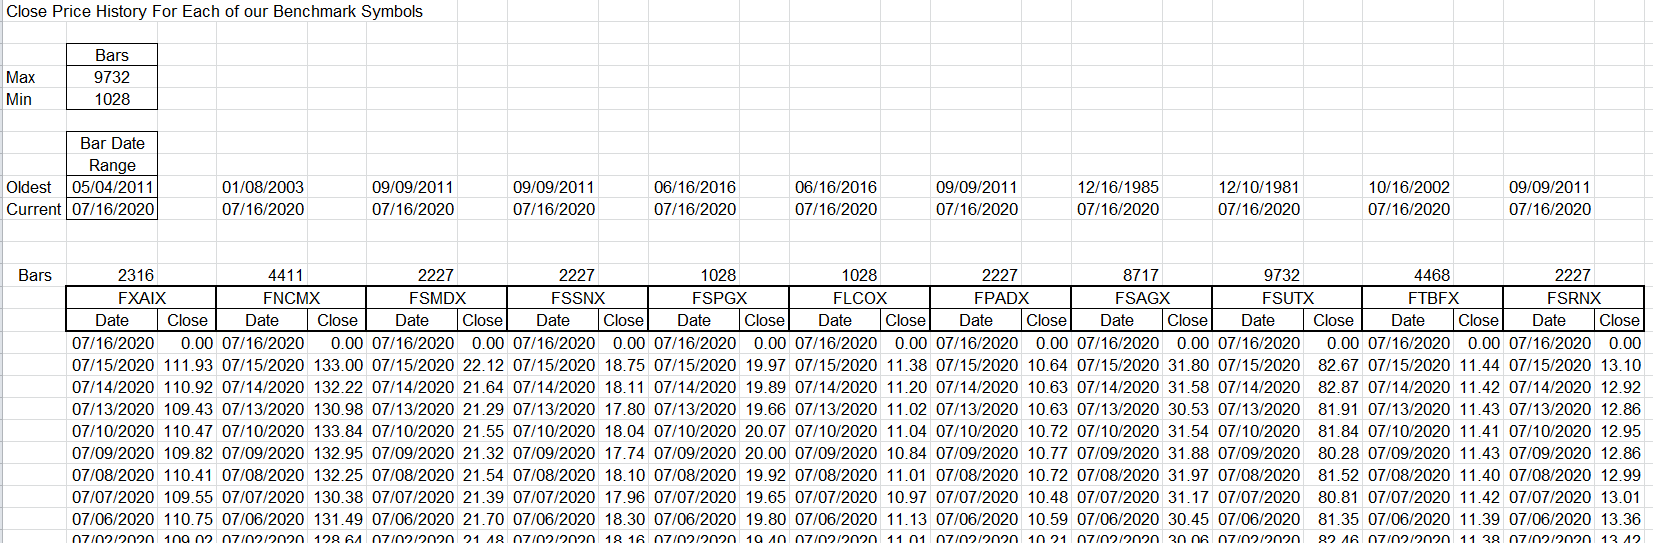
FIGURE 17: EXCEL. “RS4rBenchmarkValues” tab: The date and close price history are collected for the benchmark symbols.
The next step is to go to the “RS4rSymbolsToEvaluate” tab (Figure 18) where we can specify a list of target symbols we would like to evaluate against our benchmarks to determine RS4r and RS5 values.
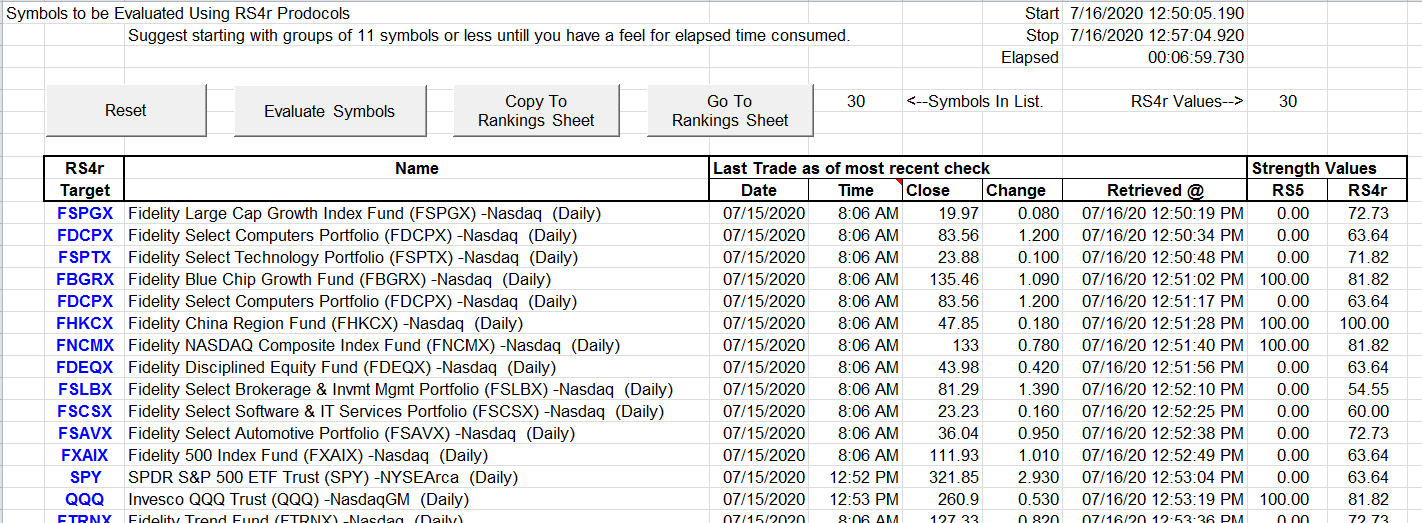
FIGURE 18: EXCEL. “RS4rSymbolsToEvaluate” tab: The RS4r computational work is driven from here.
You may specify as many symbols as you wish to evaluate in the RS4r target column. Here, I used the 28 symbols from the article along with SPY and QQQ (because I was curious as to how SPY and FXAIX rankings would compare).
- “Reset” clears everything except the target symbol column. This makes it easy to run the same set tomorrow or against a different set of benchmarks.
- “Evaluate” invokes a batch process that steps through the target list one symbol at a time by retrieving date and close price history for the target symbol. Placing this close price history on the RS4rComputations tab (Figure 19) initiates the computational magic.
- The resulting RS4r and RS5 values are copied back here to the RS4rSymbolsToEvaluate tab before stepping to the next target symbol.
- The status bar at the bottom of the window will report evaluation progress in the form of “symbol (#n of yy).”
- On completion of the batch process, “Copy to rankings sheet” copies the Figure 19 results below any rankings that may already exist on the RS4rRankings tab (Figure 20).
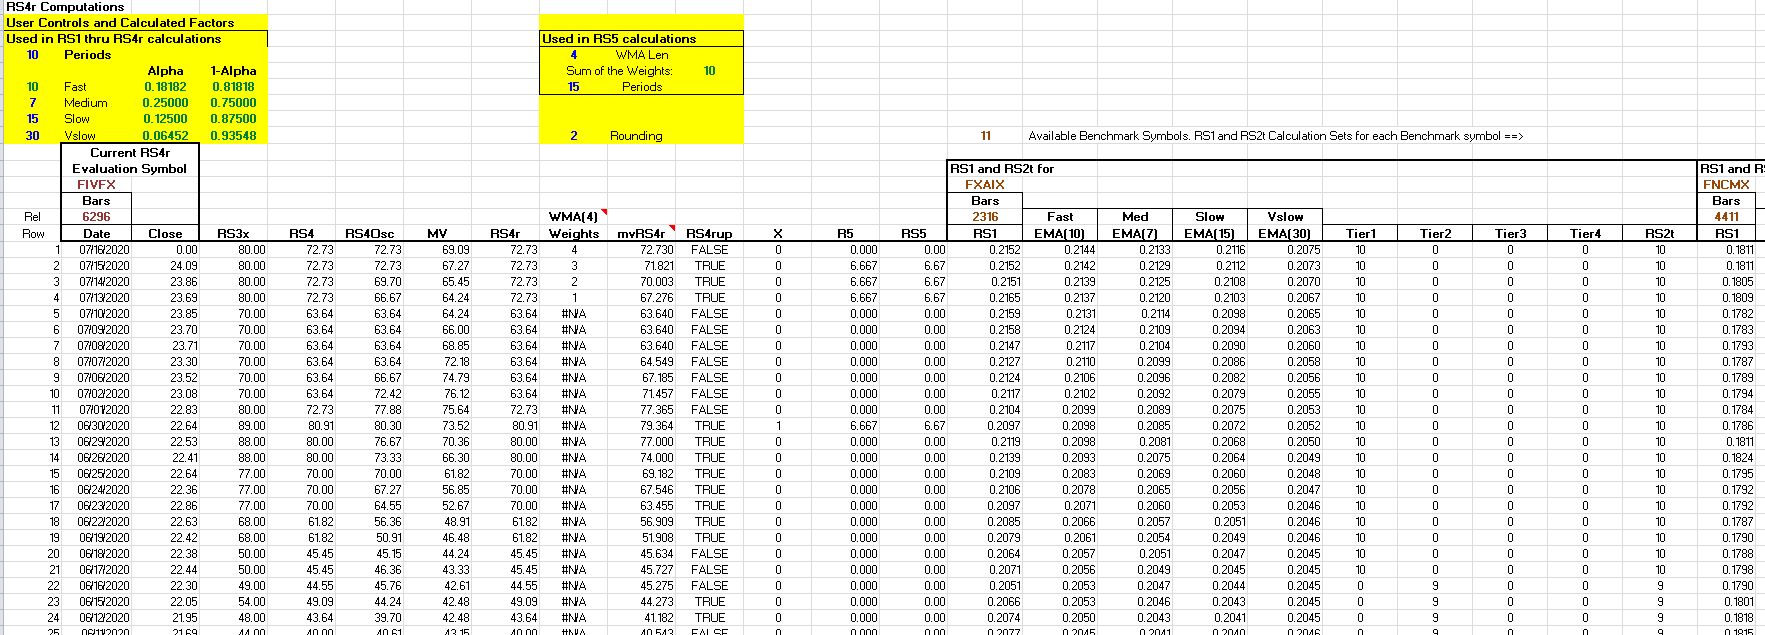
FIGURE 19: EXCEL. “RS4rComputations” tab: Target symbol at the left. 11 sets of RS1 and RS2t Computations, one for each the Benchmark symbols, stretch out to the right. The mid-section consolidates the 11 RS2t values into RS3x and thence to the requisite RS4r, and RS5 strength ratings.
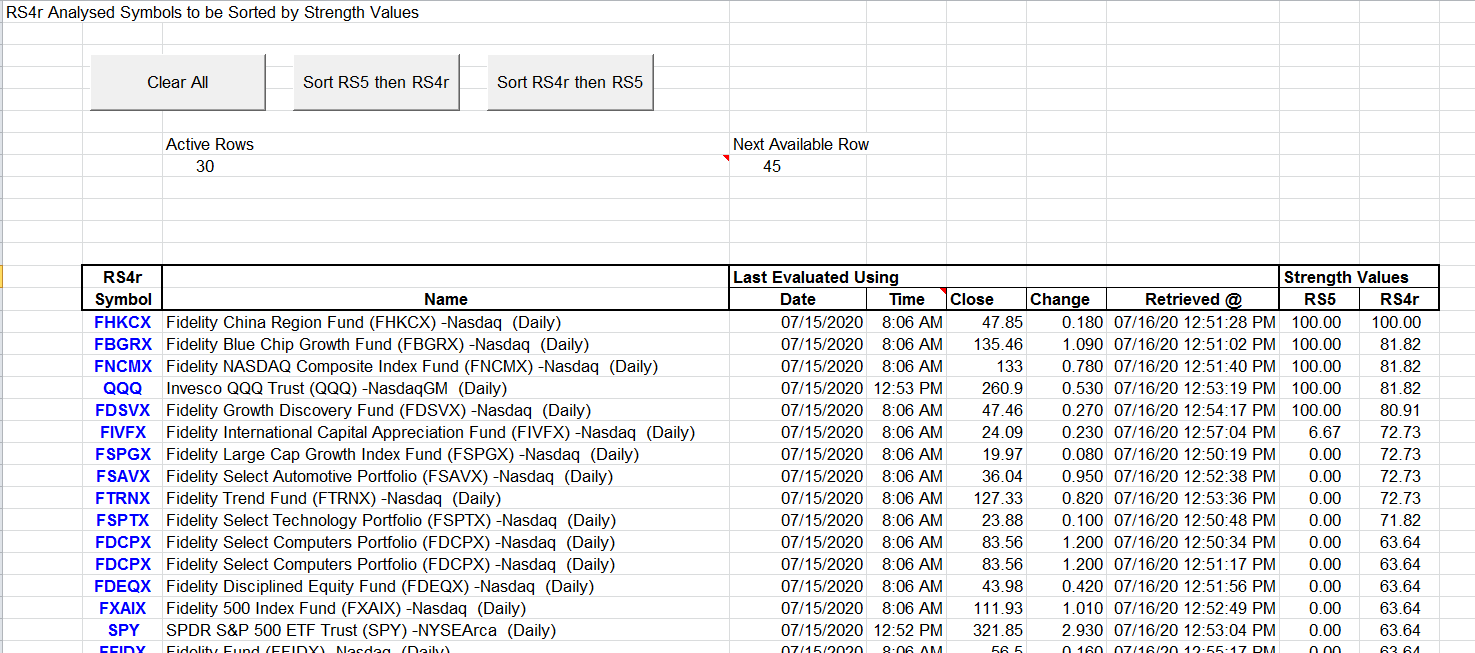
FIGURE 20: EXCEL. “RS4rRankings” tab, after the RS5 then RS4r sort.
You can also process target symbols in smaller batches and then add the smaller result sets to the rankings sheet.
At the end of an “evaluate” batch session, the RS4rComputations tab (Figure 19) will retain the calculations for the last target symbol “evaluated.”
In the sidebar code provided by Garofallou in his article, the RS4r and RS5 values are rounded to integers.
Just out of curiosity, I rounded out to two decimals to see if that might provide a finer gradation of the rankings (Figure 20). In the example used here, there wasn’t much difference. In earlier testing, there were days where it did produce a finer separation.
Changing the rounding setting to zero at the top of the RS4rComputations tab before clicking the evaluate symbols button on the RS4rSymbolsToEvaluate tab will produce results per Garofallou’s design.
Also of note in the Figure 20 example, for evaluations of this particular set of target symbols on this particular day, sorting RS5 and then RS4r produces the same result as sorting RS4r and then RS5.
Also, as described by the author in his article, RS5 gives the edge to FIVFX over the other symbols in the 72.73 RS4r bracket.
Data retrievals for the benchmark and target symbols are the big consumer in this process. The evaluation computations per symbol are nearly instantaneous.
Usage note: Data for the benchmark and for the target symbols must be retrieved as of the same date to ensure that you are evaluating target apples with benchmark apples.
Performance tip: Regardless of the number of target symbol evaluation batches, it is not necessary to retrieve the benchmarks more than once each day unless you are changing the mix of benchmark symbols.
To download this spreadsheet: The spreadsheet file for this Traders’ Tip can be downloaded here. To successfully download it, please follow these steps:
- Right-click on the Excel file link, then
- Select “save as” (or “save target as”) to place a copy of the spreadsheet file on your hard drive.
—Ron McAllister
Excel and VBA programmer
rpmac_xltt@sprynet.com
BACK TO LIST
Originally published in the September 2020 issue of
Technical Analysis of STOCKS & COMMODITIES magazine.
All rights reserved. © Copyright 2020, Technical Analysis, Inc.