TRADERS’ TIPS
October 2020

For this month’s Traders’ Tips, the focus is Barbara Star’s article in this issue, “Swing Trade With The Gann Hi-Lo Activator.” Here, we present the October 2020 Traders’ Tips code with possible implementations in various software.
You can right-click on any chart to open it in a new tab or window and view it at it’s originally supplied size, often much larger than the version printed in the magazine.
The Traders’ Tips section is provided to help the reader implement a selected technique from an article in this issue or another recent issue. The entries here are contributed by software developers or programmers for software that is capable of customization.

TRADESTATION: OCTOBER 2020
In her article “Swing Trade With The Gann Hi-Lo Activator” in this issue, author Barbara Star introduces us to a swing trading method using several classic indicators. Centered around the Gann hi-lo activator originally developed by Robert Kraus, Star adds a custom DMI for helping to measure trend and an SMI to show momentum. Here, we are providing the TradeStation EasyLanguage code for the indicators based on the author’s work.
Indicator: Gann Hi-Lo Activator
// Gann Hi Lo Activator
// TASC Oct 2020
// Barbara Star PhD

inputs:
	LengthHigh( 3 ),
	LengthLow( 3 ),
	UpColor( Green ),
	DownColor( Red ) ;

variables:
	HighMAValue( 0 ),
	LowMAValue( 0 ),
	State( 0 ),
	PlotValue( 0 ) ;

HighMAValue = Average( High, LengthHigh ) ;
LowMAValue = Average( Low, LengthLow ) ;

if Close > HighMAValue[1] then
	State = 1
else if Close < LowMAValue[1] then
	State = -1
else
	State = State[1] ;

if State = -1 then
begin
	PlotValue = HighMAValue ;
	SetPlotColor( 1, DownColor ) ;
end
else if State = 1 then
begin
	PlotValue = LowMAValue ;
	SetPlotColor( 1, UpColor ) ;
end ;


Plot1( PlotValue, "Hi-Lo Activator" ) ;


Indicator: SMI
// SMI
// TASC Oct 2020
// Barbara Star PhD

inputs:
	DLength( 3 ),
	KLength( 8 ),
	UpColor( Green ),
	DownColor( Red ),
	OverBought( 40 ),
	OverSold( -40 ) ;

variables:
	MinLow( 0 ),
	MaxHigh( 0 ),
	RelDiff( 0 ),
	Diff( 0 ),
	AvgRel( 0 ),
	AvgDiff( 0 ),
	SMIVal( 0 ),
	AvgSMIVal( 0 ) ;

MinLow = Lowest( Low, KLength ) ;
MaxHigh = Highest( High, KLength ) ;
RelDiff = Close - ( MaxHigh + MinLow ) / 2 ;
Diff = MaxHigh - MinLow ;
AvgRel = XAverage( XAverage( RelDiff, DLength ),
	DLength ) ;
AvgDiff = XAverage( XAverage( Diff, DLength ),
	DLength ) ;

if AvgDiff <> 0 then
	SMIVal = AvgRel / ( AvgDiff / 2 ) * 100
else
	SMIVal = 0 ;

AvgSMIVal = XAverage( SMIVal, DLength ) ;

if SMIVal > 0 then
	SetPlotColor[0]( 1, UpColor )
else if SMIVal < 0 then
	SetPlotColor[0]( 1, DownColor ) ;


Plot1( SMIVal, "SMI" ) ;
Plot2( 0, "ZL" ) ;
Plot3( OverBought, "OB" ) ;
Plot4( OverSold, "OS" ) ;


Indicator: DMI
// DMI
// TASC Oct 2020
// Barbara Star PhD

inputs:
	Length( 10 ),
	UpColor( Green ),
	DownColor( red ),
	ADXTrend( 25 ) ;

variables:
	ReturnValue( 0 ),
	oDMIPlus( 0 ),
	oDMIMinus( 0 ),
	oDMI( 0 ),
	oADX( 0 ),
	oADXR( 0 ),
	oVolty( 0 ),
	DMIOscVal( 0 ),
	PlotColor( 0 ) ;

ReturnValue = DirMovement( H, L, C, Length, oDMIPlus, oDMIMinus, oDMI, oADX, oADXR,
 oVolty );
DMIOscVal = oDMIPlus - oDMIMinus ;

if DMIOscVal > 0 then
	PlotColor = Upcolor
else if DMIOscVal < 0 then
	PlotColor = Downcolor ;


Plot1( DMIOscVal, "DMI Osc Hist", PlotColor );
Plot2( DMIOscVal, "DMI Osc", PlotColor );
Plot3( 0, "ZL" ) ;
To download the EasyLanguage code and a demonstration workspace for TradeStation 10, please visit our TradeStation and EasyLanguage support forum. The files for this article can be found here: https://community.tradestation.com/Discussions/Topic.aspx?Topic_ID=168100. The filename is “TASC_OCT2020.ZIP.”
For more information about EasyLanguage in general, please see https://www.tradestation.com/EL-FAQ.
A sample chart is shown in Figure 1.

FIGURE 1: TRADESTATION. A TradeStation chart of Altria (MO) is shown with the author’s Gann hi-lo activator, SMI, and DMI swing trading setup.
This article is for informational purposes. No type of trading or investment recommendation, advice, or strategy is being made, given, or in any manner provided by TradeStation Securities or its affiliates.
—Doug McCrary
TradeStation Securities, Inc.
www.TradeStation.com
BACK TO LIST

METASTOCK: OCTOBER 2020
Barbara Star’s article in this issue, “Swing Trade With The Gann Hi-Lo Activator,” discusses trading using three different indicators. Included below is the code for the Gann hi-lo activator and custom formulas for the SMI and the DMI oscillator. The last two are written so you can plot them as histograms and set different colors for the halves above and below the zero lines. Please note, the histogram line style and the colors must be set after plotting the indicator in your chart.
Gann Hi-Lo Activator:
Formula:
x:= 3; {time periods}
hma:= Ref(Mov(H, x, S), -1);
lma:= Ref(Mov(L, x, S), -1);
dir:= If( C > hma, 1, If( C < lma, -1, PREV));
If(dir = 1, hma, lma)

DMI Oscillator:
Formula:
x:= Input("Periods", 2, 50, 10);
main:= PDI(x)-MDI(x);
main;
If(main > 0, main, 0);
If(main < 0, main, 0)

SMI Histogram:
Formula:
tp:= Input("Time Periods", 5, 50, 8);
smp:= Input("Smoothing Periods", 1, 20, 3);
dsp:= Input("Double Smoothing Periods", 1, 20, 3);
main:= StochMomentum( tp, smp, dsp);
If(main > 0, main, 0);
If(main < 0, main, 0)
—William Golson
MetaStock Technical Support
www.MetaStock.com
BACK TO LIST

WEALTH-LAB.COM: OCTOBER 2020
“Swing trading” implies short-term trades lasting for days—like the “zero line bounce” continuation pattern. In the absence of an exit strategy in “Swing Trade With The Gann Hi-Lo Activator” in this issue, we didn’t find our backtest results exceptional. So for this Traders’ Tip we decided to fall back on a different strategy. Its rules are pretty simple: buy when the activator, DMI, and SMI are all in alignment and sell when it’s no longer true (Figure 2).

FIGURE 2: WEALTH-LAB. When all the indicators align in bullish mode, the chart background is painted greenish, or reddish during bear trends.
Strategy rules:
- Buy tomorrow at open when today’s close is above the HiLo and both the DMI and SMI are greater than 0
- Sell tomorrow at open when today’s close is below the HiLo and both the DMI and SMI are lower than 0
To execute the included trading system, install (or update) the latest version of the TASCIndicators and Comunity.Indicators libraries from the Extensions section of our website if you haven’t already done so, and restart Wealth-Lab. Then either copy/paste the included strategy’s C# code or simply let Wealth-Lab do the job. From the open strategy dialog, click download to get this strategy as well as many others contributed by the Wealth-Lab community.
using System;
using System.Collections.Generic;
using System.Text;
using System.Drawing;
using WealthLab;
using WealthLab.Indicators;
using TASCIndicators;
using Community.Indicators;

namespace WealthLab.Strategies
{
	public class SC202010 : WealthScript
	{
		protected override void Execute()
		{
			var hilo = GannHiLoActivator.Series(Bars, 3, false);
			var dmi = DIPlus.Series(Bars, 10) - DIMinus.Series(Bars, 10);
			var smi = SMI.Series(Bars, 8, 3, 3);

			PlotSeries( PricePane, hilo, Color.DarkGreen, LineStyle.Solid, 2);
			PlotSeries( CreatePane( 30,false,true), dmi, Color.DarkGreen, LineStyle.Histogram, 3);
			ChartPane sPane = CreatePane( 30,false,true);
			PlotSeries( sPane, smi, Color.Fuchsia, LineStyle.Solid, 2);
			DrawHorzLine( sPane, 40, Color.Green, LineStyle.Dashed, 1);
			DrawHorzLine( sPane, -40, Color.Red, LineStyle.Dashed, 1);
			HideVolume();

			for(int bar = GetTradingLoopStartBar( 20 ); bar < Bars.Count; bar++)
			{
				var _long = (Close[bar] > hilo[bar] && dmi[bar] > 0 && smi[bar] > 0);
				var _short = (Close[bar] < hilo[bar] && dmi[bar] < 0 && smi[bar] < 0);

				if (Close[bar] > hilo[bar])
					SetSeriesBarColor( bar, hilo, Color.DarkGreen);
				else
					SetSeriesBarColor( bar, hilo, Color.Red);

				if (dmi[bar] > 0)
					SetSeriesBarColor( bar, dmi, Color.DarkGreen);
				else
					SetSeriesBarColor( bar, dmi, Color.Red);

				if (smi[bar] > 0)
					SetSeriesBarColor( bar, smi, Color.DarkGreen);
				else
					SetSeriesBarColor( bar, smi, Color.Red);

				if (_long)
					SetBackgroundColor( bar, Color.FromArgb(30, Color.DarkGreen));
				if(_short)
					SetBackgroundColor( bar, Color.FromArgb(30, Color.DarkRed));

				if (IsLastPositionActive)
				{
					if ( _short )
						SellAtMarket( bar + 1, LastPosition);
                    	}
				else
				{
					if ( _long )
						BuyAtMarket( bar + 1);
				}
			}
		}
	}
}
—Gene Geren (Eugene)
Wealth-Lab team
www.wealth-lab.com
BACK TO LIST

NINJATRADER: OCTOBER 2020
The SMI and Gann hi-lo activator indicators described in “Swing Trade With The Gann Hi-Lo Activator” by Barbara Star in this issue are available for download at the following links for NinjaTrader 8 and NinjaTrader 7:
Once the file is downloaded, you can import the indicator into NinjaTader 8 from within the control center by selecting Tools → Import → NinjaScript Add-On and then selecting the downloaded file for NinjaTrader 8. To import in NinjaTrader 7 from within the Control Center window, select the menu File → Utilities → Import NinjaScript and select the downloaded file.
You can review the indicator’s source code in NinjaTrader 8 by selecting the menu New → NinjaScript Editor → Indicators from within the control center window and selecting the SMI and GannHighLowActivator files. You can review the indicator’s source code in NinjaTrader 7 by selecting the menu Tools → Edit NinjaScript → Indicator from within the control center window and selecting the SMI and GannHighLowActivator files.
A sample chart displaying the indicators is shown in Figure 3.
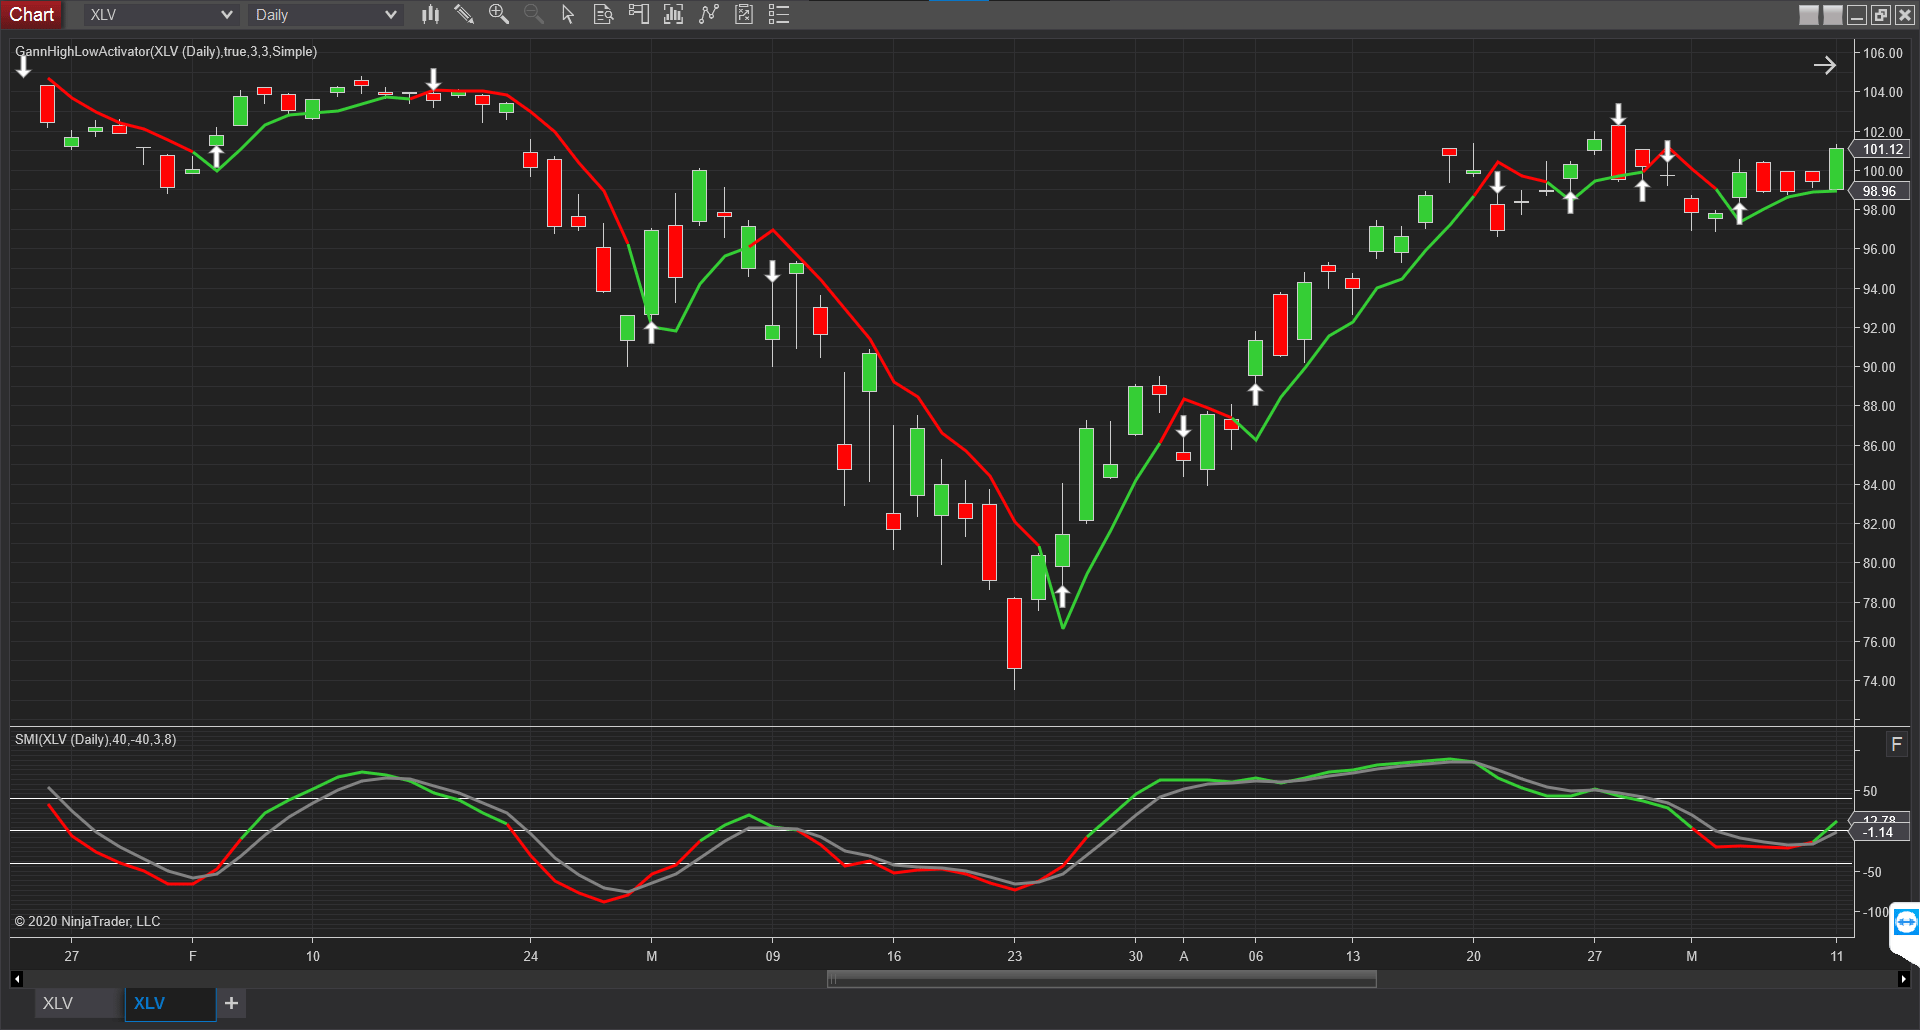
FIGURE 3: NINJATRADER. The SMI and GannHighLowActivator indicator are displayed on a daily XLV chart from January 2020 to May 2020.
NinjaScript uses compiled DLLs that run native, not interpreted, to provide you with the highest performance possible.
—Chris Lauber
NinjaTrader, LLC
www.ninjatrader.com
BACK TO LIST

NEUROSHELL TRADER: OCTOBER 2020
The indicators described in “Swing Trade With The Gann Hi-Lo Activator” by Barbara Star in this issue can be easily implemented in NeuroShell Trader by combining two of NeuroShell Trader’s 800+ indicators. To implement the indicators, select new indicator from the insert menu and use the indicator wizard to create the following indicators:
Gann Hi-Lo Activator
IfThenElseIfThen(A>B(Close,Avg(High,3)),1,A<B(Close,Avg(Low,3)),-1,0)

DMI Oscillator
Divide( Sub( ExpAvg( +DM( High, Low, Close), 10), ExpAvg(-DM( High, Low, Close), 10)),
ExpAvg( TrueRange( High, Low, Close), 10))

SMI
Avgrel	ExpAvg(ExpAvg(Sub(Close,PriceMidpoint(High,Low,8)),3),3),
Avgdif	ExpAvg(ExpAvg(PriceRange(High,Low,8),3),3))
SMI	IfThenElse(A not equal B( Avgdif, 0), Mul2( Divide( Avgrel, Avgdif), 200), 0 )
A sample chart is shown in Figure 4.

FIGURE 4: NEUROSHELL TRADER. This NeuroShell Trader chart shows the Gann hi-lo activator, DMI oscillator, and SMI.
Users of NeuroShell Trader can go to the Stocks & Commodities section of the NeuroShell Trader free technical support website to download a copy of this or any previous Traders’ Tips.
—Marge Sherald, Ward Systems Group, Inc.
301 662-7950, sales@wardsystems.com
www.neuroshell.com
BACK TO LIST

OPTUMA: OCTOBER 2020
Here are the custom formulas to implement the indicators described by Barbara Star in her article in this issue, “Swing Trade With The Gann Hi-Lo Activator,” for the Optuma platform.
Gann Hi-Lo Activator:

//High 3MA;
H3 = MA(BARS=3, CALC=High);
//Low 3MA;
L3 = MA(BARS=3, CALC=Low);

HiLoActivator = IF(CLOSE() > H3[1], H3, IF(CLOSE() < L3[1], L3, HiLoActivator[1]));
HiLoActivator
The line colour is defined separately with the following custom colour formula:
H3 = MA(BARS=3, CALC=High);
L3 = MA(BARS=3, CALC=Low);
SWITCH(CLOSE() > H3, CLOSE() < L3)

DMI Oscillator:

//DM Plus;
DMP = ADX(DEFAULT=DMPlus, BARS=10);
//DM Minus;
DMM = ADX(DEFAULT=DMMinus, BARS=10);
DMI = DMP - DMM;
DMI
The SMI is a standard tool in the software (https://help.optuma.com/kb/faq.php?id=511).
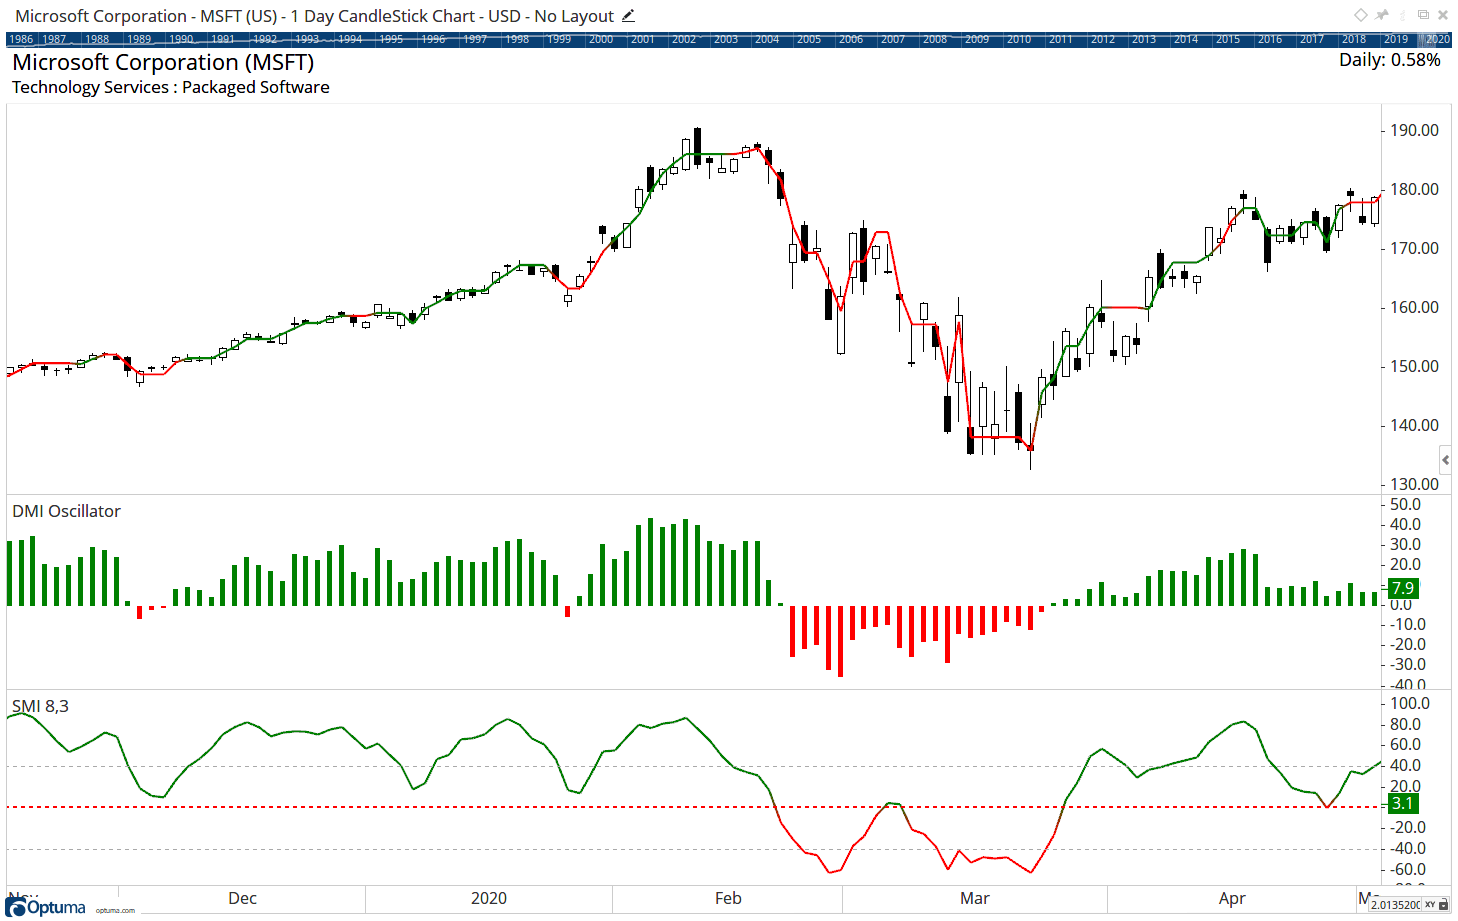
FIGURE 5: OPTUMA. This sample chart displays the Gann hi-lo activator, the DMI oscillator (middle panel), and the SMI (bottom panel). For the Gann hi-lo activator, the line color is defined separately with a custom color formula.
—support@optuma.com
BACK TO LIST

THE ZORRO PROJECT: OCTOBER 2020
In “Swing Trade With The Gann Hi-Lo Activator” in this issue, author Barbara Star combines three indicators. Despite its name, the Gann hi-lo activator indicator was not created by the famous esotericist, W.D. Gann, but rather by Robert Krausz for a 1998 article in this magazine. Let’s see how useful it is for swing trading in combination with two other indicators. Here’s the C code:
var ColorGHLA;
var GHLA(int HPeriod,int LPeriod)
{
  vars H = series(priceHigh());
  vars L = series(priceLow());
  vars MaH = series(SMA(H,HPeriod),2);
  vars MaL = series(SMA(L,LPeriod),2);
  vars State = series();
  If(priceClose() > MaH[1]) State[0] = 1;
  else if(priceClose() < MaL[1]) State[0] = -1;
  else State[0] = State[1];
  ColorGHLA = State[0];
  return ifelse(State[0] < 0,MaH[0],MaL[0]);
}

var DMI(int Period)
{
  return PlusDI(Period) - MinusDI(Period);
}

var SMI(int DLength,int KLength)
{
  var Hi = HH(KLength), Lo = LL(KLength);
  var Diff = Hi-Lo;
  var RelDiff = priceClose()-(Hi+Lo)/2;
  var AvgRel = EMA(EMA(RelDiff,DLength),DLength);
  var AvgDiff = EMA(EMA(Diff,DLength),DLength);
  return ifelse(AvgDiff!=0,AvgRel/AvgDiff*200,0);
}
The GHLA indicator returns not only a value, but also a color, which we will need later for testing a trading method that was also described in the article. But first, here’s the code for replicating the indicators on an NVDA chart:
function run()
{
  BarPeriod = 1440;
  StartDate = 20200201;
  EndDate = 20200410;
  assetAdd("NVDA","STOOQ:NVDA.US");
  asset("NVDA");
  var Ghla = GHLA(3,3);
  var Smi = SMI(3,8);
  var Dmi = DMI(10);
  plot("GHLA",Ghla,LINE,BLUE);
  plot("DMI",Dmi,NEW|BARS,BLUE);
  plot("SMI",Smi,NEW|LINE,BLUE);
  plot("Zero",0,0,BLACK);
}
This script produces the chart shown in Figure 6.
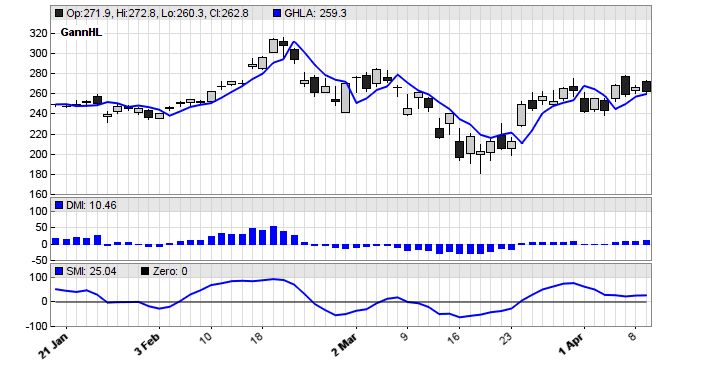
FIGURE 6: ZORRO PROJECT. The provided script produces this chart. The Gann hi-low activator (GHLA) indicator returns not only a value, but also a color.
For trading this indicator soup, the author recommends opening a position when all three indicators are in sync, meaning they have the same color. That’s why we needed the color of the GHLA. The color of the two other indicators is just their sign. So we will open a long position when all the colors are green, and reverse to a short position when they are all red. Here is the additional code:
MaxLong = MaxShort = 1;
if(ColorGHLA > 0 && Dmi > 0 && Smi > 0)
  enterLong();
if(ColorGHLA < 0 && Dmi < 0 && Smi < 0)
  enterShort();
Sure enough, this system performs well in the NVDA example chart. Three out of four trades are winners.
But what happens when we trade it for a longer period, for example, five years? Set the StartDate variable to a 2015 date and repeat the test. The sad result can be seen in the chart in Figure 7. The system collected big losses in 2017 and 2018. Is it possible that successful trading needs other methods, or maybe better indicators? Of course, this quick test does not mean much. Maybe a profitable outcome can be achieved with additional conditions, such as entering positions only on a peak, or with optimizing the indicator periods.
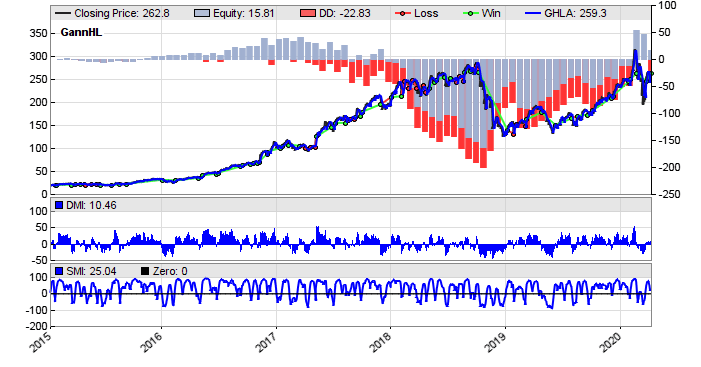
FIGURE 7: ZORRO PROJECT. Testing it for a longer period, such as five years, produced this chart.
The SMI, DMI, and Gann hi-lo indicators, as well as the code for the chart and trading system, can be downloaded from the 2020 script repository on https://financial-hacker.com. The Zorro platform can be downloaded from https://zorro-project.com.
—Petra Volkova
The Zorro Project by oP group Germany
https://zorro-project.com
BACK TO LIST

TRADE NAVIGATOR: OCTOBER 2020
We have prepared a library that users can download in Trade Navigator to make it easy to implement the indicators described in the article by Barbara Star in this issue, “Swing Trade With The Gann Hi-Lo Activator.”
The file name is SC202010. To install this new library into Trade Navigator, click on the blue telephone button, select download special file, then erase the word “upgrade” and type in “SC202010” (without the quotes), and click on the start button. When prompted to upgrade, click the yes button. If prompted to close all software, click on the continue button. Your library will now download. This library contains two indicators named “TD SMI” and “Gann HiLo Activator,” as well as a template named “SC Swing Trade w Gann HiLo Activator.” The DMI oscillator is already available in Trade Navigator.
The template can be inserted onto your chart by opening the charting dropdown menu, selecting the templates command, then selecting the “SC Swing Trade w Gann HiLo Activator” template. To add the indicators to a chart, open the charting dropdown menu, select the add to chart command, then on the indicators tab, find, select, and add your named indicator. Repeat this procedure for additional indicators if you wish.
If you need assistance with creating or using the indicators and/or template, our friendly technical support staff will be happy to help via phone or via live chat through our website.
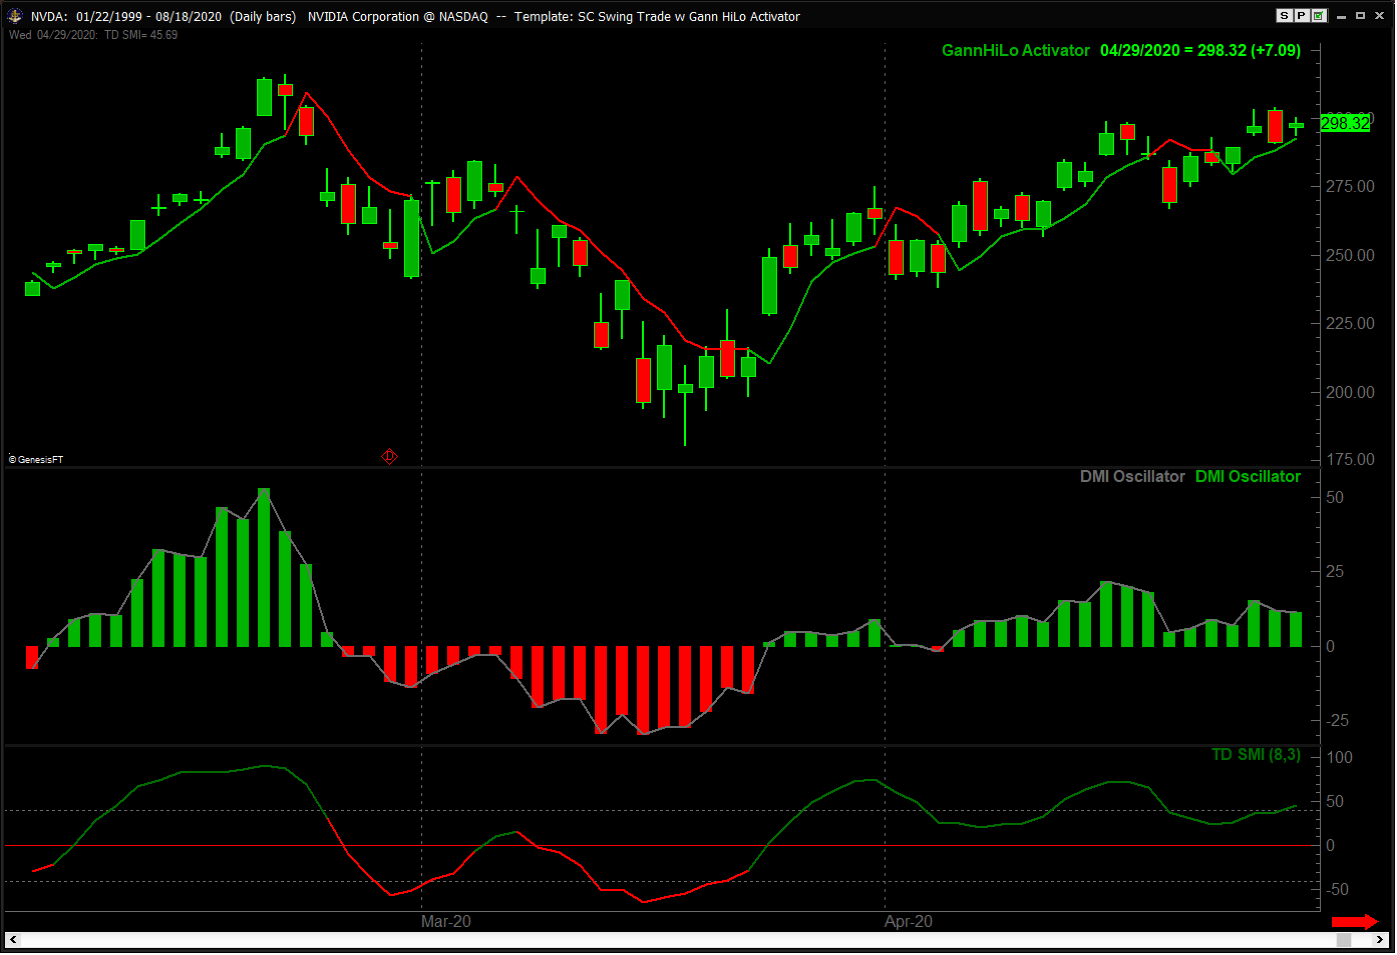
FIGURE 8: TRADE NAVIGATOR. Here, the SC Swing Trade w Gann Hi-Lo Activator template is shown applied to a chart.
—Genesis Financial Data
Tech support 719 884-0245
www.TradeNavigator.com
BACK TO LIST

TRADERSSTUDIO: OCTOBER 2020
The importable TradersStudio files based on Barbara Star’s article in this issue, “Swing Trade With The Gann Hi-Lo Activator,” can be obtained on request via email to info@TradersEdgeSystems.com. The code is also available below.
'Swing Trade With The Gann Hi-Lo Activator
'Author: Barbra Star, TASC Oct 2020
'Coded by: Richard Denning, 8/15/2020

Function GANN_HL(HLlen)
Dim maH As BarArray
Dim maL As BarArray
maH = Average(H,HLlen)
maL = Average(L,HLlen)
GANN_HL = IIF(C > maH, maH, maL)
End Function
'---------------------------------
Function Wilder_DMI(dmiLen)
Dim dmiP As BarArray
Dim dmiM As BarArray
dmiP = dmiplus(dmiLen,0)
dmiM = dmiminus(dmiLen,0)
Wilder_DMI = dmiP - dmiM
End Function
'---------------------------------
Function Star_SMI(pKLen,pDlen)
Dim MidPoint As BarArray
Dim diffMidPoint As BarArray
Dim diff As BarArray
Dim DS As BarArray
Dim DHL As BarArray
diff = (Highest(H,pKLen) - Lowest(L,pKLen))
MidPoint = (Highest(H,pKLen) + Lowest(L,pKLen))/2
diffMidPoint = C - MidPoint
DS = XAverage(XAverage(diffMidPoint,pDlen),pDlen)
DHL = XAverage(XAverage(diff,pDlen),pDlen)
If DHL <> 0 then
  Star_SMI = DS / ((DHL + 0.00001)/2) *100
End If
End Function
'--------------------------------------------------
'Indicator plots:
Sub GANN_HL_IND(HLlen)
Dim theGANN_HL As BarArray
theGANN_HL = GANN_HL(HLlen)
plot1(theGANN_HL)
End Sub
'---------------------------
Sub Wilder_DMI_IND(dmiLen)
Dim DMI As BarArray
DMI = Wilder_DMI(dmiLen)
plot1(0)
plot2(DMI)
End Sub
'---------------------------
Sub Star_SMI_IND(pKLen,pDlen)
Dim SMI As BarArray
SMI = Star_SMI(pKLen,pDlen)
plot1(0)
plot2(SMI)
End Sub
'-----------------------------
'Long only trading system:
Sub GANN_HL_sys(HLlen,DMIlen,pKLen,pDlen)
'HLlen=3,DMIlen=10,pKLen=8,pDlen=3
Dim theGANN_HL As BarArray
Dim theDMI As BarArray
Dim theSMI As BarArray
theGANN_HL = GANN_HL(HLlen)
theDMI = Wilder_DMI(DMIlen)
theSMI = Star_SMI(pKLen,pDlen)
If theGANN_HL > C And theDMI > 0 And theSMI > 0 Then
  Buy("LE",1,0,Market,Day)
End If
If theGANN_HL < C Then ExitLong("LX","",1,0,Market,Day)
End Sub
'------------------------------------------------------
The author uses three indicators for which I provide the function code and the indicator plot code. For the SMI indicator, since the author did not use the signal line, I do not provide code or an indicator plot for the signal line. I also coded a long only trading system that uses the three indicators as the author describes. Figure 9 shows the equity curve trading a portfolio of ETFs.

FIGURE 9: TRADERSSTUDIO. This shows an equity curve for a trading system that uses the author's set of indicators run on a portfolio of ETFs.
—Richard Denning
info@TradersEdgeSystems.com
for TradersStudio
BACK TO LIST

AIQ: OCTOBER 2020
The importable AIQ EDS file based on Barbara Star’s article in this issue, “Swing Trade With The Gann Hi-Lo Activator,” can be obtained on request via email to info@TradersEdgeSystems.com. The code is also available here:
!Swing Trade With The Gann Hi-Lo Activator
!Author: Barbra Star, TASC Oct 2020
!Coded by: Richard Denning, 8/15/2020

!GANN Hi Low Indicator:
!INPUTS:
HiLoLen is 3.
H is [high].
L is [low].
C is [close].

maH is simpleavg(H,HiLoLen).
maL is simpleavg(L,HiLoLen).
Long if C > maH.
HiLo is iff(Long,maH,maL).

!----------------------------------------------
!DMI indicators as defined by Wells Wilder
define WilderLength 10.
Dailyrange is [high]-[low].
Ycloseh is abs(val([close],1)-[low]).
Yclosel is abs(val([close],1)-[high]).
Trange1 is Max(Dailyrange,Ycloseh).
Trange is Max(Trange1,Yclosel).

!To convert Wilder Averaging (recursive)
!   to Exponential Averaging use this formula:
!ExponentialPeriods = 2 * WilderPeriod - 1.

days is 2 * WilderLength - 1.

!+DM CODE:
yhigh is val([high],1).
ylow is val([low],1).
rhigh is ([high]-yhigh).
rlow is (ylow-[low]).
DMplus is iff(rhigh > 0 and rhigh > rlow, rhigh, 0).
DMminus is iff(rlow > 0 and rlow >= rhigh, rlow, 0).

AvgPlusDM is expAvg(DMplus,days).
AvgMinusDM is expavg(DMminus,days).

!AVERAGE TRUE RANGE
ATR is expAvg(Trange,Days).
!DMI CODE:
PlusDMI is (AvgPlusDM/ATR)*100.	!PLOT AS INDICATOR (2lines)
MinusDMI is AvgMinusDM/ATR*100.	!PLOT AS INDICATOR (2 lines).
DMI is PlusDMI - MinusDMI.
!-----------------------------------------------------------

!STAR_SMI:
pKLen is 8.
pDlen is 3.
diff is (Highresult(H,pKLen) - Lowresult(L,pKLen)).
MidPoint is (Highresult(H,pKLen) + Lowresult(L,pKLen))/2.
diffMidPoint is C - MidPoint.
DS is expavg(expavg(diffMidPoint,pDlen),pDlen).
DHL is expavg(expavg(diff,pDlen),pDlen).
Star_SMI is DS / ((DHL)/2) * 100.
!----------------------------------------------------
!TRADING SYSTEM THAT USE THE ABOVE THREE INDICATORS:
Buy if HiLo > C and DMI > 0 and Star_SMI > 0.
Sell if HiLo < C.
!-----------------------------------------------------
Code for the three indicators in the article is included in the EDS file. I also coded a system that uses the three indicators. The summary EDS backtest report for trading this system on the NASDAQ 100 stocks (commission & slippage not subtracted) is shown in Figure 10.

FIGURE 10: AIQ. Summary EDS backtest report for the Gann Hi-Lo system that trades the NASDAQ 100 stocks over the from 1999 to 2014.
—Richard Denning
info@TradersEdgeSystems.com
for AIQ Systems
BACK TO LIST

ESIGNAL: OCTOBER 2020
For this month’s Traders’ Tip, we’ve provided the Hi-Lo Activator.efs study based on the article by Barbara Star, “Swing Trade With The Gann Hi-Lo Activator.” The study assists swing traders in identifying peaks and valleys.
The studies contain formula parameters that may be configured through the edit chart window (right-click on the chart and select “edit chart”). A sample chart is shown in Figure 11.

FIGURE 11: eSIGNAL. Here is an example of the study plotted on a daily chart of SPY.
To discuss this study or download a complete copy of the formula code, please visit the EFS Library Discussion Board forum under the forums link from the support menu at www.esignal.com or visit our EFS KnowledgeBase at https://www.esignal.com/support/kb/efs. The eSignal formula script (EFS) is also shown below.
/**********************************
Provided By:
Copyright 2019 Intercontinental Exchange, Inc. All Rights Reserved.
eSignal is a service mark and/or a registered service mark of Intercontinental Exchange, Inc.
in the United States and/or other countries. This sample eSignal Formula Script (EFS)
is for educational purposes only.
Intercontinental Exchange, Inc. reserves the right to modify and overwrite this EFS file with each new release.

Description:
   Swing Trade With The Gann Hi-Lo Activator
   by Barbara Star


Version:            1.00  08/25/2020


Notes:
The related article is copyrighted material. If you are not a subscriber
of Stocks & Commodities, please visit www.traders.com.

**********************************/
var fpArray = new Array();
var bInit = false;

function preMain() {
    setPriceStudy(true);
    setStudyTitle("Hi-Lo Activator");
    setCursorLabelName("HLAct",0);
    setDefaultBarFgColor(Color.grey);
    setDefaultBarThickness(2,0);

}

var bVersion = null;
var xInit = false;
var xMA1 = null;
var xMA2 = null;
var xClose = null;
var vSwing = 0;
var vSwing1 = -1;
var vHiLo = null;


function main() {
    if (bVersion == null) bVersion = verify();
    if (bVersion == false) return;

    if(xInit==false){
        xMA1 = sma(3,high());
        xMA2 = sma(3,low());
        xClose = close();
        xInit=true;
    }

    if(getBarState()==BARSTATE_NEWBAR){
        vSwing1 = vSwing;
    }

    if(xClose.getValue(0)>xMA1.getValue(-1)&&vSwing1==-1){
        vSwing=1;
    }else if(xClose.getValue(0)<xMA2.getValue(-1)&&vSwing1==1){
        vSwing=-1;
    }else{
        vSwing = vSwing1;
    }

    if(vSwing==-1){
        vHiLo = xMA1.getValue(0);
    }else if(vSwing==1){
        vHiLo = xMA2.getValue(0);
    }

    if (xClose.getValue(0) > vHiLo) setBarFgColor(Color.lime);
    if (xClose.getValue(0) < vHiLo) setBarFgColor(Color.red);

    return vHiLo;
}

function verify(){
    var b = false;
    if (getBuildNumber() < 779){

        drawTextAbsolute(5, 35, "This study requires version 10.6 or later.",
            Color.white, Color.blue, Text.RELATIVETOBOTTOM|Text.RELATIVETOLEFT|Text.BOLD|Text.LEFT,
            null, 13, "error");
        drawTextAbsolute(5, 20, "Click HERE to upgrade.@URL=https://www.esignal.com/download/default.asp",
            Color.white, Color.blue, Text.RELATIVETOBOTTOM|Text.RELATIVETOLEFT|Text.BOLD|Text.LEFT,
            null, 13, "upgrade");
        return b;
    }
    else
        b = true;

    return b;
}
—Eric Lippert
eSignal, an Interactive Data company
800 779-6555, www.eSignal.com
BACK TO LIST
MICROSOFT EXCEL: OCTOBER 2020
In her article in this issue, Barbara Star presents the Gann hi-lo activator indicator as a tool for the swing trader.
This indicator is visually similar to the zigzag, but uses a very different and decisive mechanism to make its change-of-trend call.
In the article, Star makes use of two additional indicators, the SMI and DMI, to assist with analyzing the potential swing trading decisions called out by the hi-lo activator. Her discussion of the hi-lo activator and how to interpret its interactions with the other two indicators packs a lot of insight into four pages.
The Excel computations for all three indicators are straightforward. Unfortunately, one of the charting options used in the article is not possible to replicate in Excel. That’s because I have never encountered the ability in Excel to change the color of a line at various points along its length as is done in the article for the hi-lo activator and the two additional indicators.
In place of directly coloring the indicator lines, I am plotting each of the indicator lines in a single color and then coloring the chart background as the lines would have been colored.
This actually works to our advantage. By keeping the horizontal axis of the charts aligned, background coloring greatly emphasizes those places where the three indicators are not exactly in sync.
I set up the controls for this spreadsheet to reflect all of the user inputs provided in the article and article sidebar. I found it interesting to play with these controls while using my symbols of interest as I studied Star’s article.
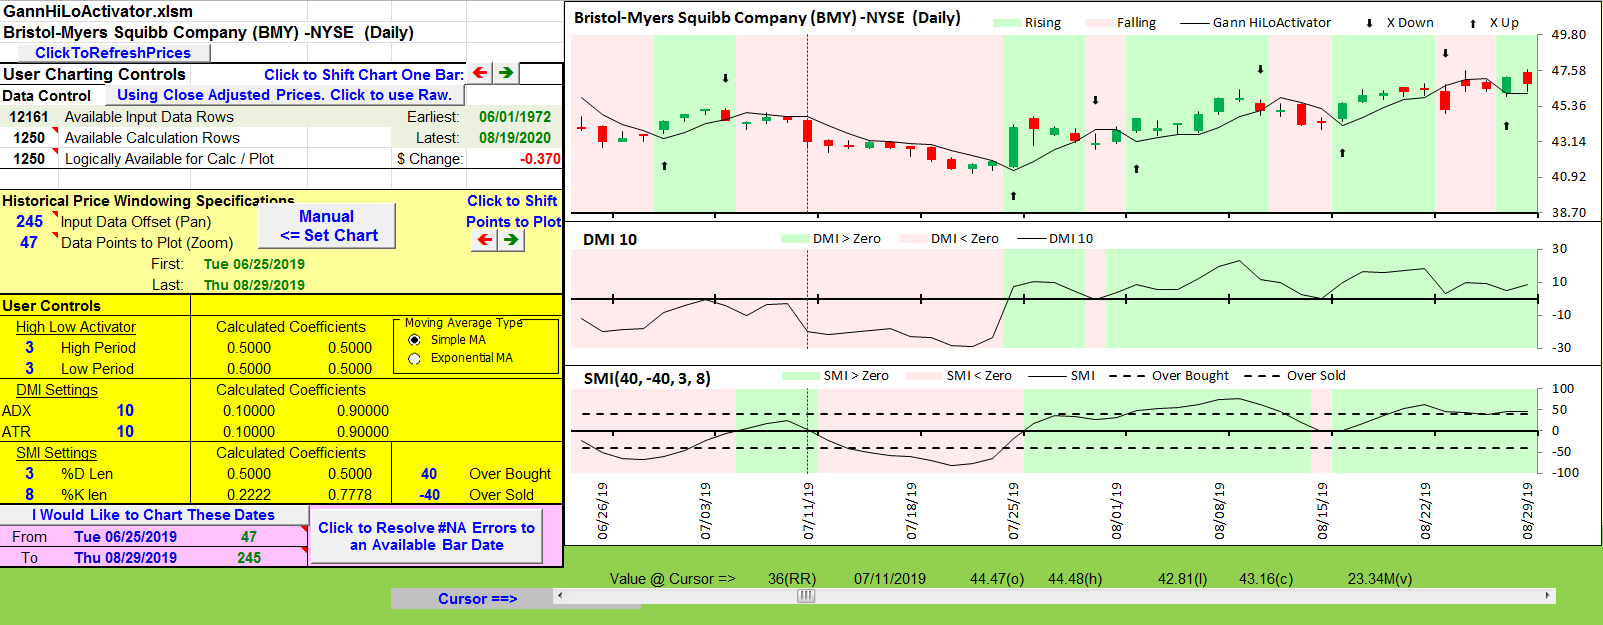
FIGURE 12: EXCEL. This chart of BMY replicates Figure 6 from Barbara Star’s article in this issue. It incorporates many of the situations that Star details over the course of the six charts she used in her article.
To download this spreadsheet: The spreadsheet file for this Traders’ Tip can be downloaded here. To successfully download it, follow these steps:
- Right-click on the Excel file link, then
- Select “save as” (or “save target as”) to place a copy of the spreadsheet file on your hard drive.
—Ron McAllister
Excel and VBA programmer
rpmac_xltt@sprynet.com
BACK TO LIST
Originally published in the October 2020 issue of
Technical Analysis of STOCKS & COMMODITIES magazine.
All rights reserved. © Copyright 2020, Technical Analysis, Inc.


