TRADERS’ TIPS
January 2021
For this month’s Traders’ Tips, the focus is Perry Kaufman’s article in this issue, “A Fresh Look At Short-Term Patterns.” Here, we present the January 2021 Traders’ Tips code with possible implementations in various software.
You can right-click on any chart to open it in a new tab or window and view it at it’s originally supplied size, often much larger than the version printed in the magazine.
The Traders’ Tips section is provided to help the reader implement a selected technique from an article in this issue or another recent issue. The entries here are contributed by software developers or programmers for software that is capable of customization.

TRADESTATION: JANUARY 2021
In his article in this issue, “A Fresh Look At Short-Term Patterns,” author Perry Kaufman introduces some test methods to analyze various short-term price patterns to determine how they work with various stocks and ETFs. The analysis includes results with and without a trend filter. The trend filter used is an 80-period simple moving average and the article also provided the criteria for the various patterns used to determine if an entry is triggered.
Shown here is the indicator code based on the author’s work. A simple Plot statement was added to indicate that the code was running, but the code is designed to export the results to a text file.
 Indicator: TASC JAN 2021
// TASC JAN 2021
// PJK Short-Term patterns
// Look at reliability of short-term patterns with
// and without a trend filter.
// Look at using noise as a qualifier
// Copyright 2020, P.J.Kaufman. All rights reserved

inputs:
    trendper( 0 ),
    usekeyreversal( false ),
    useislandreversal( false ),
    usecompression( 0 ),
    usegaps( 0 ),
    useoutsideday( false ),
    usewiderangingday( 0 ),
    forecast( 5 ),
    investment( 10000 );

variables:
    trend( 0 ),
    pattern( " " ),
    bullcases( 0 ),
    bearcases( 0 ),
    compression( false ),
    gap( false ),
    outsideday( false ),
    widerangingday( false ),
    bullpattern( false ),
    bearpattern( false ),
    bulltrend( false ),
    beartrend( false ),
    bulltrendcases( 0 ),
    beartrendcases( 0 ),
    cday( 0 ),
    comphigh( 0 ),
    complow( 0 ),
    outsidebull( false ),
    outsidebear( false ),
    ratio( 0 ),
    ndays( 0 ),
    adate( " " ),
    size( 0 ),
    back1( 0 ),
    back2( 0 ),
    back3( 0 ),
    back4( 0 );

arrays:
    bullreturns[6]( 0 ),
    bearreturns[6]( 0 ),
    bulltrendreturns[6]( 0 ),
    beartrendreturns[6]( 0 );

// trend
if trendper > 0 then
begin
    trend = average( close, trendper );
end;

//====================================================
//    3-day compression
//====================================================
if usecompression = 3 then
begin
    cday = truerange[3];

    compression = truerange < cday
     and truerange[1] < cday
     and truerange[2] < cday;
end;

//====================================================
//    key reversals
//====================================================
if usekeyreversal and ndays = 0 then
begin
    pattern = "Key Reversal";

    // key bearcases reversal
    if high > high[1]
        and low < low[1]
        and close < low[1] then
    begin
        ndays = 1;
        bearcases = bearcases + 1;
        bearpattern = true;
        size = investment / close;

        if trend < trend[1] then
        begin
            beartrend = true;
            beartrendcases = beartrendcases + 1;
        end;
    end
    // key bullcases reversal
    else if high > high[1]
        and low < low[1]
        and close > high[1] then
    begin
        ndays = 1;
        bullcases = bullcases + 1;
        bullpattern = true;
        size = investment / close;

        if trend > trend[1] then
        begin
            bulltrend = true;
            bulltrendcases = bulltrendcases + 1;
        end;
    end;
end;

//====================================================
//    island reversals
//====================================================
if useislandreversal and ndays = 0 then
begin
    pattern = "Island Reversal";

    // bearcases island reversal
    if low > high[1] and close < open then
    begin
        ndays = 1;
        bearcases = bearcases + 1;
        bearpattern = true;
        size = investment / close;

        if trend < trend[1] then
        begin
            beartrend = true;
            beartrendcases = beartrendcases + 1;
        end;
    end
    // bullcases island reversal
    else if high < low[1] and close > open then
    begin
        ndays = 1;
        bullcases = bullcases + 1;
        bullpattern = true;
        size = investment / close;

        if trend > trend[1] then
        begin
            bulltrend = true;
            bulltrendcases = bulltrendcases + 1;
        end;
    end;
end;

//====================================================
//    compression
//====================================================
if usecompression > 0 and ndays = 0 then
begin
    pattern = "3-Day compression";
    back4 = truerange[4];
    back3 = truerange[3];
    back2 = truerange[2];
    back1 = truerange[1];
    compression = back4 > back3 and back4 > back2
     and back4 > back1;

    if compression then
    begin
        comphigh = Highest( High[1], usecompression );
        complow = Lowest( Low[1], usecompression );

        // bearcases compression
        if close < complow then
        begin
            ndays = 1;
            bearcases = bearcases + 1;
            bearpattern = true;
            size = investment / close;

            if trend < trend[1] then
            begin
                beartrend = true;
                beartrendcases = beartrendcases + 1;
            end;
        end
        // bullcases compression
        else if close > comphigh then
        begin
            ndays = 1;
            bullcases = bullcases + 1;
            bullpattern = true;
            size = investment / close;

            if trend > trend[1] then
            begin
                bulltrend = true;
                bulltrendcases = bulltrendcases + 1;
            end;
        end;
    end;
end;

//====================================================
//  Outside day (or wide ranging day) with close in
//  upper/lower 25%
//====================================================
if (useoutsideday or usewiderangingday <> 0)
    and ndays = 0 then
begin
    if useoutsideday then
        pattern = "Outside Day"
    else
        pattern = "Wide Ranging Day";

    outsidebull = high > high[1] and low < low[1]
     and close > 0.75 * ( high - low ) + low;

    outsidebear = high > high[1] and low < low[1]
     and close < 0.25 *  (high - low ) + low;

    ratio = 0;

    if usewiderangingday <> 0 then
    begin
        ratio = truerange / avgtruerange( 20 );
    end;

    // bearcases outside day
    if outsidebear and
        ( ratio = 0
        or ratio > usewiderangingday ) then
    begin
        ndays = 1;
        bearcases = bearcases + 1;
        bearpattern = true;
        size = investment / close;

        if trend < trend[1] then
        begin
            beartrend = true;
            beartrendcases = beartrendcases + 1;
        end;
    end
    // bullcases outside day
    else if outsidebull
        and (ratio = 0
        or ratio > usewiderangingday) then
    begin
        ndays = 1;
        bullcases = bullcases + 1;
        bullpattern = true;
        size = investment / close;

        if trend > trend[1] then
        begin
            bulltrend = true;
            bulltrendcases = bulltrendcases + 1;
        end;
    end;
end;

//====================================================
// Gap opening with profits in direction of the gap
//====================================================
if usegaps > 0 and ndays = 0 then
begin
    pattern = "Gap Opening";
    ratio = ( open - close[1] )/avgtruerange( 20 )[1];

    // downward gap
    if ratio < 0 and -ratio >= usegaps then
    begin
        ndays = 1;
        bearcases = bearcases + 1;
        bearpattern = true;
        size = investment / close;

        if trend < trend[1] then
        begin
            beartrend = true;
            beartrendcases = beartrendcases + 1;
        end;
    end
    else if ratio >= usegaps then
    begin
        // bullcases gap
        ndays = 1;
        bullcases = bullcases + 1;
        bullpattern = true;
        size = investment / close;

        if trend > trend[1] then
        begin
            bulltrend = true;
            bulltrendcases = bulltrendcases + 1;
        end;
    end;
end;

//====================================================
// accumulated profits over next 5 days
//====================================================
if ndays > 1 then
begin
    if bullpattern then
    begin
        bullreturns[ndays] = bullreturns[ndays] +
         size * ( close - close[ndays-1] );
    end;

    if bearpattern then
    begin
        bearreturns[ndays] = bearreturns[ndays] +
         size * ( close[ndays-1] - close );
    end;

    if bulltrend then
    begin
        bulltrendreturns[ndays] =
         bulltrendreturns[ndays] +
         size * ( close - close[ndays-1] );
    end;

    if beartrend then
    begin
        beartrendreturns[ndays] =
         beartrendreturns[ndays] +
         size * ( close[ndays-1] - close );
    end;
end;

if ndays > 0 then
begin
    ndays = ndays + 1;
end;

//====================================================
// summary
//====================================================
if lastbaronchartex then
begin
    adate = ELdatetostring( Date );

    // print headers to file
    print(
     file( "c:\tradestation\Short-Term Patterns.csv"),
     "Date,Pattern,Cases,Bull Cases,BullPL1,BullPL2,"
     + "BullPL3,BullPL4,BullPL5,Bear Cases,",
     "BearPL1,BearPL2,BearPL3,BearPL4,BearPL5,,"
     + "TrendCases,",
     "Bull Trend Cases,BullTrPL1,BullTrPL2,BullTrPL3"
     + ",BullTrPL4,BullTrPL5,",
     "Bear Trend Cases,BearTrPL1,BearTrPL2,BearTrPL3,"
     + "BearTrPL4,BearTrPL5" );

    // print the data to file
    print(
     file( "c:\tradestation\Short-Term Patterns.csv"),
     adate, ",",
     pattern, ",",
     bullcases+bearcases:8:0, ",",
     bullcases:8:0, ",",
     Bullreturns[2]:8:0, ",",
     Bullreturns[3]:8:0, ",",
     Bullreturns[4]:8:0, ",",
     Bullreturns[5]:8:0, ",",
     Bullreturns[6]:8:0, ",",
     bearcases:5:0, ",",
     Bearreturns[2]:8:0, ",",
     Bearreturns[3]:8:0, ",",
     Bearreturns[4]:8:0, ",",
     Bearreturns[5]:8:0, ",",
     Bearreturns[6]:8:0, ",,",
     bulltrendcases+beartrendcases:5:0, ",",
     bulltrendcases:5:0, ",",
     Bulltrendreturns[2]:8:0, ",",
     Bulltrendreturns[3]:8:0, ",",
     Bulltrendreturns[4]:8:0, ",",
     Bulltrendreturns[5]:8:0, ",",
     Bulltrendreturns[6]:8:0, ",",
     beartrendcases:5:0, ",",
     Beartrendreturns[2]:8:0, ",",
     Beartrendreturns[3]:8:0, ",",
     Beartrendreturns[4]:8:0, ",",
     Beartrendreturns[5]:8:0, ",",
     Beartrendreturns[6]:8:0 );
end;

//====================================================
// end of trade
//====================================================
if ndays > 6 then
begin
    bullpattern = false;
    bearpattern = false;
    bulltrend = false;
    beartrend = false;
    ndays = 0;
end;

Plot1( Close ); // dummy plot to show code is running
To download the EasyLanguage code for TradeStation 10, please visit our TradeStation and EasyLanguage support forum. The files for this article can be found here: https://community.tradestation.com/discussions/Topic.aspx?Topic_ID=190289.
A sample chart is shown in Figure 1.

FIGURE 1: TRADESTATION. Shown here is a TradeStation daily chart of SPY with the indicator applied. The plot is used to indicate that the code is running and does not plot a significant number in terms of the article content. The code is designed to export information to a file.
This article is for informational purposes only. No type of trading or investment recommendation, advice, or strategy is being made, given, or in any manner provided by TradeStation Securities or its affiliates.
—Chris Imhof
TradeStation Securities, Inc.
www.TradeStation.com
BACK TO LIST

THINKORSWIM: JANUARY 2021
We have put together a study based on the article in this issue “A Fresh Look At Short-Term Patterns (With And Without A Trend Filter)” by Perry Kaufman.
We built the study referenced by using our proprietary scripting language, thinkscript. To ease the loading process, simply click on https://tos.mx/pnEzI0G or enter it into the address into setup → open shared item from within thinkorswim, then choose view thinkScript study and name it “ReturnsCalculationForPricePatterns” or whatever you like so you can identify it. You can then add the study to your charts from the edit studies menu from within the charts tab.

FIGURE 2: THINKORSWIM. Here is an example of the study. The returns calculation from 1 to 5 days for bullish key reversals is shown in the upper pane with bearish key reversal returns in the lower pane. Log scale is enabled for the price pane to view the price moves more distinctly.
The example chart shown in Figure 2 is the returns calculation from 1 to 5 days for bullish key reversals (upper pane) and bearish key reversals (lower pane). Also, log scale is enabled for the price pane to see the price moves more distinctly. The price pattern to be used, its direction, whether or not to apply the trend filter, and investment size are all configurable via inputs. Please see Perry Kaufman’s article for more information on how to read the study.
—thinkorswim
A division of TD Ameritrade, Inc.
www.thinkorswim.com
BACK TO LIST

WEALTH-LAB.COM: JANUARY 2021
The Wealth-Lab strategy code for the short-term pattern scanner described by Perry Kaufman in his article in this issue, “A Fresh Look At Short-Term Patterns,” is presented here.
With parameter sliders at the bottom left of your Wealth-Lab workspace, the included strategy demonstrates how to switch between the patterns interactively when viewing a chart. Dragging the pattern slider to the left or to the right will change between the six choices and make the chart update with backtested trades.
For example, Figure 3 illustrates one bearish and two bullish key reversal trades created on the next open following the pattern and exiting 3 days after. Through another parameter slider, you can control exits after N bars in a trade.

FIGURE 3: WEALTH-LAB. Sample entries are shown on a daily chart of QLD. Data provided by Yahoo! Finance.
To avoid copy/paste, hitting Ctrl-O and choosing download in Wealth-Lab gets you the downloadable strategy under the “Chart patterns” folder.
using System;
using System.Collections.Generic;
using System.Text;
using System.Drawing;
using WealthLab;
using WealthLab.Indicators;
/* Requires Community Components installed */
using Community.Components;

namespace WealthLab.Strategies
{
	public class TASCJan2021 : WealthScript
	{
		private StrategyParameter paramPattern;
		private StrategyParameter paramExitDays;

		public TASCJan2021()
		{
			paramPattern = CreateParameter("Pattern", 1, 1, 6, 1);
			paramExitDays = CreateParameter("Exit after", 3, 1, 10, 1);
		}

		protected override void Execute()
		{
			var _pattern = paramPattern.ValueInt;
			var _exitAfter = paramExitDays.ValueInt;
			int atrPeriod = 20, maPeriod = 80;
			double tick = Bars.SymbolInfo.Tick;
			var atr = ATR.Series(Bars, atrPeriod);
			var trendFilter = SMA.Series(Close, maPeriod);

			for(int bar = GetTradingLoopStartBar( Math.Max(atrPeriod,maPeriod)); bar < Bars.Count; bar++)
			{
				/* key reversal */
				bool keyRevBear = High[bar] > High[bar - 1] && Low[bar] < Low[bar - 1] && Close[bar] < Low[bar - 1];
				bool keyRevBull = High[bar] > High[bar - 1] && Low[bar] < Low[bar - 1] && Close[bar] > High[bar - 1];

				/* island reversal */
				bool islRevBear = Low[bar] > High[bar - 1] && Close[bar] < Open[bar];
				bool islRevBull = High[bar] < Low[bar - 1] && Close[bar] > Open[bar];

				/* outside day */
				bool outsideBull = this.isOutsideBar(bar) && Close[bar] > Low[bar] + ( 0.75 * (High[bar] - Low[bar]));
				bool outsideBear = this.isOutsideBar(bar) && Close[bar] < Low[bar] + ( 0.25 * (High[bar] - Low[bar]));

				/* wide range day */
				var ratio = TrueRange.Series(Bars)[bar] / atr[bar];
				bool isWRBBull = outsideBull && (ratio > 1.5);
				bool isWRBBear = outsideBear && (ratio > 1.5);

				/* 3-day compression */
				bool compression = CumDown.Series(TrueRange.Series(Bars), 1)[bar] >= 3;

				/* gap open */
				bool isGapUp = (this.isGap(bar) == CommonSignalsEx.GapType.FullUp) && (Open[bar] > Close[bar] + 0.5 * atr[bar]);
				bool isGapDown = (this.isGap(bar) == CommonSignalsEx.GapType.FullDown) && (Open[bar] < Close[bar] + 0.5 * atr[bar]);

				/* trend filter */
				bool isBullish = Close[bar] > trendFilter[bar];
				bool isBearish = Close[bar] < trendFilter[bar];

				if (IsLastPositionActive)
				{
					/* Exit after N days */
					Position p = LastPosition;
					if (bar + 1 - p.EntryBar >= _exitAfter)
						ExitAtMarket( bar + 1, p, string.Format("After {0}", _exitAfter));
				}
				else
				{
					switch (_pattern)
					{
						case 1:
							if( keyRevBear && isBearish) ShortAtMarket( bar + 1, "KeyRevBear");
							if( keyRevBull && isBullish) BuyAtMarket( bar + 1, "KeyRevBull");
							break;
						case 2:
							if (islRevBear && isBearish) ShortAtMarket( bar + 1, "IslRevBear");
							if (islRevBull && isBullish) BuyAtMarket( bar + 1, "IslRevBull");
							break;
						case 3:
							if (outsideBear && isBearish) ShortAtMarket( bar + 1, "OutsideBear");
							if (outsideBull && isBullish) BuyAtMarket( bar + 1, "OutsideBull");
							break;
						case 4:
							if (isWRBBear && isBearish) ShortAtMarket( bar + 1, "WRBBear");
							if (isWRBBull && isBullish) BuyAtMarket( bar + 1, "WRBBull");
							break;
						case 5:
							if (compression)
							{
								if(BuyAtStop(bar+1, Highest.Series(High,3)[bar], "CompressionBull") ==null)
									ShortAtStop( bar + 1, Lowest.Series(Low, 3)[bar], "CompressionBear");
							}
							break;
                            case 6:
							if (isGapUp && isBullish) BuyAtClose( bar, "GapUp");
							if (isGapDown && isBearish) ShortAtClose( bar, "GapDown");
							break;
                            default: break;
					}
				}
			}
		}
	}
}
—Gene Geren (Eugene)
Wealth-Lab team
www.wealth-lab.com
BACK TO LIST

NINJATRADER: JANUARY 2021
The PJKShortTermPatterns indicator, as presented in the article by Perry Kaufman in this issue, “A Fresh Look at Short-Term Patterns,” is available for download at the following links for NinjaTrader 8 and for NinjaTrader 7:
Once the file is downloaded, you can import the indicator into NinjaTader 8 from within the control center by selecting Tools → Import →→ NinjaScript Add-On and then selecting the downloaded file for NinjaTrader 8. To import in NinjaTrader 7 from within the control center window, select the menu File → Utilities → Import NinjaScript and select the downloaded file.
You can review the indicator’s source code in NinjaTrader 8 by selecting the menu New → NinjaScript Editor → Indicators from within the control center window and selecting the PJKShortTermPatterns file. You can review the indicator’s source code in NinjaTrader 7 by selecting the menu Tools → Edit NinjaScript → Indicator from within the control center window and selecting the PJKShortTermPatterns file.
A sample chart displaying the indicator is shown in Figure 4.

FIGURE 4: NINJATRADER. The PJKShortTermPatterns indicator is displayed on a daily MSFT chart from November 2019 to November 2020 with TrendPer = 2 and Use Key Reversal = true.
NinjaScript uses compiled DLLs that run native, not interpreted, which provides you with the highest performance possible.
—Chris Lauber
NinjaTrader, LLC
www.ninjatrader.com
BACK TO LIST

NEUROSHELL TRADER: JANUARY 2021
A short-term pattern trading system such as the one discussed by Perry Kaufman in his article in this issue can be easily implemented in NeuroShell Trader by combining a few of NeuroShell Trader’s 800+ indicators.
For this example, we’ve used the island reversal pattern, but you can choose from any of the 90 candlestick and traditional trading patterns included in NeuroShell Trader. To create the trading system, simply select new trading strategy from the insert menu and enter the following in the appropriate locations of the trading strategy wizard:
BUY LONG CONDITIONS: [All of which must be true]
     Key Reversal: Bullish Flag(High,Low,Close)
     A>B(Momentum(Avg(Close,80),1),0)

SELL LONG CONDITIONS: [All of which must be true]
     BarsSinceFill>=X(Trading Strategy,3)

SELL SHORT CONDITIONS: [All of which must be true]
     Key Reversal: Bearish Flag(High,Low,Close)
     A<B(Momentum(Avg(Close,80),1),0)

COVER SHORT CONDITIONS: [All of which must be true]
     BarsSinceFill>=X(Trading Strategy,3)

POSITION SIZING METHOD:
     Fixed Dollar
          10,000.00 Dollars
After entering the system conditions, you can also choose whether the parameters should be genetically optimized. After backtesting the trading strategy, use the detailed analysis button to view the backtest and trade-by-trade statistics for the system.

FIGURE 5: NEUROSHELL TRADER. This NeuroShell Trader chart shows the key reversal pattern applied to Walmart.
NeuroShell Trader users can go to the Stocks & Commodities section of the NeuroShell Trader free technical support website to download a copy of this or any previous Traders’ Tips.
—Marge Sherald, Ward Systems Group, Inc.
301 662-7950, sales@wardsystems.com
www.neuroshell.com
BACK TO LIST

THE ZORRO PROJECT: JANUARY 2021
Japanese traders developed candlestick charts and candlestick patterns in the 17th century. Some traders believe that those patterns are still valid today. But since the 21st-century financial markets are quite different from the Kyoto rice market of 300 years ago, new patterns were invented. In the article “A Fresh Look At Short-Term Patterns” in this issue, Perry Kaufman tests several new patterns with major US stocks and indexes, and with an additional trend filter.
The 6 patterns tested were key reversal, island reversal, outside days, wide-ranging days, 3-day compression, and gap opening. All are calculated from the previous 3 or 4 candles and give a buy or sell signal. Here’s how they look coded as indicators in C:
var cdlKeyReversal()
{
  if(priceHigh(0) > priceHigh(1) && priceLow(0) < priceLow(1))
  {
    if(priceClose(0) < priceLow(1)) return -100; // sell
    if(priceClose(0) > priceHigh(1)) return 100; // buy
  }
  return 0;
}


var cdl3DayCompression()
{
  vars TRs = series(TrueRange(),4);
  if(TRs[0] < TRs[3] && TRs[1] < TRs[3] && TRs[2] < TRs[3])
    return 100;
  else
    return 0;
}

var cdlIslandReversal()
{
  if(priceLow(0) > priceHigh(1) && priceClose(0) < priceOpen(0))
    return -100; // sell
  if(priceLow(1) < priceHigh(0) && priceClose(0) > priceOpen(0))
    return 100; // buy
  else return 0;
}

var cdlOutsideDay()
{
  if(priceHigh(0) > priceHigh(1) && priceLow(0) < priceLow(1))
  {
    if(priceClose(0) < 0.75*priceLow(0) + 0.25*priceHigh(0))
      return -100; // sell
    if(priceClose(0) > 0.25*priceLow(0) + 0.75*priceHigh(0))
      return 100; // buy
  }
  return 0;
}

var cdlWideRangeDays()
{
  if(TrueRange() > 1.5*ATR(20))
    return cdlOutsideDay();
  else
    return 0;
}

var cdlGapOpening()
{
  var Ratio = (priceOpen(0) - priceClose(1))/ATR(20);
  if(Ratio >= 0.5) return 100;
  if(Ratio <= -0.5) return -100;
  return 0;
}
Following the convention of the classic candle patterns from the TA indicator library, the pattern functions return 100 for a bullish pattern, -100 for a bearish pattern, and 0 for no pattern.
We will test the patterns with IWM, AAPL, AMZN, GE, WMT, and TSLA stocks, as well as SPY and QQQ index ETFs. There are two differences from the test in Kaufman’s article. First, we will use not merely price differences, but will simulate real trades with spread and commission. So the returns will be a bit worse but more realistic. Second, we test from 2010 to 2020 to help ensure that the results of all assets are comparable. Some of them, like TSLA, didn’t exist before 2010.
Here is the test script:
var pattern(); // function pointer

void run()
{
  pattern = cdlGapOpening; // place pattern function here
  bool WithTrend = true; // false without trend
  BarPeriod = 1440; // 1 day
  StartDate = 2010; // TSLA went public in 2010
  var Investment = 10000;

  while(asset(loop("SPY","QQQ","IWM","AAPL","AMZN","GE","WMT","TSLA"))) {
  vars Trend = series(SMA(seriesC(),80));
  while(algo(loop("Day1","Day2","Day3","Day4","Day5"))) {
   Lots = Investment/priceClose();
   LifeTime = Itor2+1; // life time in days
  if(pattern() > 0 && (!WithTrend || rising(Trend)))
    enterLong();
  else if(pattern() < 0  && (!WithTrend || falling(Trend)))
    enterShort();
  if(is(EXITRUN)) { // print statistics in the last run
    if(Itor2 == 0) // first loop run
      printf("\n%s Cases %i/%i -",Asset,
        NumWinLong+NumLossLong,NumWinShort+NumLossShort);
    printf(" %s: %.0f/%.0f ",Algo,
      WinLong-LossLong,WinShort-LossShort);
  }
  }} // asset/algo loops
}
Here are some explanations for the code: At the start of the run() function, the pattern and the trend mode are set up. For convenience we’re using a function pointer that is set to the pattern function to be tested. The test uses two nested loops, first for selecting the stocks, and second for selecting the trade lifetime to get the results from a 1-day trade up to a 5-day trade. The predefined Itor2 variable is the iterator of the second loop and runs from 0 to 4, so we just use it to set the LifeTime variable for the subsequent trade. The number of stocks purchased is calculated in the same way as in Kaufman’s article and code. The results are printed in the EXITRUN at the last day of the simulation.
The table in Figure 6 shows an example result for the gap opening pattern with trend.

FIGURE 6: Zorro. Example result for the gap opening pattern with trend.
The numbers are the returns of long/short trades in US dollars.
The pattern functions and the test script can be downloaded from the 2020 script repository on https://financial-hacker.com.
The Zorro platform can be downloaded from https://zorro-project.com.
—Petra Volkova
The Zorro Project by oP group Germany
www.zorro-project.com
BACK TO LIST

OPTUMA: JANUARY 2021
Here is a list of formulas for use with Optuma based on the article in this issue by Perry Kaufman, “A Fresh Look At Short-Term Patterns.”
To include the 80-trend filter, users just need to add ‘and MA(BARS=80) IsUp’ for bullish trend, or ‘MA(BARS=80) IsDown’ for bearish.
Key Revesal - Bullish

BARTYPES().Outside and CLOSE()>HIGH()[1]


Key Reversal - Bearish

BARTYPES().Outside and CLOSE()<LOW()[1]


Island Reversal - Bullish

HIGH()<LOW()[1] and CLOSE()>OPEN()


Island Reversal - Bearish

LOW()>HIGH()[1] and CLOSE()<OPEN()


Compression - Bullish

TR1 = TRUERANGE();

Compression = (TR1[4] > TR1[3]) and (TR1[4] > TR1[2]) and (TR1[4] > TR1[1]);

CompHigh = HIGHESTHIGH(BARS=4);

Compression and CLOSE() CrossesAbove CompHigh


Compression - Bearish

TR1 = TRUERANGE();

Compression = (TR1[4] > TR1[3]) and (TR1[4] > TR1[2]) and (TR1[4] > TR1[1]);

CompLow = LOWESTLOW(BARS=4);

Compression and CLOSE() CrossesBelow CompLow


Outside Days - Bullish

BARTYPES().Outside and

CLOSE() > 0.75*(HIGH() - LOW()) +LOW()


Outside Days - Bearish

BARTYPES().Outside and

CLOSE() < 0.25*(HIGH() - LOW()) +LOW()


Wide Ranging Days - Bullish

ATR1 = ATR(BARS=1);

ATR20 = ATR(BARS=20, MULT=1.50);

(ATR1>ATR20) and

CLOSE() > 0.75*(HIGH() - LOW()) +LOW()


Wide Ranging Days - Bearish

ATR1 = ATR(BARS=1);

ATR20 = ATR(BARS=20, MULT=1.50);

(ATR1>ATR20) and

CLOSE() < 0.25*(HIGH() - LOW()) +LOW()


Opening Gaps - Bullish

ATR20=ATR(BARS=20, MULT=0.50);

OPEN()>(CLOSE()[1]+ATR20) and CLOSE()>OPEN()


Opening Gas - Bearish

ATR20=ATR(BARS=20, MULT=0.50);

OPEN()<(CLOSE()[1]-ATR20) and CLOSE()<OPEN()
Testing
Optuma has a Signal Testing module that can run these formulas over any timeframe and universe of stocks with a couple of clicks, giving the results in seconds. The results show the average percentage returns, and other statistics (including 20th/80th percentiles, standard deviation, and a Monte Carlo simulation).
Here are two example tests since January 2000 on the three ETFs and five stocks used in the article.
Opening Gap—Bullish
Figure 7 shows 1,502 total signals showing performance 5 days before and 10 days after each signal.
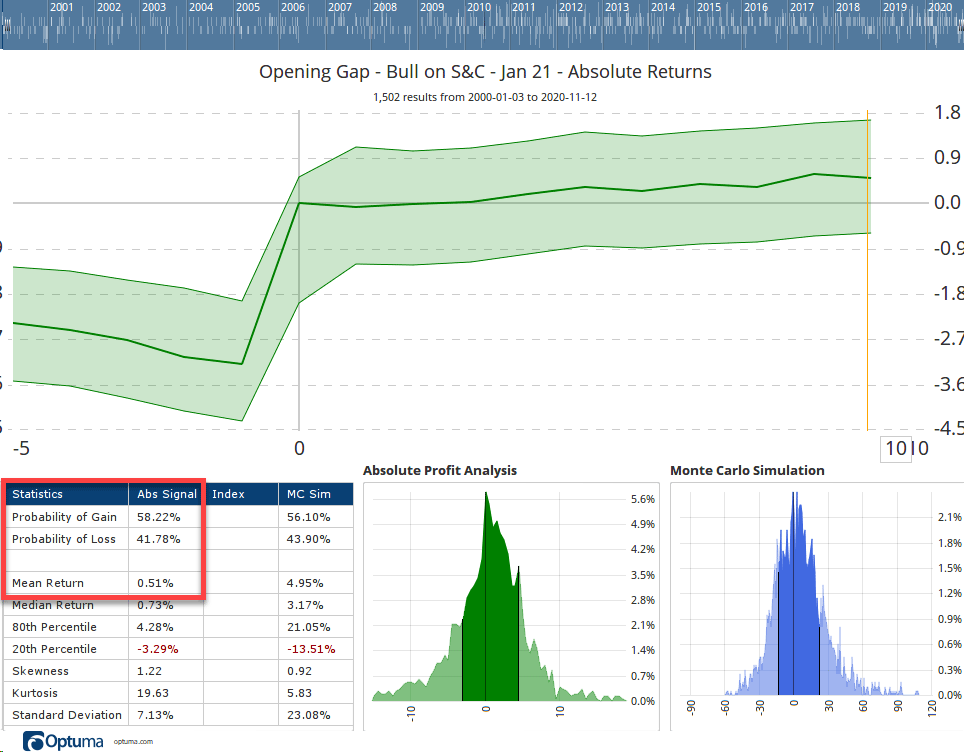
FIGURE 7: OPTUMA. This chart displays sample test results for the bullish opening gap pattern. In this test, there were 1,502 total signals showing performance 5 days before and 10 days after each signal.
After 10 days, there was a probability of gain of 58%, for an average return of 0.51%. The individual instrument breakdown is as follows: 289 signals for SPY with probability of gain after 10 days of 60.5%, with a mean gain of 0.06%. TSLA had a higher mean return (4.3%) but a lower probability of gain (56%) and a higher standard deviation (15.5%) in the 82 events. (See Figure 8.)
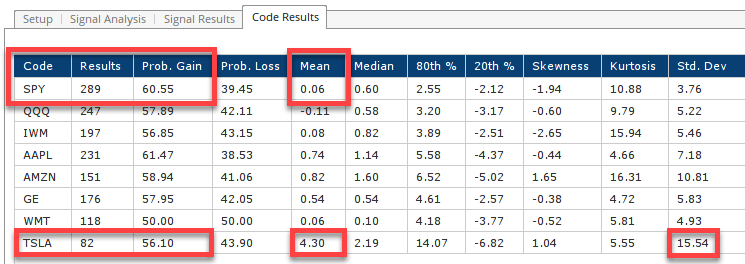
FIGURE 8: OPTUMA. For the instruments tested you can view the trade statistics and metrics, including number of signals found, probability of gain or loss, standard deviation, and mean.
Compression—Bearish with Trend Filter
For this test, we had 433 results showing an average gain after 10 days of 0.3% (see Figure 9). The individual components are shown in Figure 10.
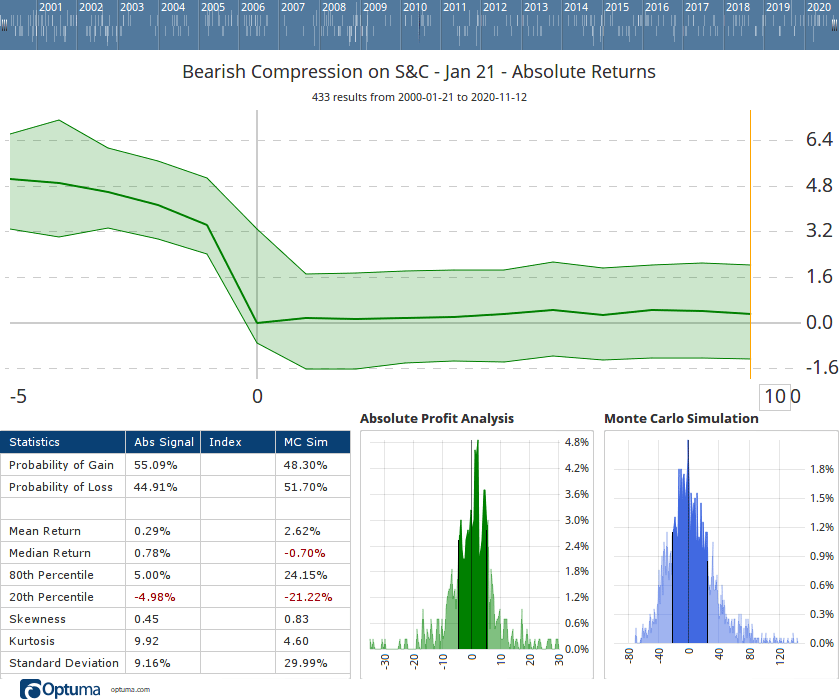
FIGURE 9: OPTUMA. This chart displays sample test results for the bearish compression pattern with a trend filter.
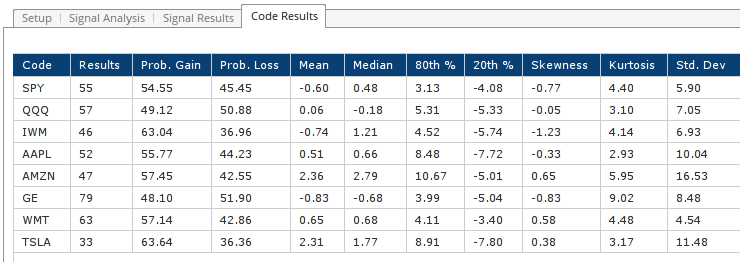
FIGURE 10: OPTUMA. For the instruments tested you can view the trade statistics and metrics.
—support@optuma.com
BACK TO LIST

TRADERSSTUDIO: JANUARY 2021
The importable TradersStudio files based on Perry Kaufman’s article in this issue, “A Fresh Look At Short-Term Patterns (With And Without A Trend Filter),” can be obtained on request via email to info@TradersEdgeSystems.com. The code is also available below.
'A Fresh Look At Short-Term Patterns
'Author: Perry J  Kaufman, TASC Jan 2021
'Coded by: Richard Denning 11/18/2020

Sub ST_Patterns_Sys(TrendLen,ATRLen,exitLenLong,exitLenShort,useTrendFilter)
'TrendLen = 80
'ATRLen = 20
'useTrentFilter = 0 (no trend filter or 1 use trend filter)
Dim theTR As BarArray
Dim theATR As BarArray
theTR = Max(H - L,Max(Abs(C[1] - L),Abs(C[1] - H)))
theATR = Average(theTR,ATRLen)

'Trend Filter:
Dim SMATrend As BarArray
Dim UpTrend As BarArray
Dim DnTrend As BarArray
SMATrend = Average(C,TrendLen)
UpTrend = IFF(SMATrend > SMATrend[1] And useTrendFilter=1,1,IFF(useTrendFilter=0,1,0))
DnTrend = IFF(SMATrend < SMATrend[1] And useTrendFilter=1,1,IFF(useTrendFilter=0,1,0))


'Key reversals a higher high followed by a lower close
' We sell the lower close  The opposite for buy signals
  'If H >  H[1] And C < C[1] And DnTrend Then Sell("BearKeyR",1,0,Market,Day)
  'If L < L[1] And C > C[1] and UpTrend Then Buy("BearKeyR",1,0,Market,Day)

'Island reversals a gap higher followed by a lower close,
' but not filling the gap
'We sell the lower close  The opposite for buy signals
  'If L >  H[1] And C < O And DnTrend Then Sell("BearIslandR",1,0,Market,Day)
  'If H < L[1] And C > O And UpTrend Then Buy("BullIslandR",1,0,Market,Day)

'Outside days a higher high and a lower low, but the
'close in the upper or lower 25% of the range
'We buy if upper, sell if lower
  'If H >  H[1] And L < L[1] And C < (L + (H-L)*0.25) And DnTrend Then Sell("BearOutSide",1,0,Market,Day)
  'If H >  H[1] And L < L[1] And C > (H - (H-L)*0.25) And UpTrend Then Buy("BullOutSide",1,0,Market,Day)

'Wide-ranging days the same as outside days, but the
' true  range  must  exceed  1.5    20-day average true range
  'If H >  H[1] And L < L[1] And C < (L + (H-L)*0.25) And theTR > 1.5*theATR And DnTrend Then Sell("BearWide",1,0,Market,Day)
  'If H >  H[1] And L < L[1] And C > (H - (H-L)*0.25) And theTR > 1.5*theATR And UpTrend Then Buy("BullWide",1,0,Market,Day)

'Compression the most recent 3 days must each have a
' true range smaller than the 4th previous day
' We buy a breakout above the highest high of the
'last 3 days and sell a breakout below the lowest low of the past 3 days
  'If theTR[4] > theTR[1] And theTR[4] > theTR[2] And theTR[4] >theTR[3] And L < Lowest(L,3,1) And DnTrend Then Sell("BearComp",1,0,Market,Day)
  'If theTR[4] > theTR[1] And theTR[4] > theTR[2] And theTR[4] >theTR[3] And H > Highest(H,3,1) And UpTrend Then Buy("BullComp",1,0,Market,Day)

'Gap openings must be larger than 0.5  20-day ATR
' We buy or sell the close of the gap day in the direction of the opening gap
If theATR[1]<>0 Then
  If ((C[1]-O)/theATR[1]) > 0.5*theATR[1] And O < C[1] And DnTrend Then Sell("BearGap",1,0,Market,Day)
  If ((O-C[1])/theATR[1]) > 0.5*theATR[1] And O > C[1] And UpTrend Then Buy("BullGap",1,0,Market,Day)
End If


Dim theBars
theBars = BarsSinceEntry
If theBars >= exitLenLong Then ExitLong("LXTime","",1,0,Market,Day)
If theBars >= exitLenShort Then ExitShort("SXtime","",1,0,Market,Day)

End Sub
Code for the short-term patterns in the article is included in the system file ST_Patterns_Sys both with and without the trend filter depending on the input parameters. All of the patterns are coded on one file so if all of the buy and sell rules for the patterns are uncommented then the back-test will run all the patterns in one run. To test each pattern individually, simply comment out all the other patterns not of current interest. The way I have supplied the code is with all but the BullGap and BearGap patterns commented out. Hence, the only one that will run on a backtest is the gap patterns. Figure 11 shows the equity curve of the BullGap and BearGap trading 100 shares per trade of the NASDAQ 100 list of stocks from 2000 to 2014 with the trend filter turned off. Figure 12 shows the equity curve for the same set except that the trend filter was turned on. The trend filter did not improve the returns.
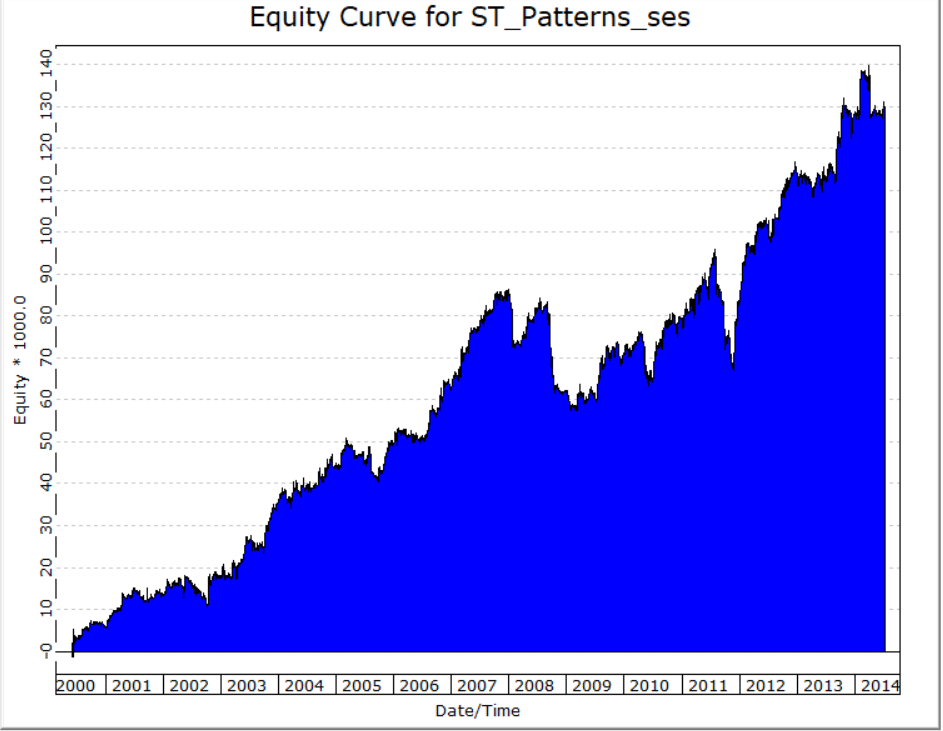
FIGURE 11: Tradersstudio. Equity curve for BullGap and BearGap trading 100 shares per trade of the NASDAQ 100 without the trend filter.
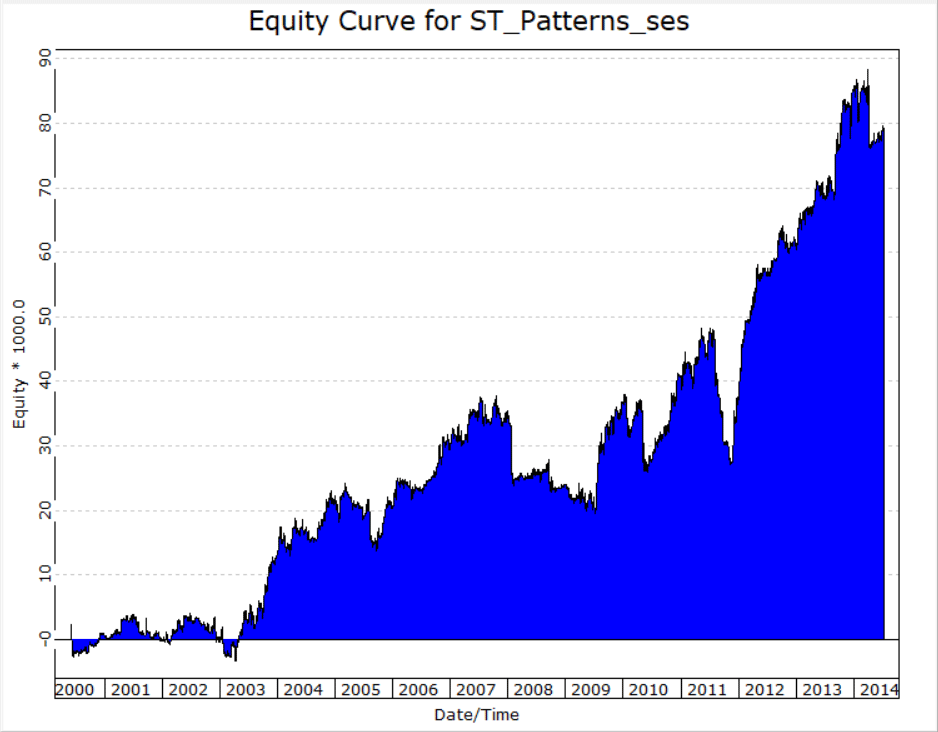
FIGURE 12: Tradersstudio. Equity curve for BullGap and BearGap trading 100 shares per trade of the NASDAQ 100 with the trend filter.
—Richard Denning
info@TradersEdgeSystems.com
for TradersStudio
BACK TO LIST

AIQ: JANUARY 2021
The importable AIQ EDS file based on Perry Kaufman’s article in this issue, “A Fresh Look At Short-Term Patterns (With And Without A Trend Filter),” can be obtained on request via email to info@TradersEdgeSystems.com. The code is also available below.
!A Fresh Look At Short-Term Patterns
!Author: Perry J. Kaufman, TASC Jan 2021
!Coded by: Richard Denning 11/18/2020

C is [close].
C1 is valresult(C,1).
O is [open].
H is [high].
H1 is valresult(H,1).
L is [low].
L1 is valresult(L,1).
L2 is valresult(L,2).
TrendLen is 80.
ATRlen is 20.
OSD is offsettodate(month(),day(),year()).
HD if hasdatafor(ATRlen+20) >= ATRlen.
TR is Max(H - L,max(abs(C1 - L),abs(C1 - H))).
ATR is iff(HD,simpleavg(TR,ATRlen),0).
TR1 is valresult(TR,1).
TR2 is valresult(TR,2).
TR3 is valresult(TR,3).
TR4 is valresult(TR,4).
ATR1 is valresult(ATR,1).

!Key reversals a higher high followed by a lower close.
! We sell the lower close. The opposite for buy signals.
BearKeyR if H > H1 and C < C1.
BullKeyR if L < L1 and C > C1.

!Island reversals a gap higher followed by a lower close,
! but not filling the gap.
!We sell the lower close. The opposite for buy signals.
BearIslandR if L > H1 and C < O.
BullIslandR if H < L1 and C > O.

!Outside days a higher high and a lower low, but the
!close in the upper or lower 25% of the range.
!We buy if upper, sell if lower.
BearOutside if H > H1 and L < L1 and C < (L + (H-L)*0.25).
BullOutside if H > H1 and L < L1 and C > (H - (H-L)*0.25).

!Wide-ranging days the same as outside days, but  the
! true  range  must  exceed  1.5  ×  20-day average true range.
BearWide if H > H1 and L < L1 and C < (L + (H-L)*0.25) and TR > 1.5*ATR.
BullWide if H > H1 and L < L1 and C > (H - (H-L)*0.25) and TR > 1.5*ATR.

!Compression the most recent 3 days must each have a
! true range smaller than the 4th previous day.
! We buy a breakout above the highest high of the
!last 3 days and sell a breakout below the lowest low of the past 3 days.
BearComp if TR4 > TR1 and TR4 > TR2 and TR4 >TR3 and L < lowresult(L,3,1).
BullComp if TR4 > TR1 and TR4 > TR2 and TR4 >TR3 and H > highresult(H,3,1).

!Gap openings must be larger than 0.5 × 20-day ATR.
! We buy or sell the close of the gap day in the direction of the opening gap.
BearGap if ((C1-O)/ATR1) > 0.5*ATR1 and O < C1.
BullGap if ((O-C1)/ATR1) > 0.5*ATR1 and O > C1.

!Trend Filter:
SMATrend is simpleavg(C,TrendLen).
SMATrend1 is valresult(SMATrend,1).
UpTrend if SMATrend > SMATrend1.
DnTrend if SMATrend < SMATrend1.

!Patterns with Trend Filter:
BearKeyRTrend if BearKeyR and DnTrend.
BullKeyRTrend if BullKeyR and UpTrend.
BearIslandRTrend if BearIslandR and DnTrend.
BullIslandRTrend if BullIslandR and UpTrend.
BearWideTrend if BearWide and DnTrend.
BullWideTrend if BUllWide and UpTrend.
BearCompTrend if BearComp and DnTrend.
BullCompTrend if BullComp and UpTrend.
BearGapTrend if BearGap and DnTrend.
BullGapTrend if BullGap and UpTrend.
Code for short-term patterns in the article is included in the EDS file both with and without the trend filter. I ran a portfolio simulation trading NASDAQ 100 stocks with the Bull Outside Day pattern from 1999 to 2020. The equity curve (blue) compared to the NASDAQ index (red) is shown in Figure 13 and the ASA report for the test is shown in Figure 14.

FIGURE 13: AIQ. Equity curve (blue) for Bull Outside Day pattern compared to the NASDAQ 100 index (red) from 1999 to 2020, all trades closed on 4th bar’s open after entry.

FIGURE 14: AIQ. Account Statistics Analysis report for the portfolio simulation.
—Richard Denning
info@TradersEdgeSystems.com
for AIQ Systems
BACK TO LIST
Originally published in the January 2021 issue of
Technical Analysis of STOCKS & COMMODITIES magazine.
All rights reserved. © Copyright 2020, Technical Analysis, Inc.


