TRADERS’ TIPS
February 2021

For this month’s Traders’ Tips, the focus is Richard Poster’s article in this issue, “Trend Strength: Measuring The Duration
Of A Trend.” Here, we present the February 2021 Traders’ Tips code with possible implementations in various software.
You can right-click on any chart to open it in a new tab or window and view it at it’s originally supplied size, often much larger than the version printed in the magazine.
The Traders’ Tips section is provided to help the reader implement a selected technique from an article in this issue or another recent issue. The entries here are contributed by software developers or programmers for software that is capable of customization.

eSIGNAL: FEBRUARY 2021
For this month’s Traders’ Tip, we’ve provided the Trend Persistence.efs study based on the article by Richard Poster in this issue, “Trend Strength: Measuring The Duration Of A Trend.” The study measures trend strength by its duration.
The study contains formula parameters that may be configured through the edit chart window (right-click on the chart and select “edit chart”). A sample chart is shown in Figure 1.
/**********************************
Provided By:
Copyright 2019 Intercontinental Exchange, Inc. All Rights Reserved.
eSignal is a service mark and/or a registered service mark of Intercontinental Exchange, Inc.
in the United States and/or other countries. This sample eSignal Formula Script (EFS)
is for educational purposes only.
Intercontinental Exchange, Inc. reserves the right to modify and overwrite this EFS file with each new release.

Description:
   Trend Strength: Measuring the Duration Of A Trend
   by Richard Poster, PhD


Version:            1.00  12/14/2020

Formula Parameters:                     Default:
TPR Period                              20
SMA Period for TPR                      5
Threshold                               1.0

Notes:
The related article is copyrighted material. If you are not a subscriber
of Stocks & Commodities, please visit www.traders.com.

**********************************/
var fpArray = new Array();
var bInit = false;

function preMain() {
    setStudyTitle("Trend Persistence Rate Indicator");
    setCursorLabelName("TPR", 0);
    setPriceStudy(false);
    setDefaultBarFgColor(Color.RGB(0x00,0x94,0xFF), 0);
    setPlotType( PLOTTYPE_LINE , 0 );


    var x=0;
    fpArray[x] = new FunctionParameter("TPRPeriod", FunctionParameter.NUMBER);
	with(fpArray[x++]){
        setName("TPR Period");
        setLowerLimit(1);
        setDefault(20);
    }
    fpArray[x] = new FunctionParameter("SMAPeriod", FunctionParameter.NUMBER);
	with(fpArray[x++]){
        setName("SMA Period for TPR");
        setLowerLimit(1);
        setDefault(5);
    }
    fpArray[x] = new FunctionParameter("Threshold", FunctionParameter.NUMBER);
	with(fpArray[x++]){
        setLowerLimit(0);
        setDefault(1.0);
    }
    fpArray[x] = new FunctionParameter("joff", FunctionParameter.NUMBER);
	with(fpArray[x++]){
        setName("Bar offset");
        setLowerLimit(0);
        setDefault(0);
    }

}

var bVersion = null;
var TPR = null;
var sma1 = null;
var sma2 = null;
var smadiff = null;
var ctrT = null;
var ctrP = null;
var ctrM = null;
var Mult = null;
var _point = null;
var SMAPeriod = null;
var TPRPeriod = null;
var Threshold = null;
var joff = null;

function main(TPRPeriod, SMAPeriod, Threshold, joff) {
    if (bVersion == null) bVersion = verify();
    if (bVersion == false) return;

    if ( bInit == false ) {
        Mult = 10;
        _point = getMinTick();

        bInit = true;
    }
    if (getCurrentBarCount() <= TPRPeriod) return;
    if (getBarState() == BARSTATE_NEWBAR) {
        ctrP = 0;
        ctrM = 0;
        ctrT = 0;

        for (var i = 0; i < TPRPeriod; i++) {
            sma1 = sma(SMAPeriod, -i - 1 - joff);
            sma2 = sma(SMAPeriod, -i - 2 - joff);
            smadiff = (sma1 - sma2) / (Mult * _point);
            ctrT += 1;
            if (smadiff > Threshold) ctrP += 1;
            if (smadiff < -Threshold) ctrM += 1;

        }
    }
    TPR = Math.abs(100 * (ctrP - ctrM)/ctrT);

    return TPR;
}

function verify(){
    var b = false;
    if (getBuildNumber() < 779){

        drawTextAbsolute(5, 35, "This study requires version 10.6 or later.",
            Color.white, Color.blue, Text.RELATIVETOBOTTOM|Text.RELATIVETOLEFT|Text.BOLD|Text.LEFT,
            null, 13, "error");
        drawTextAbsolute(5, 20, "Click HERE to upgrade.@URL=https://www.esignal.com/download/default.asp",
            Color.white, Color.blue, Text.RELATIVETOBOTTOM|Text.RELATIVETOLEFT|Text.BOLD|Text.LEFT,
            null, 13, "upgrade");
        return b;
    }
    else
        b = true;

    return b;
}

FIGURE 1: eSIGNAL. Here is an example of the study plotted on a daily chart of SPY.
To discuss this study or download a complete copy of the formula code, please visit the EFS Library Discussion Board forum under the forums link from the support menu at www.esignal.com or visit our EFS KnowledgeBase at https://www.esignal.com/support/kb/efs.
—Eric Lippert
eSignal, an Interactive Data company
800 779-6555, www.eSignal.com
BACK TO LIST

THINKORSWIM: FEBRUARY 2021
We have put together a study based on the article in this issue by Richard Poster, “Trend Strength: Measuring The Duration Of A Trend.”
We built the study referenced by using our proprietary scripting language, thinkscript. To ease the loading process, simply click on https://tos.mx/uwHWY0a or enter the address into setup→open shared item from within thinkorswim, then choose view thinkScript study and name it “TrendPersistanceRate” or a name you can identify it by. You can then add this study to your charts from the edit studies menu from within the charts tab.

FIGURE 2: THINKORSWIM. Here is an example of the study. Here, a smoothed TPR plot is shown with trend direction disabled (upper pane) and enabled (middle pane).
The chart in Figure 2 contains a smoothed TPR plot with trend direction disabled (the upper study pane) and enabled (the middle study pane). This is controlled via the correspondent “trend direction” input. The TPR plot is hidden by default, but it can be made visible in the plots panel. The screenshot is meant to resemble Figure 4 from the article. Please refer to the article in this issue for more details about the indicator.
—thinkorswim
A division of TD Ameritrade, Inc.
www.thinkorswim.com
BACK TO LIST

WEALTH-LAB.COM: FEBRUARY 2021
We’ve recreated Richard Poster’s TPR indicator for use in the newly available Wealth-Lab version 7 and have added the indicator to our TASCIndicators library for easy access in any strategy.
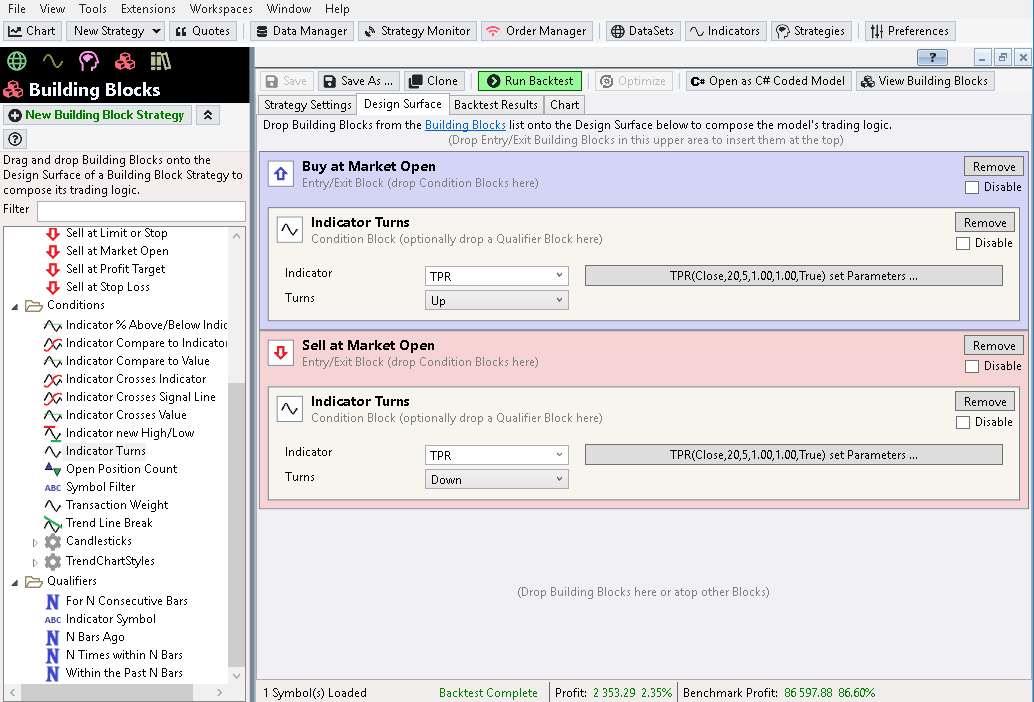
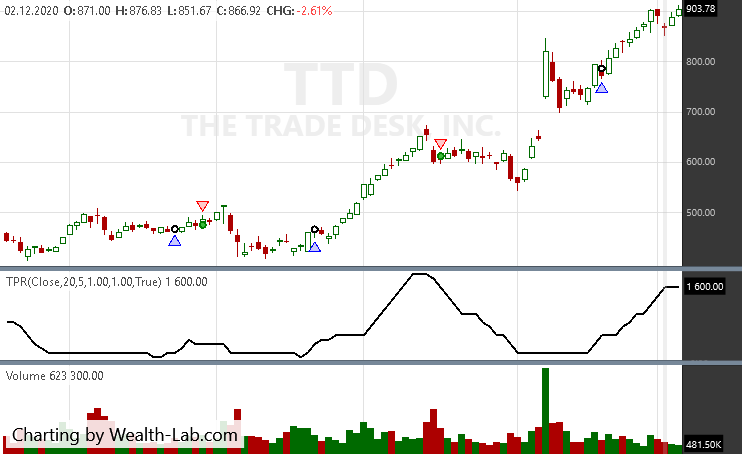
With our new Building Blocks feature, traders can easily set up a strategy. In the example here, users could enter when TPR turns up and exit on the opposite movement in just a few easy steps, as demonstrated in Figure 3. Figure 4 illustrates a few characteristic trades taken by the sample system on the booming TTD stock.

FIGURE 3: WEALTH-LAB. This illustrates laying out strategy rules in a drag-and-drop manner using building blocks in Wealth-Lab.

FIGURE 4: WEALTH-LAB. Sample entries are shown on a daily chart of TTD. Data provided by Yahoo! Finance.
Motivated readers can generate the code behind the indicator by clicking on the button “Open as C# coded model.”
—Gene Geren (Eugene)
Wealth-Lab team
www.wealth-lab.com
BACK TO LIST

NINJATRADER: FEBRUARY 2021
The TPR indicator, as introduced by Richard Poster in his article in this issue, “Trend Strength: Measuring The Duration Of A Trend,” is available for download at the following links for NinjaTrader 8 and NinjaTrader 7:
Once the file is downloaded, you can import the indicator into NinjaTader 8 from within the control center by selecting Tools → Import → NinjaScript Add-On and then selecting the downloaded file for NinjaTrader 8. To import in NinjaTrader 7 from within the control center window, select the menu File → Utilities → Import NinjaScript and select the downloaded file.
You can review the indicator’s source code in NinjaTrader 8 by selecting the menu New → NinjaScript Editor → Indicators from within the control center window and selecting the TPR file. You can review the indicator’s source code in NinjaTrader 7 by selecting the menu Tools → Edit NinjaScript → Indicator from within the control center window and selecting the TPR file.
NinjaScript uses compiled DLLs that run native, not interpreted, which provides you with the highest performance possible.
A sample chart with the indicator is shown in Figure 5.

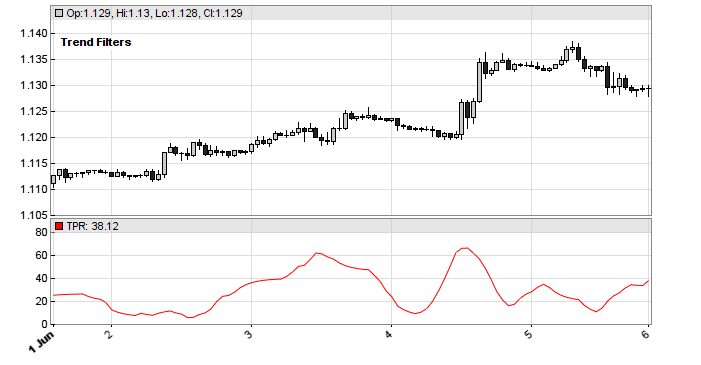
FIGURE 5: NINJATRADER. The TPR indicator counts the number of bars that an SMA slope exceeds a threshold for a specified period on a 60-minute EURUSD chart with data from June 2, 2020 to June 5, 2020.
—Brandon Haulk
NinjaTrader, LLC
www.ninjatrader.com
BACK TO LIST

TRADERSSTUDIO: FEBRUARY 2021
The importable TradersStudio file based on Richard Poster’s article, “Trend Strength: Measuring The Duration Of A Trend,” can be obtained on request via email to info@TradersEdgeSystems.com. The code is also shown below.
'Trend Strength: Measuring The Duratioin of A Trend
'Author: Richard Poster, TASC Feb 2021
'Coded by: Richard Denning 12/15/2020

'FUNCTION THAT RETURNS THE VALUE OF THE TPR:
Function TPR(TPRlen,SMAlen,MULT)
'INPUTS:
'TPRlen = 20
'SMAlen = 5
'MULT = 10

Dim ThrshFixed,_point,countP,countM
Dim sma1 As BarArray
Dim sma2 As BarArray
Dim smadiff As BarArray
Dim up As BarArray
Dim dn As BarArray

ThrshFixed = 1.0
_point = 0.01

'FORMULAS:
sma1 = Average(C,SMAlen,0)
sma2 = Average(C,SMAlen,1)
smadiff = (sma1 - sma2)/(MULT*_point)
up = smadiff>ThrshFixed
dn = smadiff<-ThrshFixed
countP = countof(up,TPRlen,0)
countM = countof(dn,TPRlen,0)
TPR = Abs(100*(countP-countM)/TPRlen)

End Function
'--------------------------------------------------------------------------
'COUNTOF Function
'returns how many times a rule is true in the lookback length
'coded by Richard Denning 01/04/08

Function COUNTOF(rule As BarArray, countLen As Integer, offset As Integer)
Dim count As Integer
Dim counter As Integer
    For counter = 0 + offset To countLen + offset - 1
        If rule[counter] Then
            count = count + 1
        End If
    Next
COUNTOF = count
End Function
'--------------------------------------------------------------------------

'INDICATOR PLOT FOR TPR:
Sub TPR_IND(TPRlen,SMAlen,MULT)
Dim theTPR As BarArray
theTPR = TPR(TPRlen,SMAlen,MULT)
plot1(theTPR)
End Sub
Code for the TPR indicator is provided in the function “TPR” along with the plot indicator “TPR_IND” and the helper function “COUNTOF.” The code is set up for stocks (point value equal to 0.01). Figure 6 demonstrates the indicator on a chart of Amazon (AMZN).

FIGURE 6: TRADERSSTUDIO. Shown here is the TPR indicator on a chart of Amazon (AMZN).
—Richard Denning
info@TradersEdgeSystems.com
for TradersStudio
BACK TO LIST

AIQ: FEBRUARY 2021
The importable AIQ EDS file based on Richard Poster’s article in this issue, “Trend Strength: Measuring The Duration Of A Trend,” can be obtained on request via email to info@TradersEdgeSystems.com. The code is also shown here:
!Trend Strength: Measuring The Duratioin of A Trend
!Author: Richard Poster, TASC Feb 2021
!Coded by: Richard Denning 12/12/2020

!INPUTS:
TPRlen is 20.
SMAlen is 5.
ThrshFixed is 1.0.
MULT is 10.
C is [close].
_point is 0.01.

!FORMULAS:
sma1 is simpleavg(C,SMAlen,0).
sma2 is simpleavg(C,SMAlen,1).
smadiff is (sma1 - sma2)/(MULT*_point).
up if smadiff>ThrshFixed.
dn if smadiff<-ThrshFixed.
countP is countof(up,TPRlen).
countM is countof(dn,TPRlen).
tpr is abs(100*(countP-countM)/TPRlen).

ListValues if 1.
Code for the TPR indicator is set up in the AIQ code file for stocks with point value equal to 0.01. Figure 7 shows the indicator on a chart of Apple Inc. (AAPL).

FIGURE 7: AIQ. The TPR indicator is shown on a chart of Apple Inc. (AAPL).
—Richard Denning
info@TradersEdgeSystems.com
for AIQ Systems
BACK TO LIST

NEUROSHELL TRADER: FEBRUARY 2021
The trend persistance rate indicator (TPR) presented by Richard Poster in his article in this issue can be easily implemented in NeuroShell Trader by combining a few of NeuroShell Trader’s 800+ indicators. To implement the TPR, select new indicator from the insert menu and use the indicator wizard to create the following indicators:
SMADIFF	Divide( Momentum( Avg( Close, 5), 1), Mul2( 10, 0.0001) )
ctrP		Sum( A>B( SMADIFF ), 1.0), 20 )
ctrM		Sum( A<B( SMADIFF ), 1.0 ), 20)
TPR		Abs( Mul2( 100, Divide( Sub( ctrP, ctrM ), 20) ) )

FIGURE 8: NEUROSHELL TRADER. This NeuroShell Trader chart shows the TPR for EUR/USD.
NeuroShell Trader users can go to the Stocks & Commodities section of the NeuroShell Trader free technical support website to download a copy of this or any previous Traders’ Tips.
—Marge Sherald, Ward Systems Group, Inc.
301 662-7950, sales@wardsystems.com
www.neuroshell.com
BACK TO LIST

THE ZORRO PROJECT: FEBRUARY 2021
Financial markets are not stationary; price curves can swing all the time between trending, mean-reverting, or entire randomness. Without a filter for detecting trend regime, any trend-following strategy will bite the dust sooner or later. In his article in this issue, Richard Poster offers a trend persistence indicator (TPR) for helping to avoid unprofitable market periods.
The TPR indicator measures the steepness of a SMA (simple moving average) slope and counts the bars where the slope exceeds a threshold. The more steep bars, the more trending the market. The C code of this indicator is as follows:
var TPR(vars Data,var Threshold,int TPRPeriod,int SMAPeriod)
{
  vars SMAs = series(SMA(Data,SMAPeriod));
  int i, CtrP=0, CtrM = 0;
  for(i=0; i<TPRPeriod; i++) {
    var Slope = SMAs[i]-SMAs[i+1];
    if(Slope > Threshold) CtrP++;
    else if(Slope < -Threshold) CtrM++;
  }
  return 100. * abs(CtrP-CtrM)/TPRPeriod;
}
Threshold, counting period, and SMA period are the parameters of the TPR indicator. The author shows a sample chart of the TPR applied to EUR/USD 1-hour bars. The TPR output is smoothed with an unspecified filter. For replicating his chart, I used a simple EMA(5) and a 1-pip threshold. The resulting chart is shown in Figure 9.

FIGURE 9: ZORRO PROJECT. Used here is a simple EMA(5) and a 1-pip threshold on EUR/USD 1-hour bars.
The article shows some sample results from an SMA crossover system with the TPR in comparison to several other filters, with the TPR having better results. The filter parameters were optimized.
The user should ensure an out-of-sample optimization is used in their tests. I’ll first provide code for an in-sample test:
void run()
{
   BarPeriod = 60;
   StartDate = 2010;
   EndDate = 2020;
   LookBack = 2500;
   set(PARAMETERS);
   asset("EUR/USD");

   while(algo(loop("None","TPR","CCY")))
   {
     vars Smas = series(SMA(seriesC(),2500));
     int Color = BLACK;
     bool Filter = 1;
     if(Algo == "TPR") {
       int Period = optimize(15,10,20,1);
       var Threshold = optimize(10,0,20,2);
       var Tpr = TPR(seriesC(),1*PIP,Period,5);
       Filter = Tpr > Threshold;
       Color = BLUE;
     } else if(Algo == "CCY") {
       Int Period = optimize(15,10,30,5);
       var Threshold = optimize(10,0,40,5);
       Filter = CCYIState(seriesC(),Period,Threshold);
       Color = PURPLE;
    }

    if(Filter && crossOver(Smas,seriesC()))
      enterLong();
    else if(Filter && crossUnder(Smas,seriesC()))
      enterShort();
    plot(Algo,ProfitClosed+ProfitOpen,MAIN|LINE|AXIS2,Color);
  }
}
For out-of-sample optimization, you would need the following two additional commands in the script:
NumWFOCycles = 10;
DataSplit = 75;
This activates 10 walk-forward cycles split into 75% training data and 25% test data.
For a comprehensive comparison of trend filters, we had to repeat this out-of-sample test with many other assets and many different time periods, and possibly other trend-following methods than a SMA crossing could also be tested.
The TPR indicator and the trading system can be downloaded from the 2020 script repository on https://financial-hacker.com.
The Zorro platform can be downloaded from https://zorro-project.com.
—Petra Volkova
The Zorro Project by oP group Germany
www.zorro-project.com
BACK TO LIST
MICROSOFT EXCEL: FEBRUARY 2021
In his article in this issue, Richard Poster outlines several common ways to evaluate the strength and duration of trends. Then he evaluates their sensitivity to volatility. Next, he steps up our game a bit by proposing an indicator that seeks to measure a trend’s persistence rate, or TPR for short. TPR turns out to be relatively insensitive to the influence of volatility.
The article is focused around the forex market. The TPR example in the article’s Figure 4 uses a little over three days of hourly (H1) historical data for the euro versus US dollar futures (EURUSD,H1). My spreadsheets can only access end-of-day history using symbol EURUSD=X. So it is not possible for me to replicate his Figure 4 in Excel. However, that does not preclude using this indicator in other timeframes or other equities.
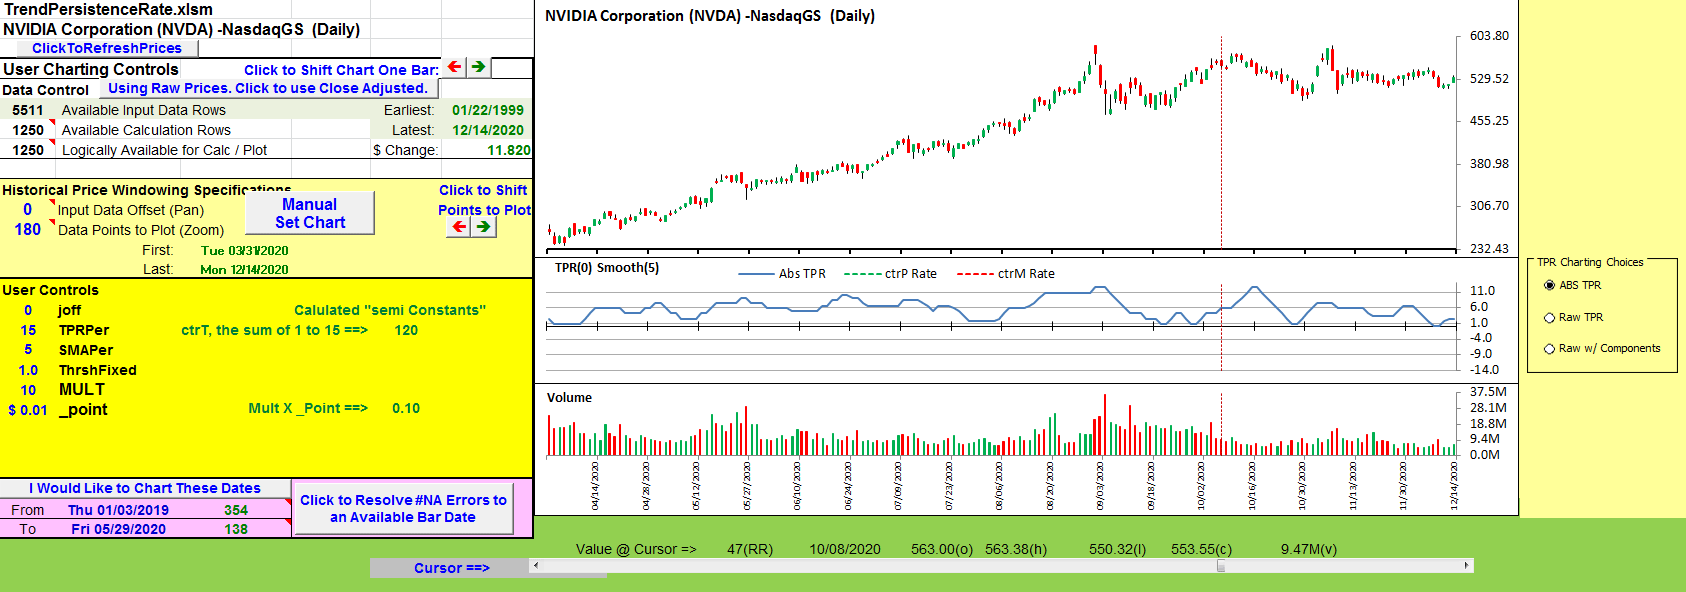
I will use NVIDIA (NVDA), a stock that has been in play recently, to explore TPR. With my example coming from the equity and ETF space, I set a penny as the point value.
To the right of the chart, three buttons control the TPR display. The “ABS TPR” option displays TPR as defined by the MQL4 code in the article’s sidebar.

FIGURE 10: EXCEL. TPR with settings similar to those used in the article.
The TPR plot in Figure 10 looks “late” to my eye, so in Figure 11 I tried again with “joff” set to zero.

FIGURE 11: EXCEL. TPR with joff=0 shifts the plot left to more closely align with the price chart.
Raw TPR is the difference between a positive and negative component, as shown in Figure 12. The finished TPR is the absolute value of this raw computation.

FIGURE 12: EXCEL. TPR in its raw form is the difference of the positive and negative components.
In Figure 13 I played a bit with the TPR period, which altered the shape of the chart.

FIGURE 13: EXCEL. Adjusting the TPRPer value downward makes TPR a bit more reactive.
To successfully download a working version of this spreadsheet:
- Right-click on the Excel file link, then
- Select “save as” (or “save target as”) to place a copy of the spreadsheet file on your hard drive.
—Ron McAllister
Excel and VBA programmer
rpmac_xltt@sprynet.com
BACK TO LIST
Originally published in the February 2021 issue of
Technical Analysis of STOCKS & COMMODITIES magazine.
All rights reserved. © Copyright 2021, Technical Analysis, Inc.


