TRADERS’ TIPS
March 2021

For this month’s Traders’ Tips, the focus is Vitali Apirine’ article in this issue, “Rate Of Change With Bands.” Here, we present the March 2021 Traders’ Tips code with possible implementations in various software.
You can right-click on any chart to open it in a new tab or window and view it at it’s originally supplied size, often much larger than the version printed in the magazine.
The Traders’ Tips section is provided to help the reader implement a selected technique from an article in this issue or another recent issue. The entries here are contributed by software developers or programmers for software that is capable of customization.

TRADESTATION: MARCH 2021
In his article “Rate Of Change With Bands” in this issue, author Vitali Apirine introduces a concept of identifying overbought and oversold levels based on calculating standard deviation bands of the rate of change (ROC) momentum oscillator. The rate of change bands widen and narrow as the ROC deviation increases and decreases. The author proposes using this indicator in conjunction with other technical analysis methods to determine if the instrument is overbought or oversold. Posted below is EasyLanguage code for a function, the indicator described in the article, and a sample strategy for educational purposes.
Function:  _TASC_MAR2021_Fx
// TASC MAR 2021
// Rate of Change With Bands
// Vitali Apirine

inputs:
    Periods1( numericsimple ),
    Periods2( numericsimple ),
    Periods3( numericsimple ),
    RateOfChgPrice( numericseries ),
    oROCDev( numericref ),
    oMARoc( numericref );

variables:
    RateofChg( 0 ),
    AvgOfSquares( 0 );

once
begin
    // force function to be series since
    // XAverage is used
    Value1 = RateOfChg[1];
end;

RateOfChg = RateOfChange( RateOfChgPrice, Periods1 );
AvgOfSquares = Average( Square( RateOfChg ),
 Periods3 );

// set the output variables
oROCDev = SquareRoot( AvgOfSquares );
oMARoc = XAverage( RateOfChg, Periods2 );

_TASC_MAR2021_Fx = 1;


Indicator: TASC MAR 2021
// TASC MAR 2021
// Rate of Change With Bands
// Vitali Apirine

inputs:
    Periods1( 12 ),
    Periods2( 3 ),
    Periods3( 12 ),
    RateOfChgPrice( Close ),
    NumDevUp( 1 ),
    NumDevDn( -1 );

variables:
    ROCDev( 0 ),
    MaRateOfChg( 0 ),
    UpperBand( 0 ),
    LowerBand( 0 );

Value1 = _TASC_MAR2021_Fx( Periods1, Periods2,
 Periods3, RateOfChgPrice, ROCDev, MaRateOfChg );

UpperBand = ROCDev * NumDevUp;
LowerBand = ROCDev * NumDevDn;

Plot1( UpperBand, "UpperBand" );
Plot2( MaRateOfChg, "MA-ROC" );
Plot3( LowerBand, "-LowerBand" );


Strategy:  TASC MAR 2021 Strategy
// TASC MAR 2021
// Rate of Change With Bands
// Vitali Apirine

// for educational purposes only

inputs:
    Periods1( 12 ),
    Periods2( 3 ),
    Periods3( 12 ),
    RateOfChgPrice( Close ),
    EMAPrice( Close ),
    EMALen( 200 ),
    NumDevUp( 1 ),
    NumDevDn( -1 );

variables:
    ROCDev( 0 ),
    MaRateOfChg( 0 ),
    UpperBand( 0 ),
    LowerBand( 0 ),
    EMA( 0 ),
    UpTrend( false ),
    DnTrend( false );

Value1 = _TASC_MAR2021_Fx( Periods1, Periods2,
 Periods3, RateOfChgPrice, ROCDev, MaRateOfChg );

EMA = XAverage( EMAPrice, EMALen );

UpperBand = ROCDev * NumDevUp;
LowerBand = ROCDev * NumDevDn;

UpTrend = Close > EMA;
DnTrend = Close <= EMA;

if UpTrend then
begin
    if MaRateOfChg crosses over LowerBand then
        Buy ( "ROCWB-LE" ) next bar market
    else if MaRateOfChg crosses under UpperBand then
        Sell ( "ROCWB-LX" ) next bar market;
end
else if DnTrend then
begin
    if MaRateOfChg crosses over LowerBand then
        BuyToCover ( "ROCWB-SX" ) next bar market
    else if MaRateOfChg crosses under UpperBand then
        SellShort ( "ROCWB-SE" ) next bar market;
end;
To download the EasyLanguage code for TradeStation 10, please visit our TradeStation and EasyLanguage support forum. The files for this article can be found here: https://community.tradestation.com/discussions/Topic.aspx?Topic_ID=190289.
A sample chart is shown in Figure 1.

FIGURE 1: TRADESTATION. This example chart of the daily SPY with the indicator applied in the subgraph shows a 200-period exponential moving average plotted with price, and the strategy inserted.
This article is for informational purposes. No type of trading or investment recommendation, advice, or strategy is being made, given, or in any manner provided by TradeStation Securities or its affiliates.
—Chris Imhof
TradeStation Securities, Inc.
www.TradeStation.com
BACK TO LIST

eSIGNAL: MARCH 2021
For this month’s Traders’ Tip, we’ve provided the Rate Of Change With Bands.efs study based on the article by Vitali Apirine in this issue, “Rate Of Change With Bands.” The study measures the percent change in price and utilizes bands to display the upper and lower limits of the rate of change.
The study contains formula parameters that may be configured through the edit chart window (right-click on the chart and select “edit chart”). A sample chart is shown in Figure 2.

FIGURE 2: eSIGNAL. Here is an example of the study plotted on a daily chart of $RUT.
To discuss this study or download a complete copy of the formula code, please visit the EFS library discussion board forum under the forums link from the support menu at www.esignal.com or visit our EFS KnowledgeBase at www.esignal.com/support/kb/efs/. The eSignal formula script (EFS) is also shown here:
/**********************************
Provided By:
Copyright 2019 Intercontinental Exchange, Inc. All Rights Reserved.
eSignal is a service mark and/or a registered service mark of Intercontinental Exchange, Inc.
in the United States and/or other countries. This sample eSignal Formula Script (EFS)
is for educational purposes only.
Intercontinental Exchange, Inc. reserves the right to modify and overwrite this EFS file with each new release.

Description:
   Rate Of Change With Bands
   by Vitali Apirine


Version:            1.00  01/14/2021

Formula Parameters:                    Default:
Periods1                               12
Periods2                               3
Periods3                               12

Notes:
The related article is copyrighted material. If you are not a subscriber
of Stocks & Commodities, please visit www.traders.com.

**********************************/
var fpArray = new Array();
var bInit = false;

function preMain() {
    setStudyTitle("Rate Of Change With Bands");
    setCursorLabelName("ROCDEV Upper", 0);
    setCursorLabelName("MaRateOfChg", 1);
    setCursorLabelName("ROCDEV Lower", 2);
    setPriceStudy(false);
    setDefaultBarFgColor(Color.RGB(0x00,0x94,0xFF), 0);
    setDefaultBarFgColor(Color.RGB(0xFE,0x69,0x00), 1);
    setDefaultBarFgColor(Color.RGB(0x00,0x94,0xFF), 2);
    setPlotType( PLOTTYPE_LINE , 0 );
    setPlotType( PLOTTYPE_LINE , 1 );
    setPlotType( PLOTTYPE_LINE , 2 );
    addBand( 0, PLOTTYPE_DOT, 1, Color.grey);


    var x=0;
    fpArray[x] = new FunctionParameter("Periods1", FunctionParameter.NUMBER);
	with(fpArray[x++]){
        setLowerLimit(1);
        setDefault(12);
    }
    fpArray[x] = new FunctionParameter("Periods2", FunctionParameter.NUMBER);
	with(fpArray[x++]){
        setLowerLimit(1);
        setDefault(3);
    }
    fpArray[x] = new FunctionParameter("Periods3", FunctionParameter.NUMBER);
	with(fpArray[x++]){
        setLowerLimit(1);
        setDefault(12);
    }

}

var bVersion = null;
var xROCDEV = null;
var xMAROC = null;
var xROC = null;
var xClose = null;


function main(Periods1, Periods2, Periods3) {
    if (bVersion == null) bVersion = verify();
    if (bVersion == false) return;

    if ( bInit == false ) {
        xClose = close();
        xROC = roc(Periods1, xClose);
        xROCDEV = efsInternal("Calc_ROCDEV", xROC, Periods3);
        xMAROC = ema(Periods2, xROC);

        bInit = true;
    }

    if (getCurrentBarCount() <= Periods1) return;

    return [xROCDEV.getValue(0), xMAROC.getValue(0), -xROCDEV.getValue(0)]
}

function Calc_ROC(xClose, Periods1){
    if (close_1 == null) return;
    var ret = (xClose.getValue(0) - xClose. getValue(-Periods1)) / xClose.getValue(-Periods1) * 100;
    return ret;
}

function Calc_ROCDEV(xROC, Periods3){
    var ret = 0;
    var sum = 0;
    for (var i = 0; i < Periods3; i++){
        sum = sum + (xROC.getValue(-i) * xROC.getValue(-i));
    }
    var AVG = sum / Periods3;
    ret = Math.sqrt(AVG);
    return ret;
}

function verify(){
    var b = false;
    if (getBuildNumber() < 779){

        drawTextAbsolute(5, 35, "This study requires version 10.6 or later.",
            Color.white, Color.blue, Text.RELATIVETOBOTTOM|Text.RELATIVETOLEFT|Text.BOLD|Text.LEFT,
            null, 13, "error");
        drawTextAbsolute(5, 20, "Click HERE to upgrade.@URL=https://www.esignal.com/download/default.asp",
            Color.white, Color.blue, Text.RELATIVETOBOTTOM|Text.RELATIVETOLEFT|Text.BOLD|Text.LEFT,
            null, 13, "upgrade");
        return b;
    }
    else
        b = true;

    return b;
}
—Eric Lippert
eSignal, an Interactive Data company
800 779-6555, www.eSignal.com
BACK TO LIST

THINKORSWIM: MARCH 2021
We have put together a study based on the article by Vitali Apirine in this issue titled “Rate Of Change With Bands,” which bases trading bands on oscillator values (the ROC). We built the study referenced by using our proprietary scripting language, thinkscript. To ease the loading process, simply click on https://tos.mx/Uv79gXR or enter it into the address into setup → open shared item from within thinkorswim, then choose view thinkScript study and name it “RateOfChangeWithBands” (or whatever you like and can identify). You can then add the study to your charts from the edit studies menu from within the charts tab.
A sample chart is shown in Figure 3, which shows the study applied to a daily chart of SPX. This chart is our version of Figure 4 in Apirine’s article. Unlike the implementation in the article, the price to calculate ROC and the average type to smooth it are configurable. Also, instead of using a vague “ROC deviation” name for the bands, the plot names are +RMS and -RMS, as they are calculated as the root mean square and we use RMS in some other studies.

FIGURE 3: THINKORSWIM. This sample chart demonstrates the study applied to a daily chart of SPX.
—thinkorswim
A division of TD Ameritrade, Inc.
www.thinkorswim.com
BACK TO LIST

WEALTH-LAB.COM: MARCH 2021
To use the ROCWB bands described in Vitali Apirine’s article in this issue, “Rate Of Change With Bands,” the latest version of Wealth-Lab, Version 7, provides an out-of-the-box solution.
The example trading system shown in Figure 4 goes long when ROC turns up from below the lower ROC band and the price is above its 200-day exponential moving average. The two conditions together help to identify a pullback coming to an end in an established long-term uptrend. The system sells when ROC crosses below the oversold threshold of the upper ROC band.
using System.Drawing;
using WealthLab.Backtest;
using WealthLab.Core;
using WealthLab.Indicators;
using WealthLab.TASC;

namespace WealthScript1
{
    public class ROCwBands : UserStrategyBase
    {
        public override void Initialize( BarHistory bars)
        {
			rbu = ROCWBUpper.Series(bars.Close, 12, 3, 12);
			rbl = ROCWBLower.Series(bars.Close, 12, 3, 12);
			roc = ROC.Series(bars.Close, 12);
			ema = EMA.Series(bars.Close, 200);

			PlotTimeSeries( roc, "ROC", "roc", Color.Gray);
			PlotTimeSeries( rbu, "ROCWB Upper", "roc", Color.Red);
			PlotTimeSeries( rbl, "ROCWB Lower", "roc", Color.Red);
        }

        public override void Execute( BarHistory bars, int idx)
        {
            if (!HasOpenPosition( bars, PositionType.Long))
            {
				/* Uptrend: price is above 200-day EMA */
				if(bars.Close[idx] > ema[idx] && idx > ema.FirstValidIndex)
				{
					/* Pullback: ROC crosses above the oversold level of lower ROC Band from below */
					if(roc.TurnsUp(idx) && roc[idx - 1] < rbl[idx - 1])
						PlaceTrade( bars, TransactionType.Buy, OrderType.Market);
				}
            }
            else
            {
				/* Temporary overbought: ROC crosses below the overbought level of upper ROC Band from above */
				if(roc.TurnsDown(idx) && roc.CrossesUnder(rbu,idx))
                            ClosePosition( LastPosition, OrderType.Market);
            }
        }

		ROCWBUpper rbu;
		ROCWBLower rbl;
		ROC roc;
		EMA ema;
	}
}

FIGURE 4: WEALTH-LAB. The example trading system is shown on the SPY.
—Gene Geren (Eugene)
Wealth-Lab team
www.wealth-lab.com
BACK TO LIST

NINJATRADER: MARCH 2021
The ROCWB indicator, as discussed in “Rate Of Change With Bands” by Vitali Apirine in this issue, is available for download at the following links for NinjaTrader 8 and for NinjaTrader 7:
Once the file is downloaded, you can import the indicator into NinjaTader 8 from within the control center by selecting Tools → Import → NinjaScript Add-On and then selecting the downloaded file for NinjaTrader 8. To import into NinjaTrader 7, from within the control center window, select the menu File → Utilities → Import NinjaScript and select the downloaded file.
You can review the indicator’s source code in NinjaTrader 8 by selecting the menu New → NinjaScript Editor → Indicators from within the control center window and selecting the ROCWB file. You can review the indicator’s source code in NinjaTrader 7 by selecting the menu Tools → Edit NinjaScript → Indicator from within the control center window and selecting the ROCWB file.
A chart displaying the indicator is shown in Figure 5.

FIGURE 5: NINJATRADER. This hourly chart shows the emini S&P 500 futures (ES 03-21) with ROCWB (12,3,12) in the upper pane from December 2020 to January 2021.
—Brandon Haulk
NinjaTrader, LLC
www.ninjatrader.com
BACK TO LIST

NEUROSHELL TRADER: MARCH 2021
The rate of change bands described by Vitali Apirine in his article in this issue can be easily implemented in NeuroShell Trader by combining a few of NeuroShell Trader’s 800+ indicators. To implement the bands, select new indicator from the insert menu and use the indicator wizard to set up the following indicators:
ROCDEV	SqrRt( Avg( Mul2( %Change(Close,12), %Change(Close,12) ), 12) )
MaRateOfChg	Avg( %Change(Close,12), 3 )
-ROCDEV	Neg( ROCDEV )
NeuroShell Trader users can go to the Stocks & Commodities section of the NeuroShell Trader free technical support website to download a copy of this or any previous Traders’ Tips.

FIGURE 6: NEUROSHELL TRADER. This NeuroShell Trader chart shows the rate of change bands on SPY.
—Marge Sherald, Ward Systems Group, Inc.
301 662-7950, sales@wardsystems.com
www.neuroshell.com
BACK TO LIST

OPTUMA: MARCH 2021
Code to implement the technique presented in Vitali Apirine’s article in this issue “Rate Of Change With Bands” on the Optuma platform is given here.
// Set periods;
#$Period1=12;
#$Period2=3;
#$Period3=12;
//Calc ROC, and square it;
R1=ROC(BARS=$Period1);
R2=(R1*R1);
//Get avg of squares;
AvSq= MA(R2, BARS=$Period3, CALC=Close);
//Plot ROC with Bands;
Plot1=MA(R1, BARS=$Period2, STYLE=Exponential, CALC=Close);
Plot2=SQRT(AvSq);
Plot3=SQRT(AvSq)*-1;
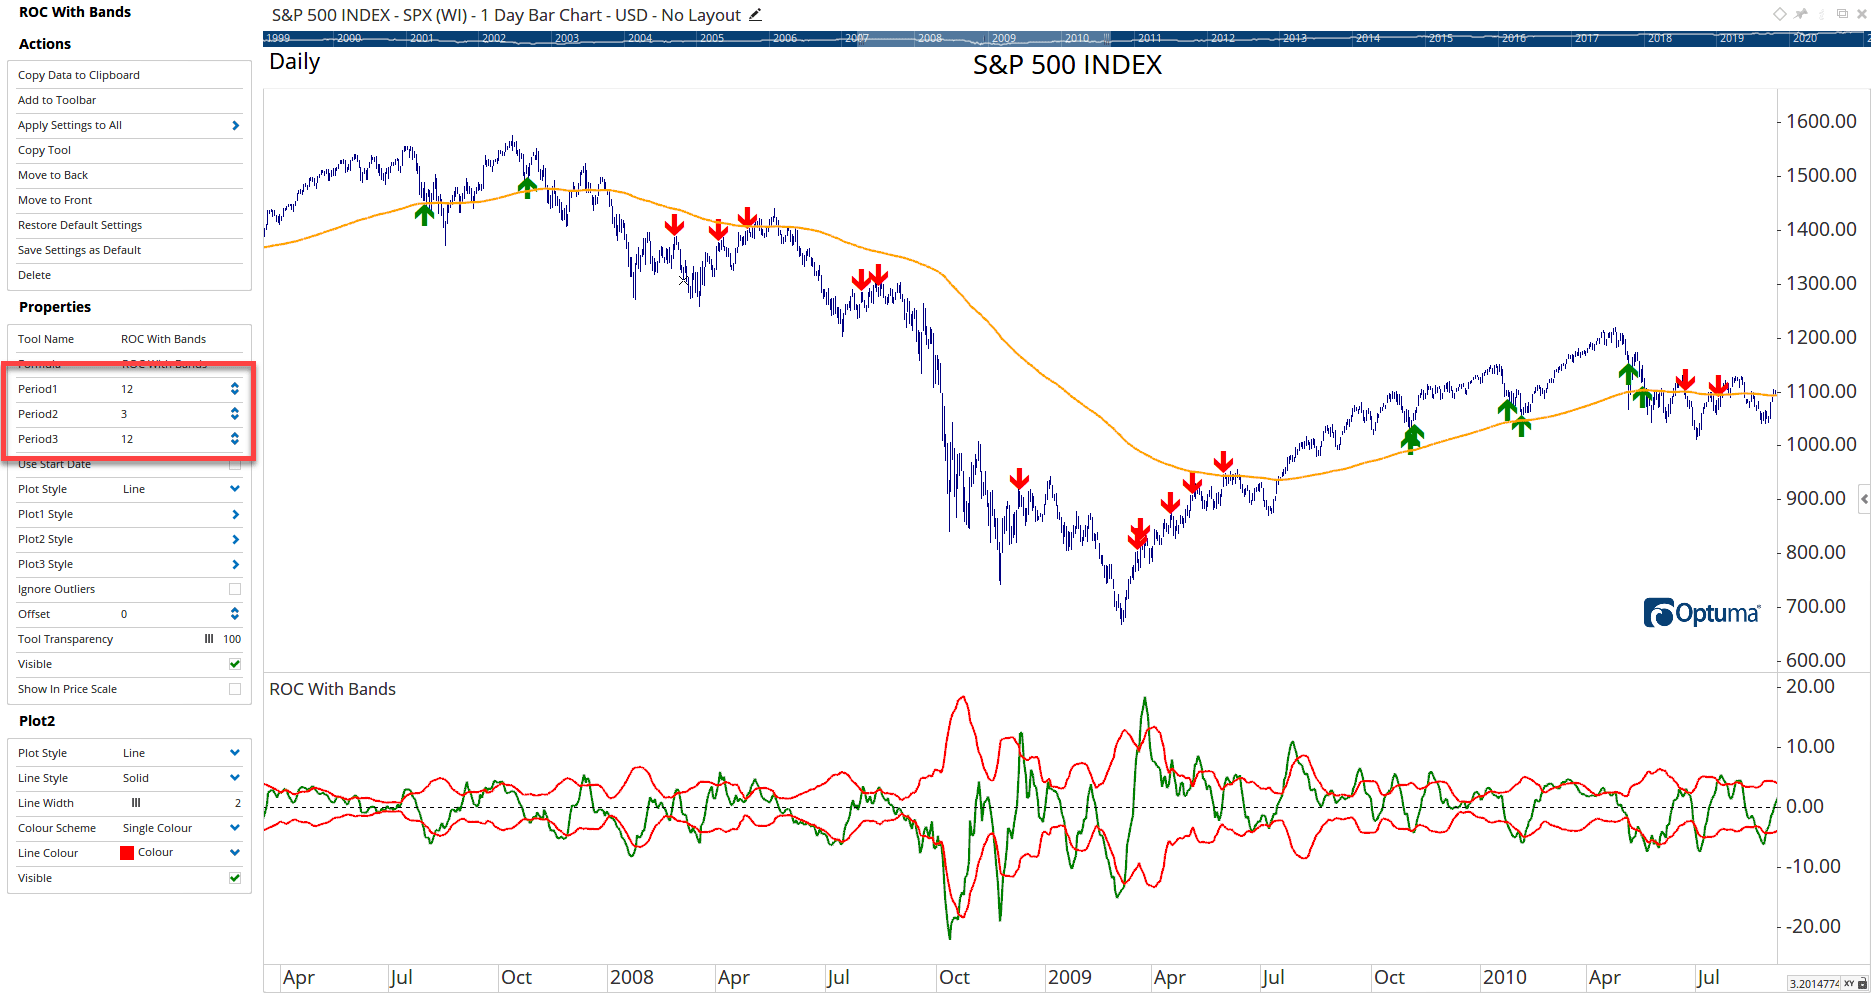
Once added, using the show view tool, the period variables will be displayed in the tool properties, allowing for easy adjustment. The red and green arrows use a slightly modified script in a show bar tool showing overbought/oversold crossovers above and below the 200EMA. A sample chart is shown in Figure 7.

FIGURE 7: OPTUMA. This sample chart displays the rate of change bands. Parameters can be adjusted in the tool properties. Here, red and green arrows show overbought/oversold crossovers above and below the 200EMA.
—support@optuma.com
BACK TO LIST

THE ZORRO PROJECT: MARCH 2021
In “Rate Of Change With Bands” in this issue, author Vitali Apirine applies the concept of trading bands to the rate of change (ROC) oscillator. The ROC is smoothed with a 3-day EMA, then the square root of its 12-day sum of squares is used for generating upper and lower bands.
The code in C for the Zorro platform follows:
var RocDev;
var ROCWM(vars Data,int Period1,int Period2,int Period3)
{
  var Roc = ROC(Data,Period1);
  vars RocSqrs = series(Roc*Roc);
  RocDev = sqrt(Sum(RocSqrs,Period3)/Period3);
  return EMA(Roc,Period2);
}
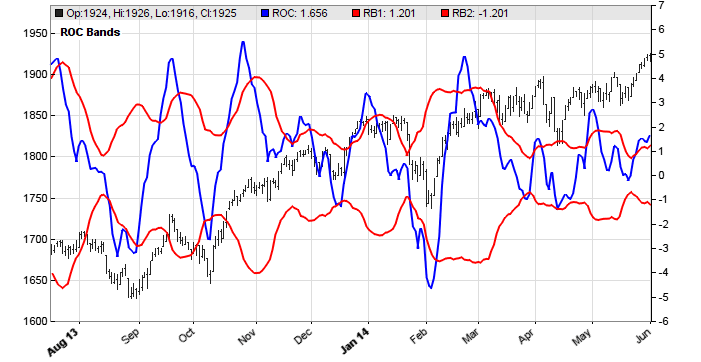
We used this function to replicate the author’s ROC bands on an SPX chart on the Zorro platform for the period August 2013 to June 2014. Here is the code:
void run()
{
  BarPeriod = 1440;
  StartDate = 20130801;
  EndDate = 20140601;

  assetAdd("SPX","STOOQ:^SPX"); // load price history from Stooq
  asset("SPX");

  plot("ROC",ROCWM(seriesC(),12,3,12),AXIS2|LINE,BLUE);
  plot("RB1",RocDev,AXIS2|LINE,RED);
  plot("RB2",-RocDev,AXIS2|LINE,RED);
}
The resulting chart is shown in Figure 8.

FIGURE 8: ZORRO PROJECT. ROC bands are shown on SPX, August 2013–June 2014.
The script for the ROCWN indicator can be downloaded from https://financial-hacker.com/scripts2020.zip. The Zorro platform can be downloaded from https://zorro-project.com/download.php.
—Petra Volkova
The Zorro Project by oP group Germany
www.zorro-project.com
BACK TO LIST

TRADERSSTUDIO: MARCH 2021
The importable TradersStudio files based on Vitali Apirine’s article in this issue, “Rate of Change With Bands,” can be obtained on request via email to info@TradersEdgeSystems.com. The code is also available here:
'Rate Of Change With Bands
'Author: Vitali Aprine, TASC Mar 2021
'Coded by: Rich Denning, 01/11/2021

Function ROCB(rocLen,emaLen,smaLen,byref upROCB ,byref dnROCB)
'INPUTS:
'rocLen = 12
'emaLen = 3
'smaLen = 12

Dim theROC
Dim smaSqr
Dim ROCdev
Dim emaROC

If C[rocLen] <> 0 Then
  theROC = (C - C[rocLen]) / C[rocLen]*100
End If
smaSqr = Average(theROC*theROC,smaLen)
ROCdev = Sqr(smaSqr)
emaROC = XAverage(theROC,emaLen)
upROCB = ROCdev
dnROCB =  - ROCdev
ROCB = emaROC

End Function
'-------------------------------------------------------------
'INDICATOR PLOT FOR ROCB:
Sub ROCB_IND(rocLen,emaLen,smaLen)
'INPUTS:
'rocLen = 12
'emaLen = 3
'smaLen = 12

Dim upROCB
Dim dnROCB
Dim emaROC

emaROC = ROCB(rocLen,emaLen,smaLen,upROCB,dnROCB)
plot1(emaROC)
plot2(upROCB)
plot3(dnROCB)

End Sub
'--------------------------------------------------------------

FIGURE 9: TRADERSSTUDIO. Shown here is the ROCB indicator on a chart of Apple Inc (AAPL).
—Richard Denning
info@TradersEdgeSystems.com
for TradersStudio
BACK TO LIST

AIQ: MARCH 2021
The importable AIQ EDS file based on Vitali Apirine’s article in this issue, “Rate Of Change With Bands,” can be obtained on request via email to info@TradersEdgeSystems.com. The code is also shown here:
!Rate Of Change With Bands
!Author: Vitali Aprine, TASC Mar 2021
!Coded by: Rich Denning, 01/11/2021

!INPUTS:
rocLen is 12.
emaLen is 3.
smaLen is 12.

C is [close].

ROC is (C - valresult(C,rocLen)) / valresult(C,rocLen)*100.
smaSqr is simpleavg(ROC*ROC,smaLen).
ROCdev is sqrt(smaSqr).
emaROC is expavg(ROC,emaLen).
upROCB is ROCdev.
dnROCB is  - ROCdev.
Code for the ROCB indicator is set up in the AIQ code file. Figure 10 shows the indicators on a chart of Apple Inc. (AAPL). The red line in the first panel is the upper ROC band and the green line is the smoothed ROC. In the lower panel, the red line is the lower ROC band and the green line is the smoothed ROC.

FIGURE 10: AIQ. The ROCB indicators are shown on a chart of Apple Inc. (AAPL). The red line in the first panel is the upper ROC band and the green line is the smoothed ROC. In the lower panel, the red line is the lower ROC band and the green line is the smoothed ROC.
—Richard Denning
info@TradersEdgeSystems.com
for AIQ Systems
BACK TO LIST

TRADE NAVIGATOR: MARCH 2021
We have created a library to download in Trade Navigator based on the article in this issue by Vitali Apirine, “Rate Of Change With Bands.” The filename is SC202103. To use it, click on Trade Navigator’s file dropdown menu and select update data. Next, select download special file, erase the word “upgrade,” and type in “SC202103.” Then click the start button. When prompted to upgrade, click the yes button. If prompted to close all software, click on the continue button. Your library will now download.
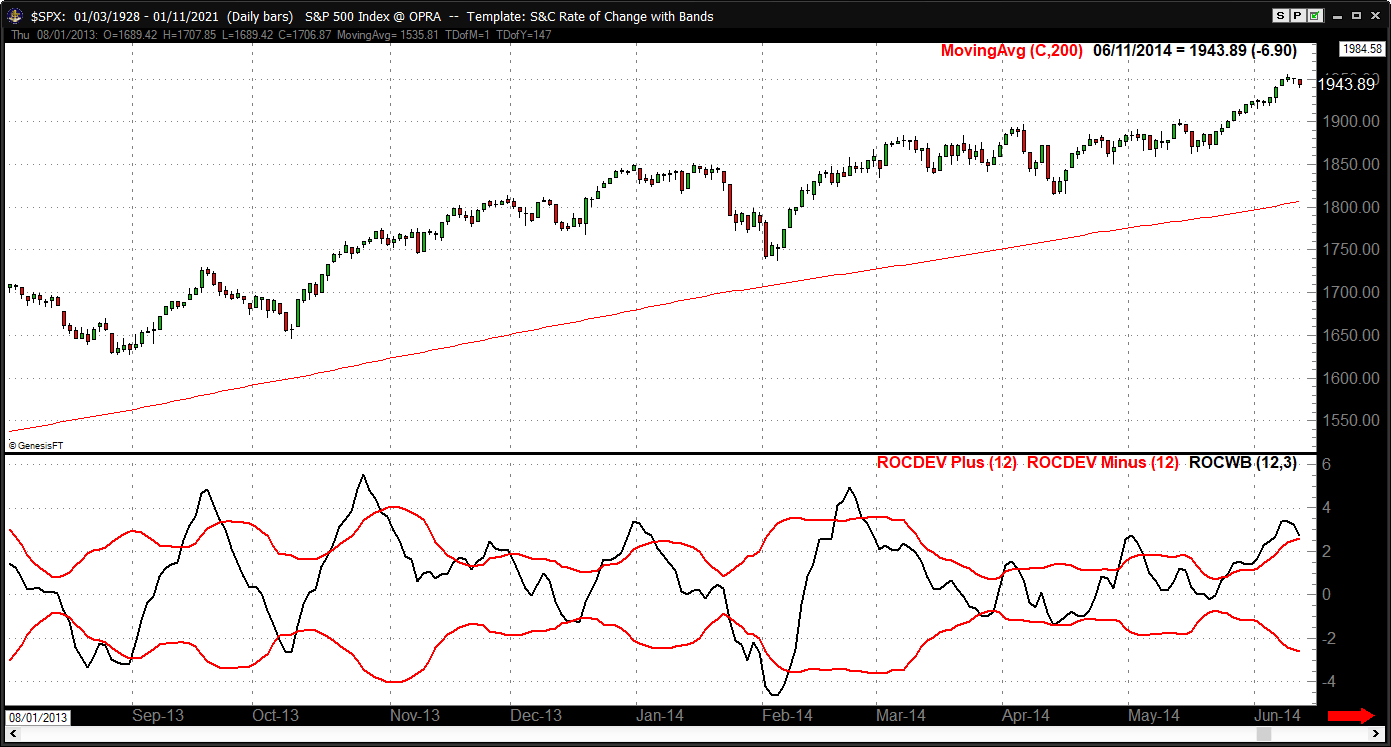
This library contains a template named “S&C Rate of Change with Bands” and the following indicators: ROCWB, ROCDev Minus, and ROCDev Plus. The template allows you to modify your chart with a prebuilt indicator package and settings. To use it, open the charting pulldown menu, select the templates command, then on the submenu that opens, select the “S&C Rate of Change with Bands” template. If you are prompted to save the current chart settings as a template, your answer will depend on whether or not you have made any changes to your current chart template that you would like to keep. If you choose no, these changes will be discarded; a yes choice will save changes into the prior template on your chart before switching to the “S&C Rate of Change with Bands” template.
You can insert these indicators individually onto your chart by opening the charting dropdown menu, selecting the add to chart command, then on the indicators tab, finding your named indicator, selecting it, then clicking on the add button. Repeat this procedure for additional indicators if you wish. A sample chart is shown in Figure 11.

FIGURE 11: TRADE NAVIGATOR. The downloadable library for this article contains a template named “S&C Rate of Change with Bands” and the indicators ROCWB, ROCDev Minus, and ROCDev Plus.
Our technical support staff is available by phone or live chat at our website if assistance is needed. Happy trading!
—Genesis Financial Data
Tech support 719 884-0245
www.TradeNavigator.com
BACK TO LIST
MICROSOFT EXCEL: MARCH 2021
In his article in this issue, “Rate Of Change With Bands,” Vitali Apirine presents a price momentum oscillator with dynamic deviation bands as overbought and oversold levels.
Period 1, 2, and 3 values in the user controls area determine the ROC shape and band configuration.
Band crossovers as ROC retreats from oversold and overbought extremes are locations that the trader may consider as potential buying and selling opportunities, according to the article. Apirine suggests that ROC with bands should be used in conjunction with other indicators when considering taking positions.
In Figure 12 you see the ROC and associated bands for a little over two years on Lockheed Martin.

FIGURE 12: EXCEL. On this example Excel chart, the rate of change with bands is shown.
For the bare ROC indicator, in the more volatile periods, crossovers are easy to see. In quieter times, a bit of zooming-in helps.
In Figure 13 I have added “consideration bars” to highlight ROC retreats from the extremes. This is a busy chart, with more than a few opportunities for whipsaw.

FIGURE 13: EXCEL. ROC with bars highlight retreats from the extremes.
In the article, Apirine suggests a possible filter would be used to only consider ROC opportunities that align with the current price trend. He further suggests that the current close price, compared to a 200-period exponential moving average of the close, could stand proxy for the trend.
Figure 14 filters for consideration bars that align with the trend of price versus a 200-period EMA of the close.

FIGURE 14: EXCEL. Shown here is an example of the trend-filtered consideration bars using a 200-bar EMA of the close.
I found it interesting to play with the filtering EMA bar count. I used numbers as low as 8 and some much higher than 200.
Finally, if you wish to try recreating the author’s charts from the article, you will find a recipe for each figure on the notes tab of this spreadsheet.
To download this spreadsheet: The spreadsheet file for this Traders’ Tip can be downloaded here. To successfully download a working version of this spreadsheet, follow these steps:
- Right-click on the Excel file link, then
- Select “save as” (or “save target as”) to place a copy of the spreadsheet file on your hard drive.
—Ron McAllister
Excel and VBA programmer
rpmac_xltt@sprynet.com
BACK TO LIST
Originally published in the March 2021 issue of
Technical Analysis of STOCKS & COMMODITIES magazine.
All rights reserved. © Copyright 2021, Technical Analysis, Inc.


