TRADERS’ TIPS
May 2021

For this month’s Traders’ Tips, the focus is John F. Ehlers’ article in this issue, “A Technical Description Of Market Data For Traders.” Here, we present the May 2021 Traders’ Tips code with possible implementations in various software.
You can right-click on any chart to open it in a new tab or window and view it at it’s originally supplied size, often much larger than the version printed in the magazine.
The Traders’ Tips section is provided to help the reader implement a selected technique from an article in this issue or another recent issue. The entries here are contributed by software developers or programmers for software that is capable of customization.

TRADESTATION: MAY 2021
In his article in this issue, “A Technical Description Of Market Data For Traders,” John Ehlers introduces the use of AM and FM modulation to determine the volatility and cycles of market data. The author also proposes that noise in market data does not necessarily mean chaos and that pink noise in the data implies memory in the data.
Shown here is EasyLanguage code for a function that calculates the FM demodulator value, an indicator for the AM detector, an indicator for the FM demodulator, and a sample strategy for demonstration purposes.
Function:  _TASC_MAY_2021_FM_Demodulator
// TASC MAY 2021
// A Technical Description Of Market Data For Traders
// John F. Ehlers (C) 2020-2021
// FM Demodulator

inputs:
    Period( numericsimple );

variables:
    Deriv( 0 ),
    HL( 0 ),
    a1( 0 ),
    b1( 0 ),
    c1( 0 ),
    c2( 0 ),
    c3( 0 ),
    SS( 0 );

{
derivative to establish zero mean (basically the
same as Close - Close[1], but removes intraday gap
openings)
}
Deriv = Close - Open;

// hard limiter to remove AM noise
HL = 10 * Deriv;
if HL > 1 then
    HL = 1;

if HL < -1 then
    HL = -1;

// integrate with a SuperSmoother
a1 = ExpValue( -1.414 * 3.14159 / Period );
b1 = 2 * a1 * Cosine( 1.414 * 180 / Period );
c2 = b1;
c3 = -a1 * a1;
c1 = 1 - c2 - c3;
SS = c1 * ( HL + HL[1] ) /2 + c2 * SS[1] + c3 * SS[2];

if CurrentBar < 3 then
    SS = Deriv;

_TASC_MAY_2021_FM_Demodultor = SS;

Indicator:  TASC MAY 2021 FM Demodulator
// TASC MAY 2021
// A Technical Description Of Market Data For Traders
// John F. Ehlers (C) 2020-2021
// FM Demodulator

inputs:
    Period( 30 );

variables:
    SS( 0 );

SS = _TASC_MAY_2021_FM_Demodultor( Period );

Plot1( SS );
Plot2( 0 );

Indicator: TASC MAY 2021 AM Detector
// TASC MAY 2021
// A Technical Description Of Market Data For Traders
// John F. Ehlers (C) 2020-2021
// AM Detector

variables:
    Deriv( 0 ),
    Envel( 0 ),
    Volatil( 0 );

Deriv = Close - Open;
Envel = Highest( AbsValue( Deriv ), 4 );
Volatil = Average( Envel, 8 );

Plot1( Volatil );
Plot2( 0 );


Strategy:  TASC MAY 2021 Strategy
// TASC MAY 2021
// A Technical Description Of Market Data For Traders
// John F. Ehlers (C) 2020-2021
// FM Demodulator

// sample strategy for illustrative purposes only

[IntrabarOrderGeneration=false]

inputs:
    Period( 30 );

variables:
    SS( 0 );

SS = _TASC_MAY_2021_FM_Demodultor( Period );

if SS crosses above 0 then
    Buy ( "LE FM Mod" ) next bar market
else if SS crosses below 0 then
    SellShort ( "SE FM Mod" ) next bar market;
To download the EasyLanguage code for TradeStation 10, please visit our TradeStation and EasyLanguage support forum. The files for this article can be found here: https://community.tradestation.com/discussions/Topic.aspx?Topic_ID=190289.
A sample chart is shown in Figure 1.
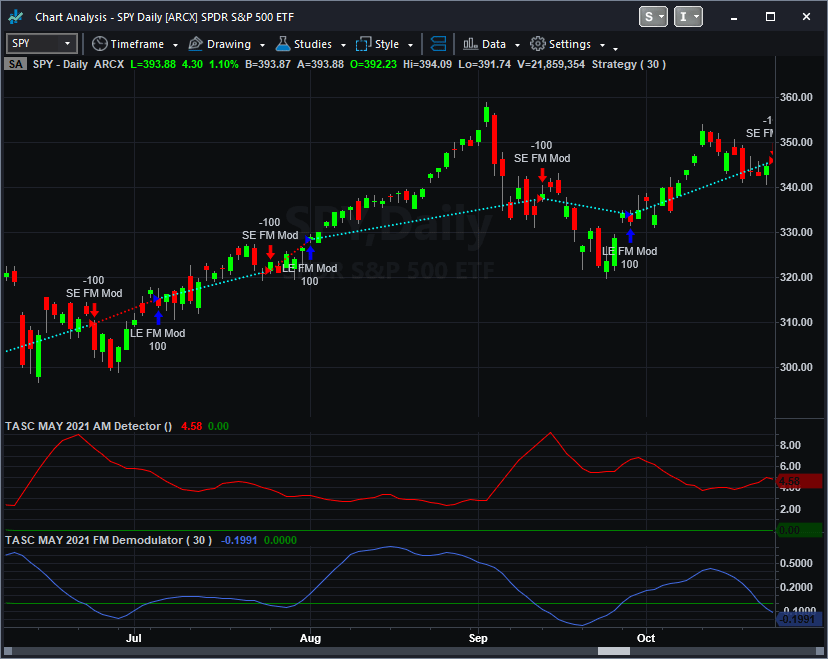
FIGURE 1: TRADESTATION. On this TradeStation daily chart of SPY, the indicators are applied in the subgraph, and the strategy is inserted.
This article is for informational purposes. No type of trading or investment recommendation, advice, or strategy is being made, given, or in any manner provided by TradeStation Securities or its affiliates.
—Chris Imhof
TradeStation Securities, Inc.
www.TradeStation.com
BACK TO LIST

THINKORSWIM: MAY 2021
We have put together a pair of studies based on the article in this issue by John Ehlers, “A Technical Description Of Market Data For Traders.” We built the studies referenced by using our proprietary scripting language, thinkscript. To ease the loading process, simply click on https://tos.mx/9mLcPM9 or enter it into the address into setup→open shared item from within thinkorswim then choose view thinkScript study and name it “AM Detector” or whatever you like and can identify. Do the same with https://tos.mx/vOxBTfM and name it “FM Demodulator.” Then you can then add the studies to your charts from the edit studies menu from within the chartstab.
Figure 2 shows the pair of studies on a two-year, one-day chart of SPY. Please see John Ehlers’ article for more information on how these studies are to be utilized.
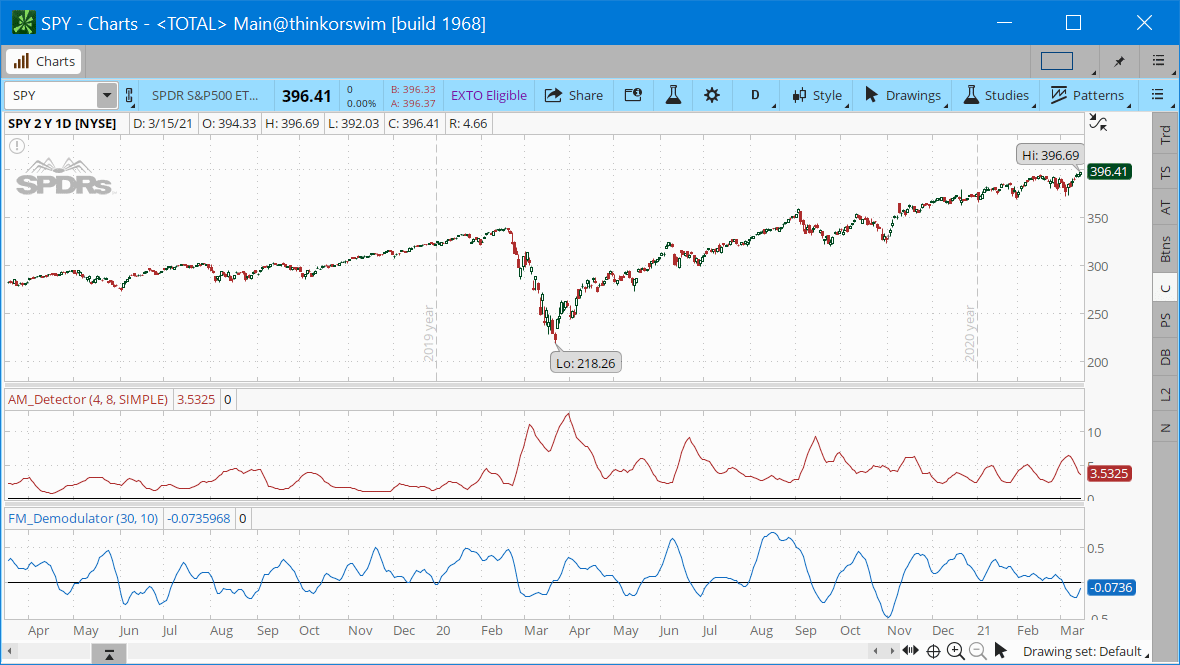
FIGURE 2: THINKORSWIM. The pair of studies are shown on a two-year, one-day chart of SPY.
—thinkorswim
A division of TD Ameritrade, Inc.
www.thinkorswim.com
BACK TO LIST

WEALTH-LAB.COM: MAY 2021
In “A Technical Description Of Market Data For Traders” in this issue, John Ehlers discusses cycle components of market data and presents a way to detect and demodulate the AM and FM components of cycles. According to the author, peaks and valleys of the FM demodulator indicator that he presents in the article can be correlated with major swings of the price. The FM demodulator indicator (FMD) ranges from -1.0 to 1.0. To see if it’s accurate for market timing, we added an overlay of peaks and values based on its reversals of 0.25 points and more. You can see it as a red zigzag line on the indicator’s pane in Figure 3.
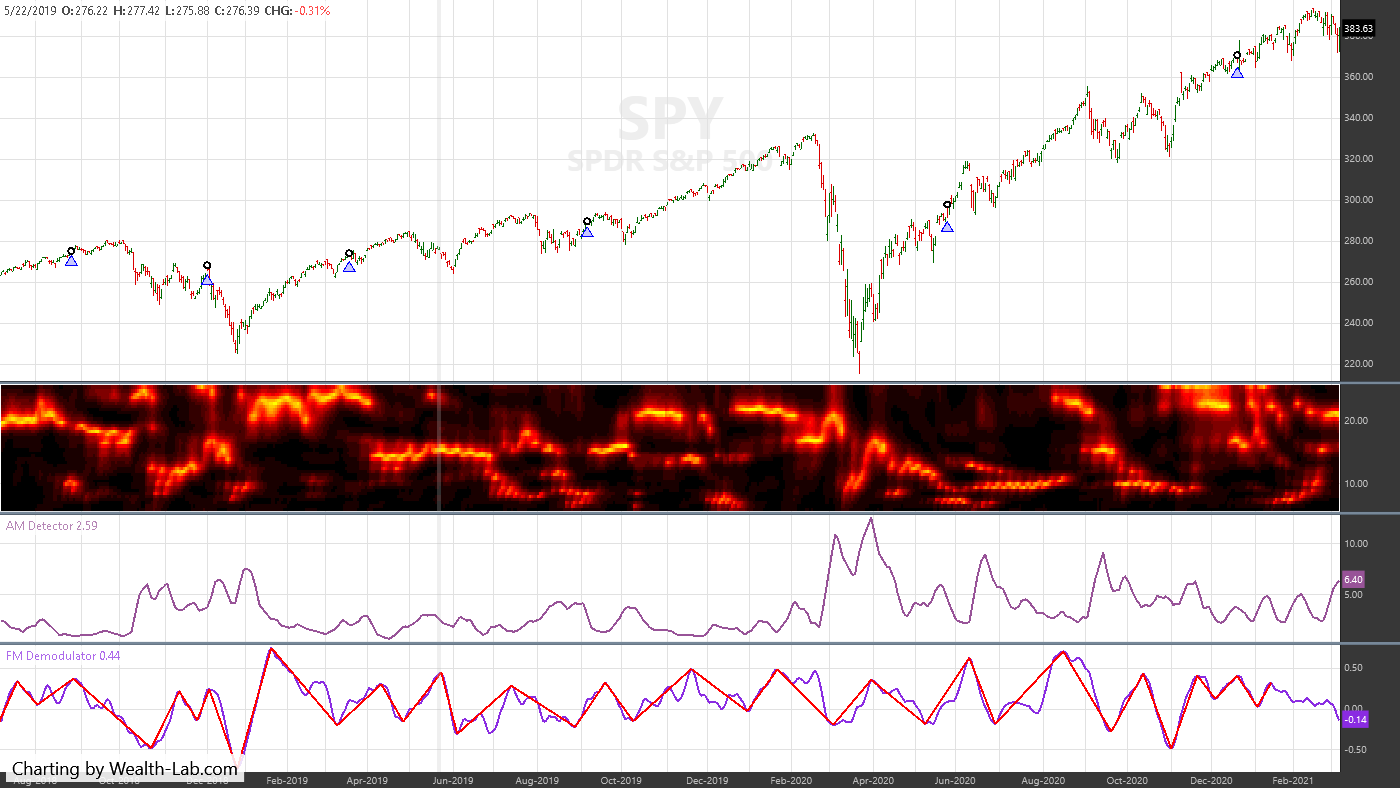
FIGURE 3: WEALTH-LAB. In this example Wealth-Lab chart, the new indicator is accompanied by John Ehlers’ dominant cycle plot. Sample trades on a chart of SPY are taken at higher troughs.
There is a natural delay in the detection of peaks and troughs, as we need to wait while the indicator has moved by a certain amount. The example system buys as soon as a new higher trough has been confirmed. All entries are marked with bluish triangles on the price chart.
The code is available for copying & pasting here:
using System;
using WealthLab.Indicators;
using System.Collections;
using System.Drawing;
using WealthLab.Backtest;
using WealthLab.Core;
using WealthLab.TASC;

namespace WealthScript1
{
    public class May2021 : UserStrategyBase
    {
        public May2021() : base()
        {
            AddParameter("Reversal", ParameterTypes.Double, 0.25, 0.25, 1.0, 0.25);
        }

        public override void Initialize(BarHistory bars)
        {
            reversal = Parameters[0].AsDouble;
            fmd = FMDemodulator.Series(bars, 30);
            amd = AMDetector.Series(bars, 4, 8);
            ptc = new PeakTroughCalculator( fmd, reversal, PeakTroughReversalTypes.Point);

            PlotTimeSeries( fmd, "FM Demodulator", "FMD", Color.BlueViolet);
            PlotTimeSeries( amd, "AM Detector", "AMD", Color.Violet);
            RenderPeakTroughs(ptc, Color.Red, "FMD");

            /* Dominant Cycle */
            TimeSeries dc;
            DominantCycle(bars, bars.AveragePriceHL, out dc);
        }

        /* execute the strategy rules here, this is executed once for each bar in the backtest history*/
        public override void Execute(BarHistory bars, int idx)
        {
            if (ptc.TroughState(idx) == 1 && ptc.TroughState(idx - 1) != 1)
            {
                PlaceTrade( bars, TransactionType.Buy, OrderType.Market);
            }
        }

        /* render peaks and troughs in a pane */
        private void RenderPeakTroughs(PeakTroughCalculator ptc, Color color, string paneTag)
        {
            if (ptc.PeakTroughs.Count < 2)
                return;

            for (int n = 1; n < ptc.PeakTroughs.Count; n++)
            {
                int x1 = ptc.PeakTroughs[n - 1].PeakTroughIndex;
                double y1 = ptc.PeakTroughs[n - 1].Value;
                int x2 = ptc.PeakTroughs[n].PeakTroughIndex;
                double y2 = ptc.PeakTroughs[n].Value;
                DrawLine( x1, y1, x2, y2, Color.Red, 2, LineStyles.Solid, paneTag);
            }
        }

        FMDemodulator fmd;
        AMDetector amd;
        PeakTroughCalculator ptc;
        double reversal;
        const double twoPi = 2 * Math.PI;
        const double fourPi = 4 * Math.PI;

        public class ArrayHolder
        {   /* current, old, older */
            internal double I, I2, I3;
            internal double Q, Q2, Q3;
            internal double R, R2, R3;
            internal double Im, Im2, Im3;
            internal double A;
            internal double dB, dB2;
        }

        public void DominantCycle(BarHistory bars, TimeSeries ds, out TimeSeries domCycMdn)
        {
            /* Initialize arrays */
            ArrayHolder[] ah = new ArrayHolder[52];
            for (int n = 12; n < 52; n++)
                ah[n] = new ArrayHolder();

            double domCycle = 0d;
            string s = ds.Description + ")";
            TimeSeries[] DB = new TimeSeries[52];
            TimeSeries domCyc = new TimeSeries(ds.DateTimes, 0); domCyc.Description = "DC(" + s;
            domCycMdn = new TimeSeries(ds.DateTimes, 0); domCycMdn.Description = "DomCyc(" + s;

            /* Create and plot the decibel series - change the colors later */
            for ( int n = 12; n < 52; n++)
            {
                double d = n / 2.0;
                DB[n] = domCyc + d;
                DB[n].Description = "Cycle." + d.ToString();
                PlotTimeSeriesLine( DB[n], "", "dbPane", Color.Black, 4, LineStyles.Solid, true);
            }

            /* Convert decibels to RGB color for display */
            Color[] color = new Color[21];
            for (int n = 0; n <= 10; n++)       /* yellow to red: 0 to 10 dB */
                color[n] = Color.FromArgb(255, (int)(255 - (255 * n / 10)), 0);
            for (int n = 11; n <= 20; n++)      /* red to black: 11 to 20 db */
                color[n] = Color.FromArgb((int)(255 * (20 - n) / 10), 0, 0);

            /* Detrend data by High Pass Filtering with a 40 Period cutoff */
            TimeSeries HP = domCyc;
            double alpha = (1 - Math.Sin(twoPi / 30)) / Math.Cos(twoPi / 30);
            for (int bar = 1; bar < ds.Count; bar++)
                HP[bar] = 0.5 * (1 + alpha) * Momentum.Series(ds, 1)[bar] + alpha * HP[bar - 1];
            FIRSmoother smoothHP = new FIRSmoother(HP);  //FIR.Series(HP, "1,2,3,3,2,1");

            ArrayList fifoList = new ArrayList(51);
            ArrayList fifoPsn = new ArrayList(21);

            for (int bar = 51; bar < ds.Count; bar++)
            {
                double maxAmpl = 0d;
                double delta = -0.015 * bar + 0.5;
                delta = delta < 0.1 ? 0.1 : delta;
                for (int n = 12; n < 52; n++)
                {
                    double beta = Math.Cos(fourPi / n);
                    double g = 1 / Math.Cos(2 * fourPi * delta / n);
                    double a = g - Math.Sqrt(g * g - 1);
                    ah[n].Q = Momentum.Series(smoothHP, 1)[bar] * n / fourPi;
                    ah[n].I = smoothHP[bar];
                    ah[n].R = 0.5 * (1 - a) * (ah[n].I - ah[n].I3) + beta * (1 + a) * ah[n].R2 - a * ah[n].R3;
                    ah[n].Im = 0.5 * (1 - a) * (ah[n].Q - ah[n].Q3) + beta * (1 + a) * ah[n].Im2 - a * ah[n].Im3;
                    ah[n].A = ah[n].R * ah[n].R + ah[n].Im * ah[n].Im;
                    maxAmpl = ah[n].A > maxAmpl ? ah[n].A : maxAmpl;
                }

                double num = 0; double den = 0;
                for (int n = 12; n < 52; n++)
                {
                    ah[n].I3 = ah[n].I2;
                    ah[n].I2 = ah[n].I;
                    ah[n].Q3 = ah[n].Q2;
                    ah[n].Q2 = ah[n].Q;
                    ah[n].R3 = ah[n].R2;
                    ah[n].R2 = ah[n].R;
                    ah[n].Im3 = ah[n].Im2;
                    ah[n].Im2 = ah[n].Im;
                    ah[n].dB2 = ah[n].dB;

                    if (maxAmpl != 0 && ah[n].A / maxAmpl > 0)
                        ah[n].dB = 10 * Math.Log10((1 - 0.99 * ah[n].A / maxAmpl) / 0.01);
                    ah[n].dB = 0.33 * ah[n].dB + 0.67 * ah[n].dB2;
                    ah[n].dB = ah[n].dB > 20 ? 20 : ah[n].dB;
                    SetSeriesBarColor( DB[n], bar, color[(int)Math.Round(ah[n].dB)]);

                    if (ah[n].dB <= 6)
                    {
                        num += n * (20 - ah[n].dB);
                        den += (20 - ah[n].dB);
                    }
                    if (den != 0) domCycle = 0.5 * num / den;
                }
                domCycMdn[bar] = Median.Value(bar, domCyc, 5);
                domCycMdn[bar] = domCycle < 6 ? 6 : domCycle;
            }
        }
    }
}
—Gene Geren (Eugene)
Wealth-Lab team
www.wealth-lab.com
BACK TO LIST

NINJATRADER: MAY 2021
The AMDetector and FMDemodulator indicators, as discussed in John Ehlers’ article in this issue, “A Technical Description Of Market Data For Traders,” are available for download at the following links for NinjaTrader 8 and for NinjaTrader 7:
Once the file is downloaded, you can import the indicator into NinjaTader 8 from within the control Center by selecting Tools → Import → NinjaScript Add-On and then selecting the downloaded file for NinjaTrader 8. To import in NinjaTrader 7 from within the control center window, select the menu File → Utilities → Import NinjaScript and select the downloaded file.
You can review the indicator’s source code in NinjaTrader 8 by selecting the menu New → NinjaScript Editor → Indicators from within the control center window and selecting the AMDetector or FMDemodulator file. You can review the indicator’s source code in NinjaTrader 7 by selecting the menu Tools → Edit NinjaScript → Indicator from within the control center window and selecting the AMDetector or FMDemodulator file.
NinjaScript uses compiled DLLs that run native, not interpreted, to provide the highest performance possible.
A sample chart displaying the indicators is shown in Figure 4.
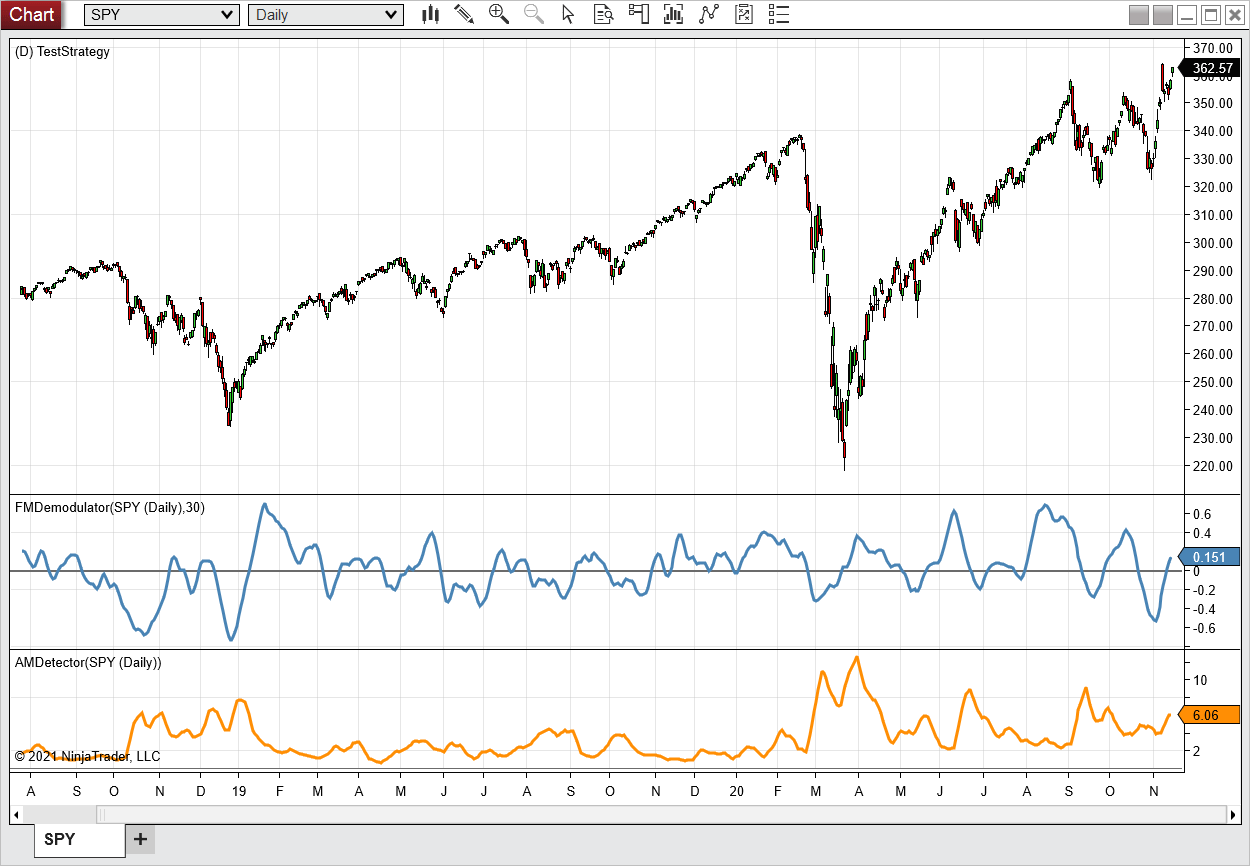
FIGURE 4: NINJATRADER. On this example daily chart of the SPDR S&P 500 ETF (SPY), the FMDemodulator is shown in the middle pane and the AMDetector is shown in the bottom pane from August 2018 to November 2020.
—Brandon Haulk
NinjaTrader, LLC
www.ninjatrader.com
BACK TO LIST

NEUROSHELL TRADER: MAY 2021
The AM detector and FM demodulator indicators introduced in John Ehlers’ article in this issue, “A Technical Description Of Market Data For Traders,” can be easily implemented by combining a few of NeuroShell Trader’s 800+ indicators and using NeuroShell Trader’s ability to call external dynamic linked libraries.
Ehlers’ SuperSmoother used in the article can be implemented using NeuroShell Trader’s ability to call external dynamic linked libraries. Dynamic linked libraries can be written in C, C++ and Power Basic. After moving the SuperSmoother code given in the article to your preferred compiler and creating a DLL, you can insert the resulting indicator as follows:
- Select “New indicator” from the insert menu
- Choose the external program & library calls category
- Select the appropriate external DLL call indicator
- Set up the parameters to match your DLL
- Select the finished button
Once the SuperSmoother indicator has been created, the AM detector and FM demodulator indicators are created by simply selecting new indicator from the insert menu and using the indicator wizard to create the following indicators:
    AM	Avg( Max ( Abs( Sub(Close, Open) ), 4 ), 8 )
    FM	SuperSmoother ( Max2 ( -1, Min2( Mult2( 10, Sub(Close, Open) ), 1 ) ), 30
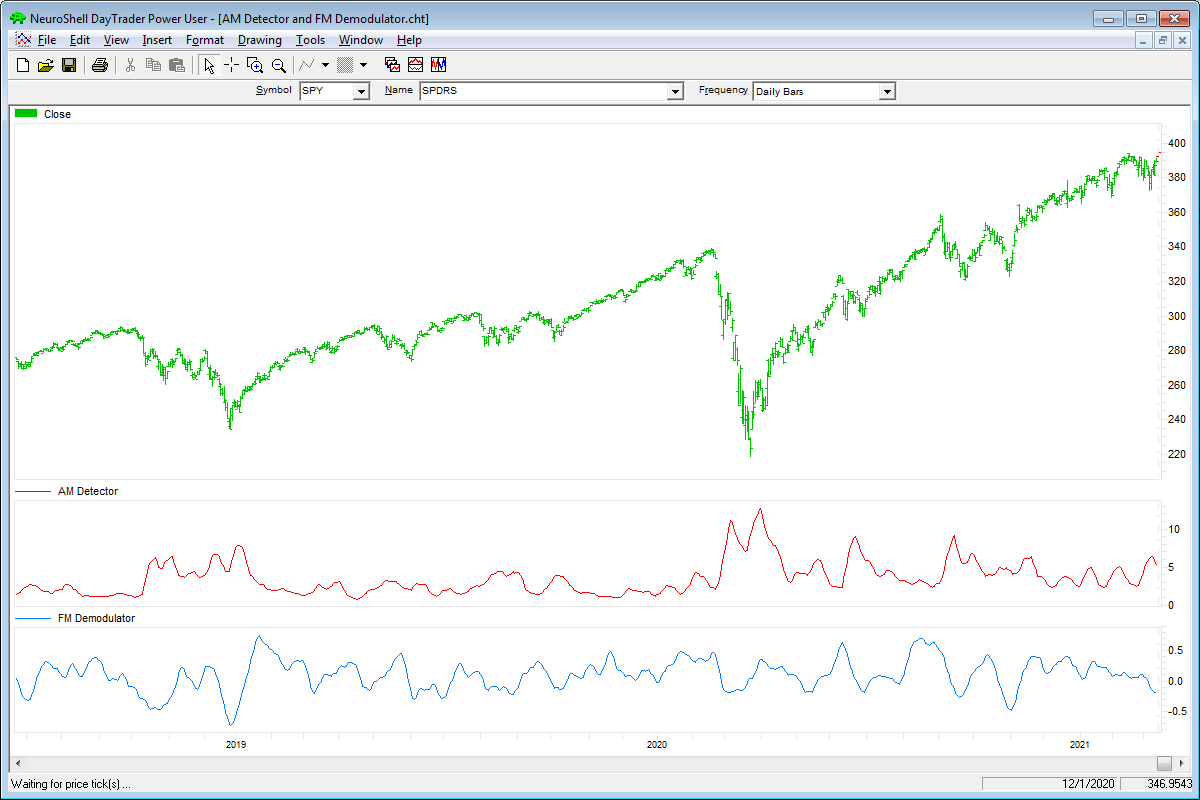
FIGURE 5: NEUROSHELL TRADER. This NeuroShell Trader chart shows the AM detector and FM demodulator indicators on a daily SPY chart.
Users of NeuroShell Trader can go to the Stocks & Commodities section of the NeuroShell Trader free technical support website to download a copy of this or any previous Traders’ Tips.
—Marge Sherald, Ward Systems Group, Inc.
301 662-7950, sales@wardsystems.com
www.neuroshell.com
BACK TO LIST

OPTUMA: MAY 2021
Here are the formulas for Optuma for implementing the two indicators presented in John Ehlers’ article in this issue, “A Technical Description Of Market Data For Traders.”
Ehlers’s SuperSmoother, which is used in the creation of the indicators, is available as a standard tool in Optuma, making the FM demodulator a bit easier to create.
AM Detector
Deriv = ABS(CLOSE() - OPEN());
Envel = HIGHESTHIGH(Deriv, BARS=4);
MA(Envel, BARS=8, CALC=Close)

FM Demodulator
Deriv = 10*(CLOSE() - OPEN());
// calculate the hard limit
HL =  IF(Deriv>1, 1, IF(Deriv<-1, -1, Deriv));
// output using the Ehlers SuperSmoother function
EHLSS(HL, PERIOD=30)
An example chart displaying the indicators is shown in Figure 6. Figure 7 provides an example of the FM demodulator when it is negative, as indicated by the shading.
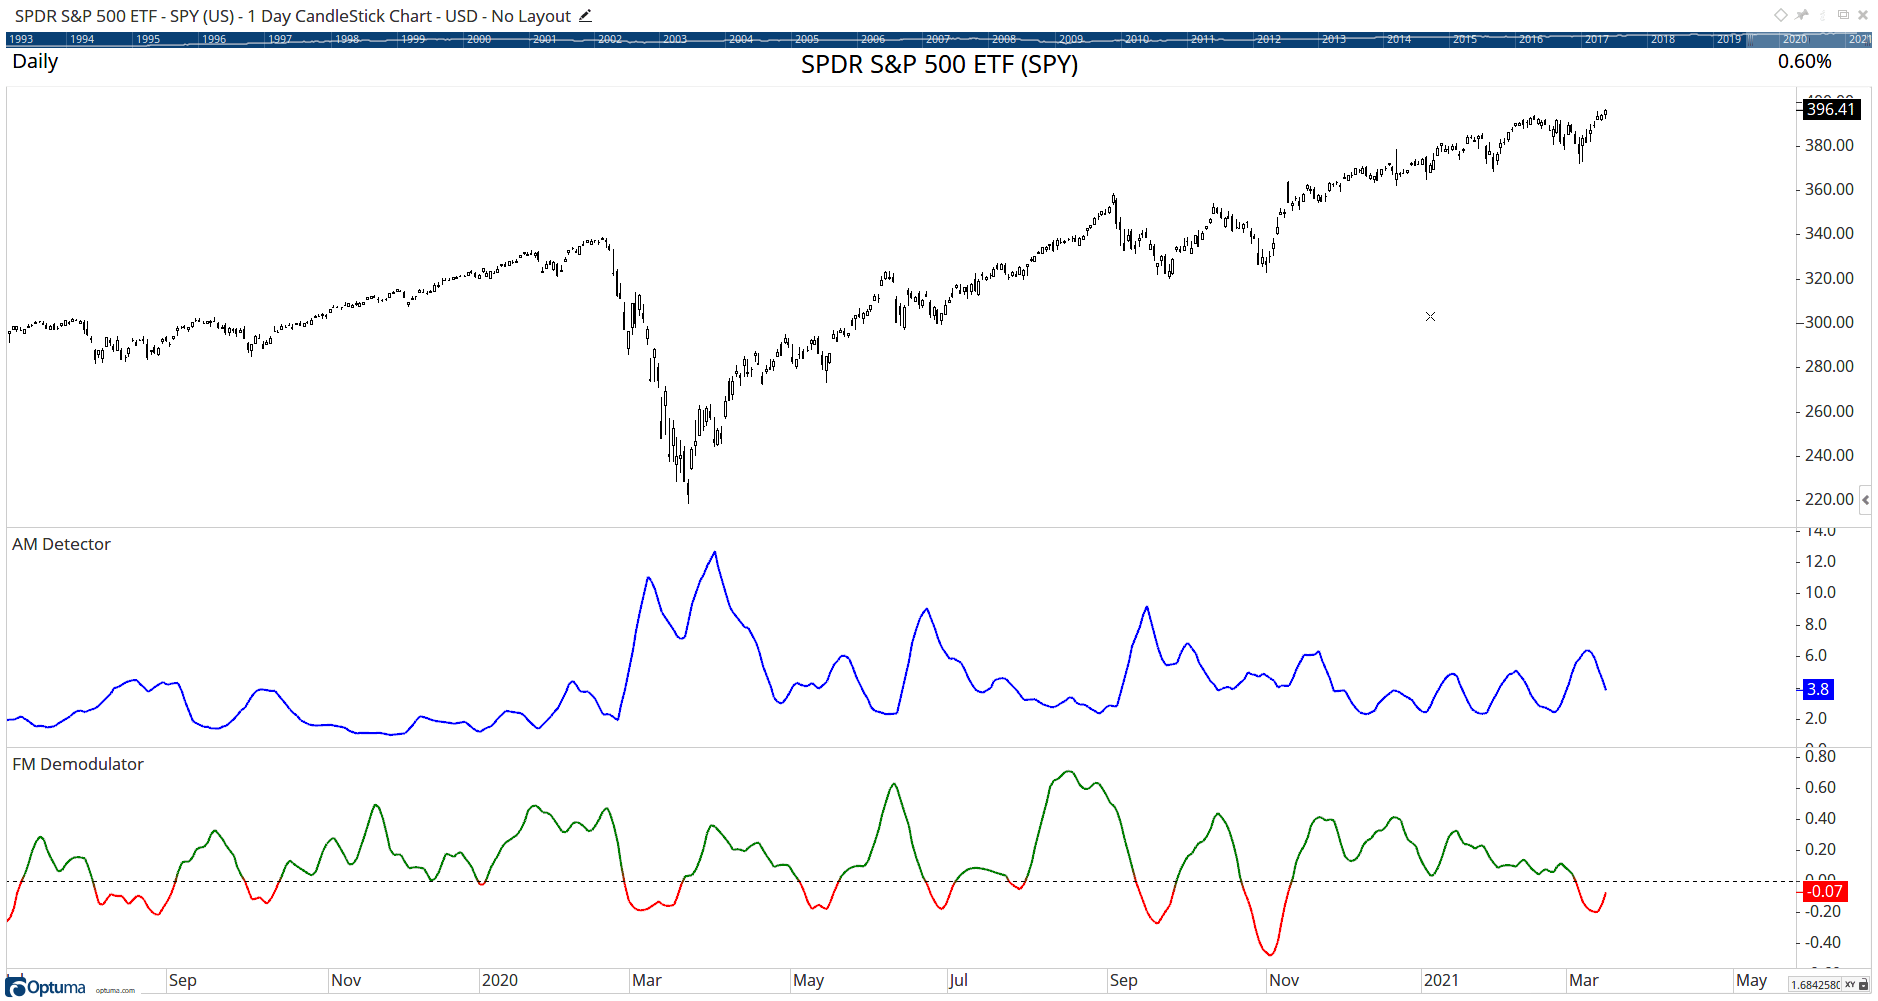
FIGURE 6: OPTUMA. This sample chart displays John Ehlers’ AM detector and FM demodulator indicators.
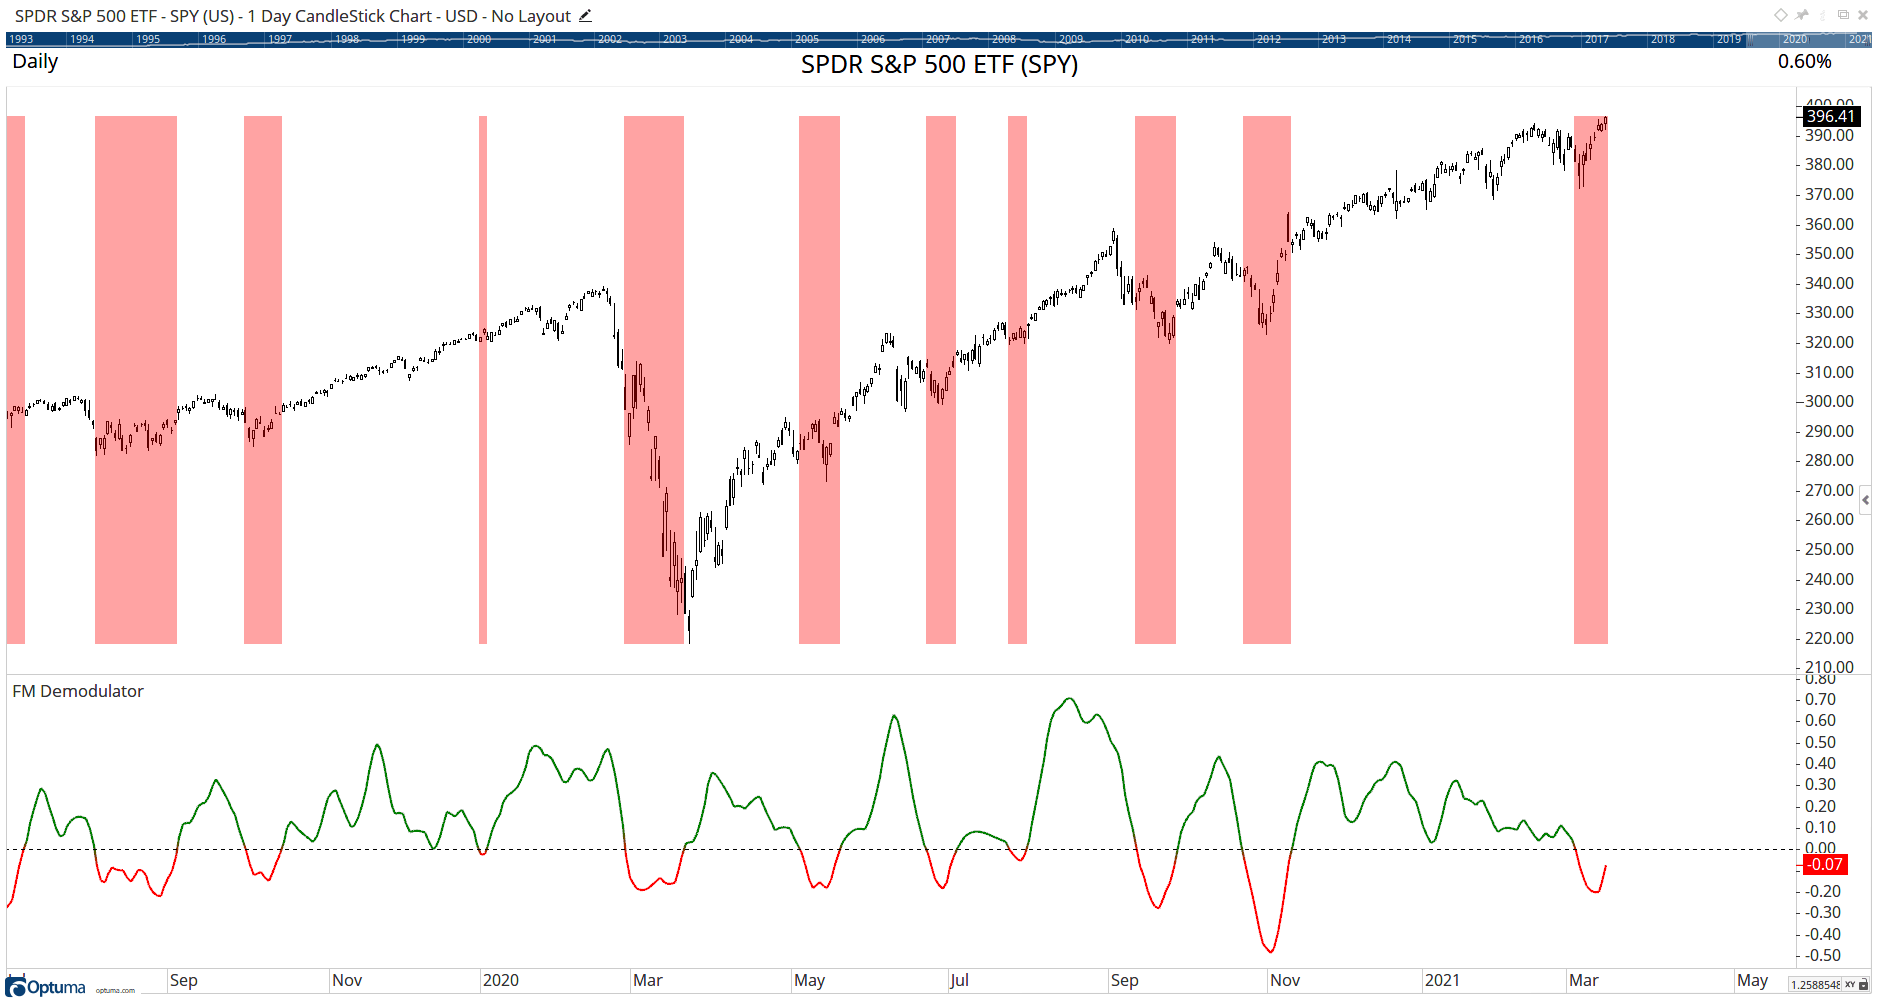
FIGURE 7: OPTUMA. This sample chart provides an example of the FM demodulator when it is negative, as indicated by the shading.
—support@optuma.com
BACK TO LIST

THE ZORRO PROJECT: MAY 2021
Price curves consist of much noise and little signal. For separating the latter from the former, John Ehlers proposes in his article in this issue, “A Technical Description Of Market Data For Traders,” an unusual approach: Treat the price curve like a radio wave and apply AM and FM demodulating technology.
A very simple AM radio is just an antenna, a rectifier, and a capacitor. In programming, a rectifier produces the absolute value and a capacitor produces the envelope of a wave. For the envelope, we’re using the maximum of the last four values and we’re smoothing it with a moving average. Here is the indicator equivalent of an AM radio in C for Zorro:
var AM(var Signal, int Period)
{
  var Envelope = MaxVal(series(abs(Signal)),4);
  return SMA(series(Envelope),Period);
}
For making an FM radio, we take a frequency signal with constant amplitude that we then integrate with a lowpass filter. We will clamp the amplitude to +/-1 and integrate with Ehlers’ SuperSmoother, which fortunately already exists in Zorro’s indicator library. The code:
var FM(var Signal, int Period)
{
  var HL = clamp(10*Signal,-1,1);
  return Smooth(series(HL),Period);
}
Ehlers uses the derivative of the price curve for the signal. The derivative is equivalent to the daily price change. We can now write the script for reproducing Ehlers’ FM and AM charts of the SPY price curve:
void run()
{
   BarPeriod = 1440;
   StartDate = 20180701;
   EndDate = 20201201;

   assetAdd("SPY","STOOQ:*"); // load price history from Stooq
   asset("SPY");

   var Deriv = priceClose()-priceOpen();
   plot("Deriv",Deriv,NEW,BLACK);
   plot("AM",AM(Deriv,8),NEW,RED);
   plot("FM",FM(Deriv,30),NEW,BLUE);
}
The resulting chart shows the derivative and the AM (red) and FM (blue) decoded signals (Figure 8).
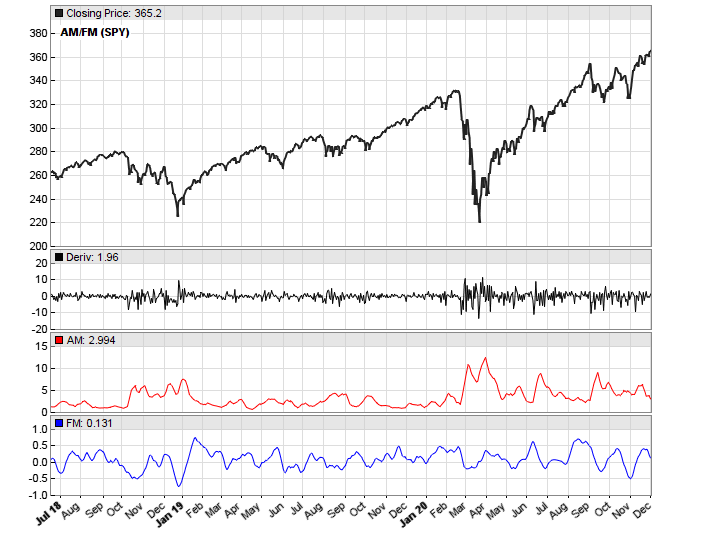
FIGURE 8: ZORRO PROJECT. The example chart shows the derivative and the AM (red) and FM (blue) decoded signals on the SPY.
We see in the chart that the AM signal is a proxy of volatility and the FM signal measures the rate of price variations. Maybe Ehlers will show in a future article how to use that in a trading system?
The AM and FM indicators and the script can be downloaded from the 2021 script repository on https://financial-hacker.com. The Zorro platform can be downloaded from https://zorro-project.com.
—Petra Volkova
The Zorro Project by oP group Germany
www.zorro-project.com
BACK TO LIST

eSIGNAL: MAY 2021
For this month’s Traders’ Tip, we’ve provided the FM Demodulator Indicator.efs study and AM Detector.efs based on the article by John Ehlers, “A Technical Description Of Market Data For Traders.” The studies help in creating more accurate cycle-based indicators.
The studies contain formula parameters that may be configured through the edit chart window (right-click on the chart and select “edit chart”). A sample chart is shown in Figure 9.
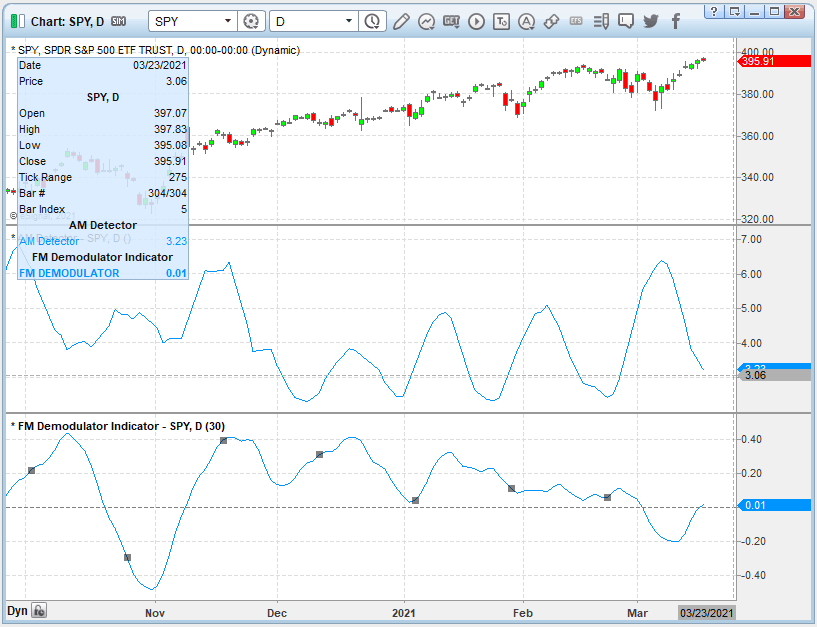
FIGURE 9: eSIGNAL. Here is an example of the study plotted on a daily chart of SPY.
To discuss this study or download a complete copy of the formula code, please visit the EFS Library Discussion Board forum under the forums link from the support menu at www.esignal.com or visit our EFS KnowledgeBase at https://www.esignal.com/support/kb/efs. The eSignal formula scripts (EFS) are also available for copying & pasting here:
/**********************************
Provided By:
Copyright 2019 Intercontinental Exchange, Inc. All Rights Reserved.
eSignal is a service mark and/or a registered service mark of Intercontinental Exchange, Inc.
in the United States and/or other countries. This sample eSignal Formula Script (EFS)
is for educational purposes only.
Intercontinental Exchange, Inc. reserves the right to modify and overwrite this EFS file with each new release.

Description:
    A Technical Description Of Market Data For Traders
    FM DEMODULATOR
    by John F. Ehlers


Version:            1.00  03/12/2021

Formula Parameters:                    Default:
Period                                 30


Notes:
The related article is copyrighted material. If you are not a subscriber
of Stocks & Commodities, please visit www.traders.com.

**********************************/
var fpArray = new Array();
var bInit = false;

function preMain() {
    setStudyTitle("FM Demodulator Indicator");
    setCursorLabelName("FM DEMODULATOR", 0);
    setPriceStudy(false);
    setDefaultBarFgColor(Color.RGB(0x00,0x94,0xFF), 0);
    setPlotType( PLOTTYPE_LINE , 0 );

    var x=0;
    fpArray[x] = new FunctionParameter("Period", FunctionParameter.NUMBER);
	with(fpArray[x++]){
        setLowerLimit(1);
        setDefault(30);
    }
}

var bVersion = null;
var xClose = null;
var xOpen = null;
var xDeriv = null;
var xHL = null;
var a1 = null;
var b1 = null;
var c1 = null;
var c2 = null;
var c3 = null;
var SS = null;
var SS_1 = null;
var SS_2 = null;


function main(Period) {
    if (bVersion == null) bVersion = verify();
    if (bVersion == false) return;

    if ( bInit == false ) {
        xClose = close();
        xOpen = open();
        xDeriv = efsInternal("Calc_Deriv", xClose, xOpen);
        addBand( 0, PS_DASH, 1, Color.grey);
        xHL = efsInternal("Calc_HL", xDeriv);
        a1 = Math.exp(-1.414 * Math.PI / Period);
        b1 = 2 * a1 * Math.cos(1.414 * Math.PI / Period);
        c2 = b1;
        c3 = -a1 * a1;
        c1 = 1 - c2 - c3;
        SS = 0;
        SS_1 = 0;
        SS_2 = 0;

        bInit = true;
    }
    if (getCurrentBarCount() < Period - 3) return;
    if (getBarState() == BARSTATE_NEWBAR) {
        SS_2 = SS_1;
        SS_1 = SS;
    }

    SS = c1 * (xHL.getValue(0) + xHL.getValue(1)) / 2 + c2 * SS_1 + c3 * SS_2;
    if (getCurrentBarCount() < 3) SS = xDeriv.getValue(0);

    return SS;
}


function Calc_HL(xDeriv){
    var ret = 0;
    ret = 10 * xDeriv.getValue(0);
    if (ret > 1) ret = 1
    if (ret < -1) ret = -1;
    return ret;
}

function Calc_Deriv(xClose, xOpen){
    var ret = 0;
    ret = xClose.getValue(0) - xOpen.getValue(0);
    return ret;
}

function verify(){
    var b = false;
    if (getBuildNumber() < 779){

        drawTextAbsolute(5, 35, "This study requires version 10.6 or later.",
            Color.white, Color.blue, Text.RELATIVETOBOTTOM|Text.RELATIVETOLEFT|Text.BOLD|Text.LEFT,
            null, 13, "error");
        drawTextAbsolute(5, 20, "Click HERE to upgrade.@URL=https://www.esignal.com/download/default.asp",
            Color.white, Color.blue, Text.RELATIVETOBOTTOM|Text.RELATIVETOLEFT|Text.BOLD|Text.LEFT,
            null, 13, "upgrade");
        return b;
    }
    else
        b = true;

    return b;
}
/**********************************
Provided By:
Copyright 2019 Intercontinental Exchange, Inc. All Rights Reserved.
eSignal is a service mark and/or a registered service mark of Intercontinental Exchange, Inc.
in the United States and/or other countries. This sample eSignal Formula Script (EFS)
is for educational purposes only.
Intercontinental Exchange, Inc. reserves the right to modify and overwrite this EFS file with each new release.

Description:
    A Technical Description Of Market Data For Traders
    AM Detector
    by John F. Ehlers


Version:            1.00  03/12/2021


Notes:
The related article is copyrighted material. If you are not a subscriber
of Stocks & Commodities, please visit www.traders.com.

**********************************/
var fpArray = new Array();
var bInit = false;

function preMain() {
    setStudyTitle("AM Detector");
    setCursorLabelName("AM Detector", 0);
    setPriceStudy(false);
    setDefaultBarFgColor(Color.RGB(0x00,0x94,0xFF), 0);
    setPlotType( PLOTTYPE_LINE , 0 );
}

var bVersion = null;
var xClose = null;
var xOpen = null;
var xDeriv = null;
var xAbsDeriv = null;
var xEnvel = null;
var xVolatil = null;

function main(Period) {
    if (bVersion == null) bVersion = verify();
    if (bVersion == false) return;

    if ( bInit == false ) {
        xClose = close();
        xOpen = open();
        xDeriv = efsInternal("Calc_Deriv", xClose, xOpen);
        xAbsDeriv = efsInternal("Calc_AbsDeriv", xDeriv);
        xEnvel = efsInternal("Calc_Envel", xAbsDeriv);
        xVolatil = sma(8, xEnvel);
        addBand( 0, PS_DASH, 1, Color.grey);

        bInit = true;
    }

    if (getCurrentBarCount() < 8) return;
    return xVolatil.getValue(0);
}

function Calc_Envel(xAbsDeriv){
    var ret = 0;
    ret = highest(4, xAbsDeriv);
    return ret;
}

function Calc_AbsDeriv(xDeriv){
    var ret = 0;
    ret = Math.abs(xDeriv.getValue(0));
    return ret;
}

function Calc_Deriv(xClose, xOpen){
    var ret = 0;
    ret = xClose.getValue(0) - xOpen.getValue(0);
    return ret;
}

function verify(){
    var b = false;
    if (getBuildNumber() < 779){

        drawTextAbsolute(5, 35, "This study requires version 10.6 or later.",
            Color.white, Color.blue, Text.RELATIVETOBOTTOM|Text.RELATIVETOLEFT|Text.BOLD|Text.LEFT,
            null, 13, "error");
        drawTextAbsolute(5, 20, "Click HERE to upgrade.@URL=https://www.esignal.com/download/default.asp",
            Color.white, Color.blue, Text.RELATIVETOBOTTOM|Text.RELATIVETOLEFT|Text.BOLD|Text.LEFT,
            null, 13, "upgrade");
        return b;
    }
    else
        b = true;

    return b;
}
—Eric Lippert
eSignal, an Interactive Data company
800 779-6555, www.eSignal.com
BACK TO LIST

AIQ: MAY 2021
The AIQ EDS file for John Ehlers’ article, “Technical Description of Market Data for Traders,” can be obtained on request via email to info@TradersEdgeSystems.com. The code is also shown here:
! Technical Description of Market Data for Traders
! Author: John F. Ehlers, TASC May 2021
! Coded by: Richard Denning 3/17/2021

! AM Detector Indicator
! (C) 2020-2021   John F. Ehlers

!FORMULAS:

Deriv is [Close] - [Open].
Envel is Highresult(Abs(Deriv), 4).
Volatil is Simpleavg(Envel, 8).
Code for the AM indicator is set up in the AIQ EDS code file. Figure 10 shows the AM indicator on a chart of S&P 500 SPDR TR (SPY). I was unable to get the FM indicator to work in AIQ.
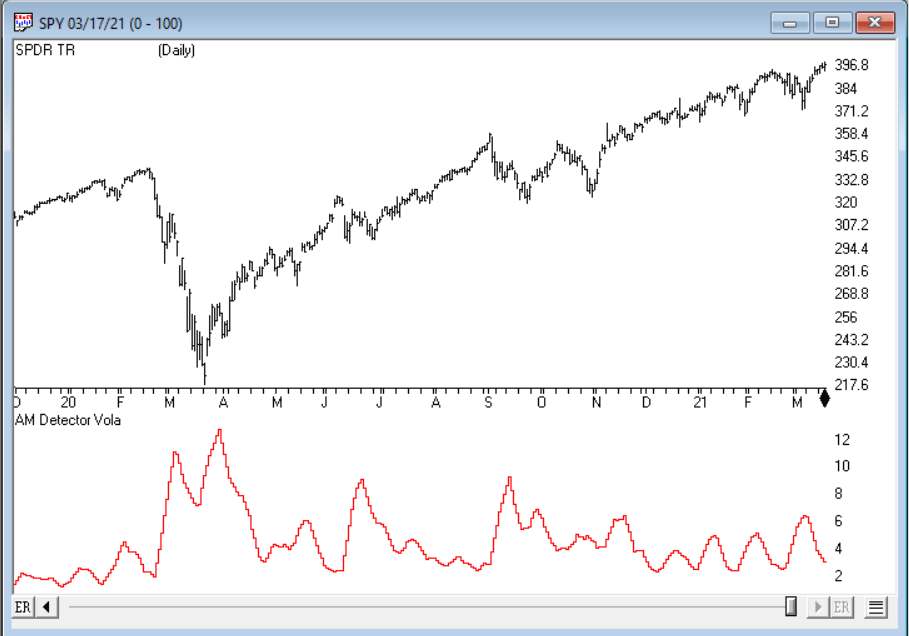
FIGURE 10: AIQ. AM indicator on a chart of SPDR TR (SPY).
—Richard Denning
info@TradersEdgeSystems.com
for AIQ Systems
BACK TO LIST
MICROSOFT EXCEL: MAY 2021
In his article in this issue, “A Technical Description Of Market Data For Traders,” John Ehlers walks us through some amazingly simple mathematical jujitsu to analyze the amplitude modulated and frequency modulated components found in market data.
Figure 11 shows the “whitened” price data (that is, the spectrum is effectively made white noise) and the amplitude modulation (AM) detector. In Figure 12, amplitude information is stripped from the whitened noise signal by way of a hard limit, and the result is integrated via Ehlers’ SuperSmoother to produce the demodulated FM signal. Peaks and valleys in the FM value correlate to major swings in the price. In Figure 13, the AM and FM information are displayed together.
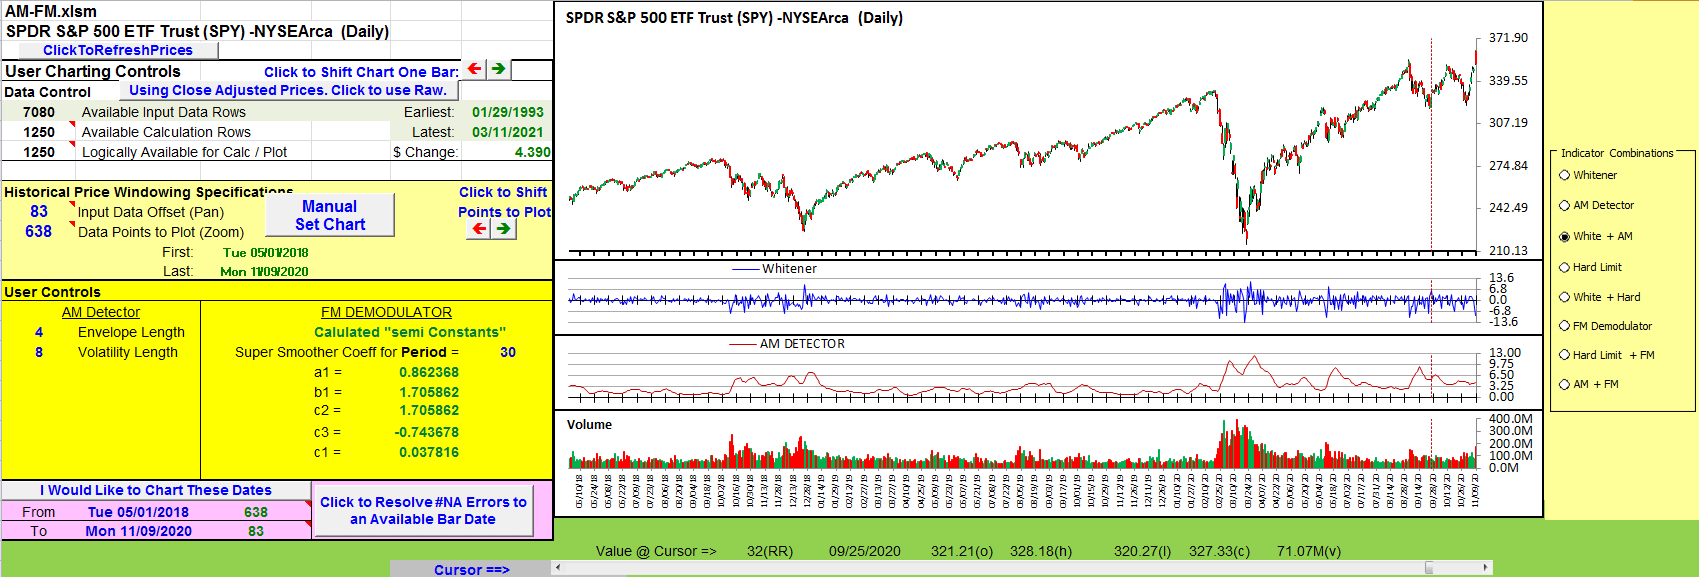
FIGURE 11: AM (AMPLITUDE MODULATION) DETECTOR. Whitened price and the amplitude modulation detector are shown. Larger AM values suggest increased volatility.
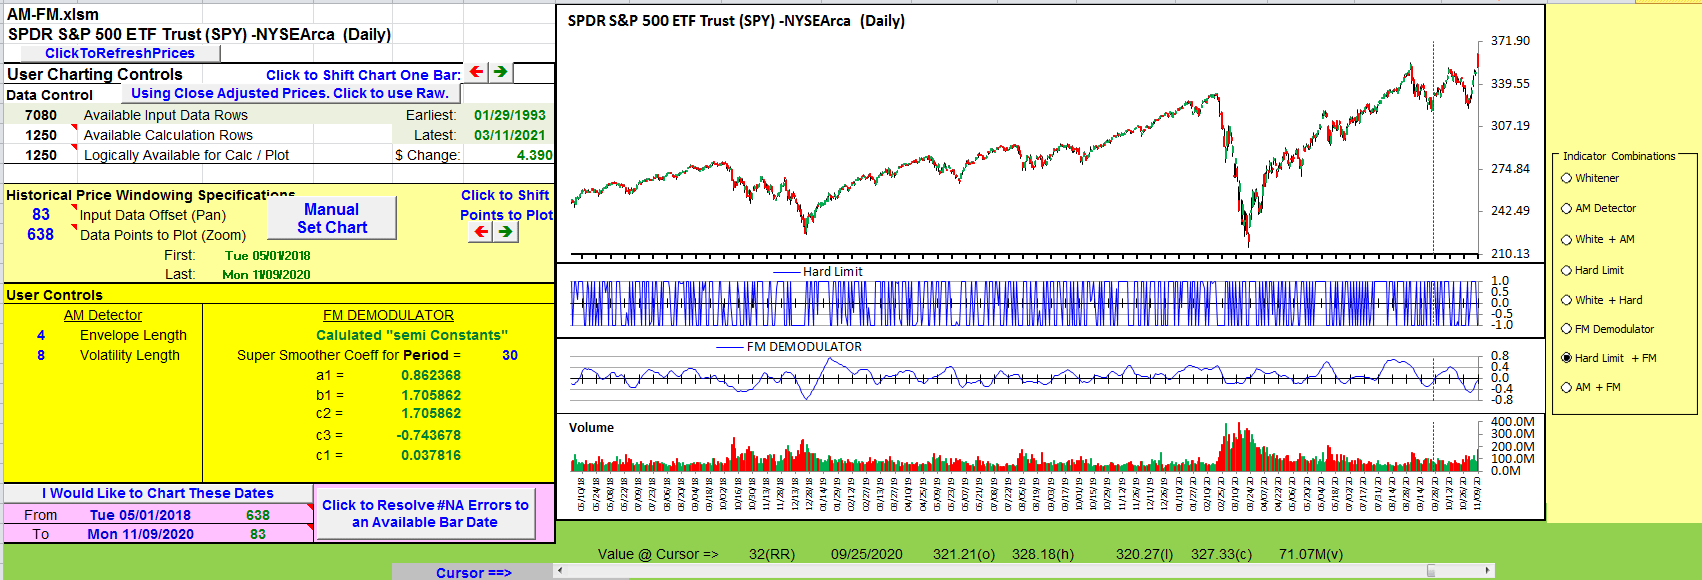
FIGURE 12: DEMODULATED FM SIGNAL. Amplitude information is stripped from the whitened noise signal by way of a hard limit and the result is integrated via Ehlers’ SuperSmoother to produce the demodulated FM signal. Peaks and valleys in the FM value correlate to major swings in the price.
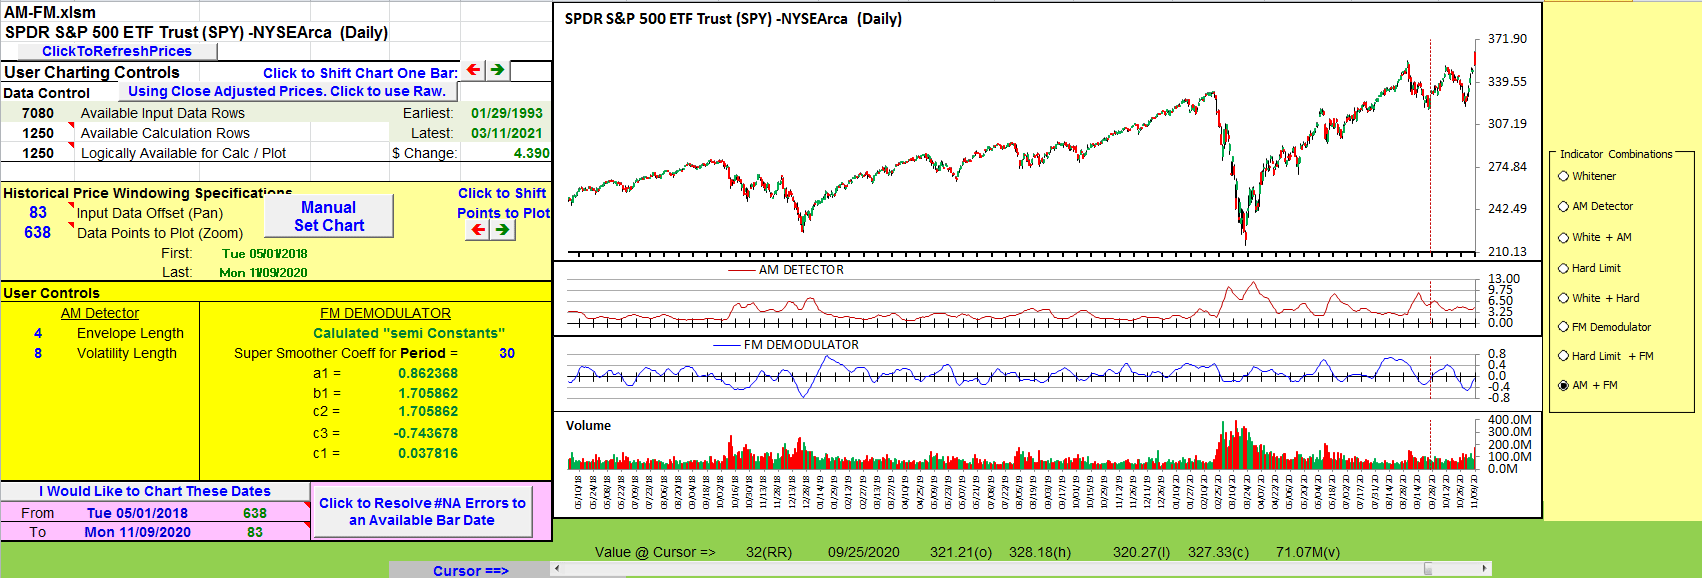
FIGURE 13: AM & FM INFORMATION JUXTAPOSED. Here, the AM and FM information are put next to each other.
Buttons to the right of the charts allow you to explore the progression of indicator pieces and parts in detail and in several pairings.
To download this spreadsheet: The spreadsheet file for this Traders’ Tip can be downloaded here. To successfully download it, follow these steps:
- Right-click on the Excel file link, then
- Select “save as” (or “save target as”) to place a copy of the spreadsheet file on your hard drive.
—Ron McAllister
Excel and VBA programmer
rpmac_xltt@sprynet.com
BACK TO LIST
Originally published in the May 2021 issue of
Technical Analysis of STOCKS & COMMODITIES magazine.
All rights reserved. © Copyright 2021, Technical Analysis, Inc.