TRADERS’ TIPS
July 2021
For this month’s Traders’ Tips, the focus is Markos Katsanos’ article in this issue, “Buy & Hold, Or Buy & Sell?” Here, we present the July 2021 Traders’ Tips code with possible implementations in various software.
You can right-click on any chart to open it in a new tab or window and view it at it’s originally supplied size, often much larger than the version printed in the magazine.
The Traders’ Tips section is provided to help the reader implement a selected technique from an article in this issue or another recent issue. The entries here are contributed by software developers or programmers for software that is capable of customization.

TRADESTATION: JULY 2021
In his article in this issue, “Buy & Hold, Or Buy & Sell?” Markos Katsanos provides a comparison of buy & hold versus buy & sell. The objective was to determine if returns and drawdown could be improved by using buy & sell as compared to buy & hold. The author utilized buy and sell rules based on a variety of factors, including volatility (of the trading symbol and of the VIX), overbought/oversold conditions, volume spikes, and price change. These are further described in the article.
Shown here is EasyLanguage code for a strategy as described in the article and a function used by the strategy to obtain the stochastic values.
// TASC JUL 2021
// Buy & Hold, or Buy & Sell?
// MARKOS KATSANOS

inputs:
	StochLength( numericsimple ),
	SmoothingLength1( numericsimple );

variables:
	ReturnValue( 0 ),
	oFastK( 0 ),
	oFastD( 0 ),
	oSlowK( 0 ),
	oSlowD( 0 );

ReturnValue = Stochastic( High, Low, Close,
 StochLength, SmoothingLength1, 3, 1, oFastK,
 oFastD, oSlowK, oSlowD );

_TASC_JUL_2021_SlowK = oSlowK;


Strategy:  _TASC_JUL_2021_Strategy
// TASC JUL 2021
// Buy & Hold, or Buy & Sell?
// COPYRIGHT MARKOS KATSANOS 2020

// should be applied on a weekly chart of the SPY or
// the SP-500 and $VIX.X should be added as Data2

inputs:
	VIXDNMIN( -30 ),
	VIXUPMIN( 100 ),
	ATRLength( 2 ),
	NetReturnPctThreshold( 6 ),
	InitialEquity( 100000 ),
	PctEquityForTradeSize( 100 ),
	AllowShorts( 0 );

variables:
	TotEquity( 0 ),
	TradeSizeEquity( 0 ),
	TradeSize( 0 ),
	ATR( 0 ),
	CCH( 0 ),
	VIXDN( 0, Data2 ),
	ATRDN( 0 ),
	UP( 0 ),
	LLB( 0 ),
	BuyInitial( false ),
	B2( false ),
	BuySignal( false ),
	VIXUP( 0, Data2 ),
	ATRUP( 0 ),
 	DN( 0 ),
 	HHB( 0 ),
 	VOLUP( 0 ),
 	SellSignal( false );

TotEquity = InitialEquity + NetProfit;
TradeSizeEquity = MaxList( 1000,
 TotEquity * PctEquityForTradeSize * 0.01 );
TradeSize = MaxList( 1,
 Floor( TradeSizeEquity / Close ) );

ATR = AvgTrueRange( ATRLength );
VIXDN = ( Close of Data2 /
 Highest( Close of Data2, 15 )[1] of Data2 - 1 ) *100;
VIXUP = ( Close of Data2 /
 Lowest( Close of Data2, 15 )[1] of Data2 - 1 ) * 100;
ATRDN = ( ATR / Highest(
 AvgTrueRange( ATRLength ), 15 )[1] - 1 ) * 100;
ATRUP = ( ATR / Lowest(
 AvgTrueRange( ATRLength ), 15 )[1] - 1 ) * 100;
UP = ( Highest( Close, 2 ) /
 Lowest( Close, 4 ) - 1 ) * 100;
DN = ( Lowest( Close, 2 ) /
 Highest( Close, 4 ) - 1 ) * 100;
CCH = ( Lowest( Close, 10 ) /
 Highest( Close, 100 ) - 1 ) * 100;
HHB = HighestBar( Close, 4 );
LLB = LowestBar( Close, 4 );

if BarType >= 2 and BarType <= 4 then
	VOLUP = ( Volume /
	 Average( Volume, 50 )[HHB+1] - 1 ) * 100
else
	VOLUP = ( Ticks /
	 Average( Ticks, 50 )[HHB+1] - 1 ) * 100;

BUYINITIAL = CurrentBar <= 10
 and Average( Close, 10 ) >= Average( Close, 10 )[1]
 and _TASC_JUL_2021_SlowK( 3, 3 ) < 40;

B2 = UP > NetReturnPctThreshold
 and ( VIXDN < VIXDNMIN or ATRDN < 2 * VIXDNMIN )
 and CCH < -15
 and Lowest( _TASC_JUL_2021_SlowK( 40, 3 ), LLB ) < 25
 and Lowest( _TASC_JUL_2021_SlowK( 14, 3 ), LLB ) < 25
 and _TASC_JUL_2021_SlowK( 14, 3 ) >=
  _TASC_JUL_2021_SlowK( 40, 3 );

BuySignal = BUYINITIAL or B2;

if BuySignal then
	Buy next bar TradeSize shares market;

SellSignal = Close < Average( Close, 20 )
 and DN < -6
 and ( VIXUP > VIXUPMIN or ATRUP > 2 * VIXUPMIN )
 and VOLUP > 80
 and Highest( _TASC_JUL_2021_SlowK( 40, 3 ), HHB ) >85
 and Highest( _TASC_JUL_2021_SlowK( 14, 3 ), HHB ) >85
 and _TASC_JUL_2021_SlowK( 40, 3 ) >=
  _TASC_JUL_2021_SlowK( 14, 3 );

if SellSignal then
begin
	if AllowShorts = 0 then
		Sell next bar market
	else
		sellShort next bar market;
end;
To download the EasyLanguage code for TradeStation 10, please visit our TradeStation and EasyLanguage support forum. The files for this article can be found here: https://community.tradestation.com/discussions/Topi.aspx?Topic_ID=190289
A sample chart is shown in Figure 1.

FIGURE 1: TRADESTATION. Shown here is a weekly chart of the SPY ETF with the weekly VIX ($VIX.X, added as Data2) as the black line with values plotted on the left axis along with the strategy. Also shown are the built-in volume avg and average true range indicators.
This article is for informational purposes. No type of trading or investment recommendation, advice, or strategy is being made, given, or in any manner provided by TradeStation Securities or its affiliates.
—Chris Imhof
TradeStation Securities, Inc.
www.TradeStation.com
BACK TO LIST

THINKORSWIM: JULY 2021
We put together a strategy based on the article by Markos Katsanos in this issue titled “Buy & Hold, Or Buy & Sell?” We built the strategy referenced by using our proprietary scripting language, thinkscript. To ease the loading process, simply click on https://tos.mx/GUOlXrp or enter it into the address in setup → open shared item from within thinkorswim, then choose view thinkScript strategy and name it “BuyAndSellStrat” or another name that you like and can identify it by. You can then add the strategy to your charts from the edit studies menu from within the charts tab, and then selecting strategies.
Figure 2 shows the strategy added to a three-year weekly chart of SPY as well as the corresponding studies used in the entry and exit points. Please see Markos Katsanos’s article in this issue for more information on interpreting how to use the strategy.

FIGURE 2: THINKORSWIM. The example chart shows the strategy added to a three-year weekly chart of SPY as well as the corresponding studies used in the entry and exit points.
—thinkorswim
A division of TD Ameritrade, Inc.
www.thinkorswim.com
BACK TO LIST

WEALTH-LAB.COM: JULY 2021
The rules presented in the article in this issue by Markos Katsanos (“Buy & Hold, Or Buy & Sell?”) create an intelligent framework for a “buy & hold on steroids” type of system. But it’s beneficial not only to the buy & hold strategy. Equipped with these rules, many long-term strategies can avoid a sizable drawdown by not trading in bear markets. For traders, it may be akin to cherry-picking the profitable periods while leaving out the periods of turmoil.
As the system relies on external symbol’s data and a multitude of indicators, we chose to omit some of the plots (while leaving the conditions activated in the code, of course) to keep the chart manageable (e.g. stochastic).
using WealthLab.Backtest;
using System;
using WealthLab.Core;
using WealthLab.Indicators;
using System.Drawing;
using System.Collections.Generic;

namespace TASCSampleStrategies
{
    public class BuyAndHold_or_BuyAndSell : UserStrategyBase
    {
        public override void Initialize(BarHistory bars)
        {
			/* obtain the VIX from Yahoo */
	        vix = GetHistory(bars, "^VIX");
			vixRoc = ROC.Series(vix.Close, 15);
			atr = ATR.Series(bars, 2);
			atrHi = Highest.Series(atr, 15);
			roc = ROC.Series(bars.Close, 4);
			stoch = StochD.Series(bars, 14, 3);
			stoch3 = StochD.Series(bars, 3, 3);
			overbought = Highest.Series(stoch, 4);
			oversold = Lowest.Series(stoch, 4);
			sma = SMA.Series(bars.Close, 20);
			sma10 = SMA.Series(bars.Close, 10);
			volume = SMA.Series(bars.Volume, 50);

			PlotIndicator( vixRoc as IndicatorBase, Color.Chartreuse, PlotStyles.Line, false, "vix");
			PlotIndicator( atr as IndicatorBase, Color.Chartreuse, PlotStyles.Line, false, "atr");
			PlotIndicator( atrHi as IndicatorBase, Color.Black, PlotStyles.DottedLine, false, "atr");
			PlotIndicator( stoch as IndicatorBase, Color.DarkBlue, PlotStyles.Oscillator, false, "stoch");
			PlotIndicator( overbought as IndicatorBase, Color.DarkOrange, PlotStyles.Line, false, "stoch");
			PlotIndicator( oversold as IndicatorBase, Color.DarkGreen, PlotStyles.Line, false, "stoch");
			PlotIndicator( sma as IndicatorBase, Color.Blue, PlotStyles.Line, false, "Price");
			PlotIndicator( volume as IndicatorBase, Color.DarkViolet, PlotStyles.Line, false, "Volume");
			DrawHorzLine(200, Color.DarkRed, 1,LineStyles.Dashed, "atr");

			StartIndex = 50;
        }

        public override void Execute(BarHistory bars, int idx)
        {
			/* Buy conditions */

			/* Volatility */
			bool vixFalls = vixRoc[idx] * 0.7 < vixRoc[idx - 1], atrDown = atr[idx] < atrHi[idx] * 0.6;
			bool buyVolatility = vixFalls || atrDown;
			if (vixFalls) SetBackgroundColor( vix, idx, Color.FromArgb(30, Color.Green), "vix");
			if (atrDown) SetBackgroundColor( bars, idx, Color.FromArgb(30, Color.Green), "atr");

			/* Net returns over the last four weeks should be more than 6% */
			bool netReturns = roc[idx] >= 6;
			if (netReturns) SetBackgroundColor( bars, idx, Color.FromArgb(10, Color.Green), "Price");

			/* oversold conditions leading to the recovery */
			if (!oversoldLeading)
			{
				if (oversold[idx] < 25)
				{
					oversoldLeading = true;
					oversoldBar = idx;
					SetBarColor( bars, oversoldBar, Color.Orange);
					if (!HasOpenPosition(bars, PositionType.Long))
						DrawBarAnnotation("Oversold leading to recovery", idx, false, Color.Orange, 12);
				}
			}

			/* reset if setup has timed out */
			if(oversoldLeading)
			{
				SetBackgroundColor( bars, oversoldBar, Color.FromArgb(30, Color.Orange), "Price");

				if ((idx + 1 - oversoldBar) > oversoldTimeout)
				{
					oversoldLeading = false;
					if(oversoldBar > -1) SetBackgroundColor( bars, oversoldBar, Color.FromArgb(30, Color.Red), "Price");
				}
			}

			bool buy = buyVolatility && netReturns && oversoldLeading;
			bool buyInitial = GetPositions().Count == 0 && (sma10[idx] > sma10[idx - 1]) && stoch3[idx] < 40;

			/* Sell conditions */

			/* overbought conditions leading to the selloff */
			if (!overboughtLeading)
			{
				if (overbought[idx] > 85)
				{
					overboughtLeading = true;
					overboughtBar = idx;
					SetBarColor( bars, overboughtBar, Color.Orange);
					if (!HasOpenPosition(bars, PositionType.Long))
						DrawBarAnnotation("Overbought leading to selloff", idx, false, Color.LimeGreen, 12);
				}
			}

			/* reset if setup has timed out */
			if(overboughtLeading)
			{
				SetBackgroundColor( bars, overboughtBar, Color.FromArgb(30, Color.LimeGreen), "Price");

				if ((idx + 1 - overboughtBar) > oversoldTimeout)
				{
					overboughtLeading = false;
					if (overboughtBar > -1) SetBackgroundColor( bars, overboughtBar, Color.FromArgb(30, Color.Green), "Price");
				}
			}

			bool vixSpike = vixRoc[idx] > vixRoc[idx - 1] * 2.0, atrUp = atr[idx] >= atrHi[idx] * 2.0;
			bool highVolatility = vixSpike || atrUp;
			if(vixSpike) SetBackgroundColor( vix, idx,Color.FromArgb(30, Color.Red), "vix");
	        if(atrUp) SetBackgroundColor( bars, idx, Color.FromArgb(30, Color.Red), "atr");

			/* Market losses: the 4-week price decline is at or below -6% */
			bool marketLoss = roc[idx] <= -6;
			if (marketLoss) SetBackgroundColor( bars, idx, Color.FromArgb(50, Color.Red), "Price");

			bool downtrend = bars.Close[idx] < sma[idx];
			bool highVolume = bars.Volume[idx] > 1.8 * volume[idx];

			bool sell = highVolatility && marketLoss && overboughtLeading && downtrend && highVolume;

            if (!HasOpenPosition(bars, PositionType.Long))
            {
				if (buyInitial || buy)
				{
					PlaceTrade(bars, TransactionType.Buy, OrderType.Market);
					oversoldLeading = false;
				}
            }
            else
            {
				if (sell)
				{
					ClosePosition(LastPosition, OrderType.Market);
					overboughtLeading = false;
				}
            }
        }

		BarHistory vix;
		TimeSeries atr, atrHi, vixRoc, roc, stoch, stoch3, overbought, oversold, sma, sma10, volume;
		int oversoldTimeout = 20, oversoldBar = -1, overboughtBar = -1;
		bool oversoldLeading = false, overboughtLeading = false;
	}
}

FIGURE 3: WEALTH-LAB. Sample trades are shown on a chart of SPY.
—Gene Geren (Eugene)
Wealth-Lab team
www.wealth-lab.com
BACK TO LIST

NINJATRADER: JULY 2021
The buy & sell strategy presented in the article by Markos Katsanos in this issue (“Buy & Hold, Or Buy & Sell?”) is available for download at the following links for NinjaTrader 8 and for NinjaTrader 7:
Once the file is downloaded, you can import the indicator into NinjaTader 8 from within the control center by selecting Tools → Import → NinjaScript Add-On and then selecting the downloaded file for NinjaTrader 8. To import into NinjaTrader 7, from within the control center window, select the menu File → Utilities →→ Import NinjaScript and select the downloaded file.
You can review the indicator and strategy source code in NinjaTrader 8 by selecting the menu New → NinjaScript Editor → Strategies folder from within the control center window and selecting the BuySellSystem file. You can review the indicator’s source code in NinjaTrader 7 by selecting the menu Tools → Edit NinjaScript → Strategy from within the control center window and selecting the BuySellSystem file. The strategy produces an exploration file in your Documents\NinjaTrader 8\BuySellExploration folder.
NinjaScript uses compiled DLLs that run native, not interpreted, which provides you with the highest performance possible.
A sample chart displaying the strategy is shown in Figure 4.

FIGURE 4: NINJATRADER. The BuySellSystem strategy is displayed on a weekly SPY chart from 1999 to 2009.
—Chris Lauber
NinjaTrader, LLC
www.ninjatrader.com
BACK TO LIST

NEUROSHELL TRADER: JULY 2021
The buy & hold strategy described by Markos Katsanos in his article in this issue, “Buy & Hold, Or Buy & Sell?” can be easily implemented with a few of NeuroShell Trader’s 800+ indicators and trading strategy wizard.
BUY LONG CONDITIONS: [1 of which must be true]
And2( A>=B( Momentum( Avg( Close, 10), 1), 0),
A<B( Stoch%D( High, Low, Close, 3, 3), 40))

And4( A>B( Neg( Spread%( Min( Close, 4), Max( Close, 2))), 6),
Or2( A<B( Neg( Spread%( Lag( Max( VIXClose, 15), 1), VIXClose)), -30),
A<B( Neg( Spread%( Lag( Max( ATR(2), 15), 1), ATR(2))), -60)),
A<B( Neg( Spread%( Max( Close, 100), Min( Close, 10))), -15),
And3( A<B( Min( Stoch%D(40, 3), 4), 25),
A<B( Min( Stoch%D(14, 3), 4), 25),
A>=B( Stoch%D(14, 3), Stoch%D(40, 3))))

SELL LONG CONDITIONS: [All of which must be true]
A<B( Neg( Spread%( Max( Close, 4), Min( Close, 2))), -6)
A<B( Close, Avg( Close, 20))
Or2( A>B( Neg( Spread%( Lag( Min( VIXClose, 15), 1), VIXClose)), 100),
A>B( Neg( Spread%( Lag( Min( ATR(2), 15), 1), ATR(2))), 200))
A>B( Neg( Spread%( Lag( Avg( Volume, 50), 1), Volume)), 80)
A>B( Max( Stoch%D(40, 3), 4), 85)
A>B( Max( Stoch%D(14, 3), 4), 85)
A>=B( Stoch%D(40, 3), Stoch%D(14, 3))

FIGURE 5: NEUROSHELL TRADER. This NeuroShell Trader chart shows the buy & sell strategy applied to the SPY.
NeuroShell Trader users can go to the Stocks & Commodities section of the NeuroShell Trader free technical support website to download a copy of this or any previous Traders’ Tips.
—Ward Systems Group, Inc.
sales@wardsystems.com
www.neuroshell.com
BACK TO LIST

OPTUMA: JULY 2021
Here are formulas for use in Optuma based on the code given in Markos Katsanos’ article in this issue, “Buy & Hold, Or Buy & Sell?”
//BUY SIGNALS;
//BUYINITIAL;
Sig1 = MA(BARS=10, CALC=Close) IsUp and STOCH(BAR1=3)<40;
Buy1 = ACC(Sig1) ChangeTo 1;

//Rule1 = Volatility;
VIX = GETDATA(CODE=VIX:CBOEI, TIMEFRAME=1 Week);
VIXDN=(VIX / (HIGHESTHIGH(VIX,BARS=15, INCBAR=True),-1)-1);
ATRDN = (ATR(BARS=2) / (HIGHESTHIGH(ATR(BARS=2), BARS=15, INCBAR=True), -1)-1) ;

Rule1 = VIXDN < -0.3 or ATRDN < -0.6;

//Rule2 = Net Returns;
Rule2 = ((HIGHESTHIGH(CLOSE(), BARS=2, INCBAR=True) / LOWESTLOW(CLOSE(), BARS=4) -1) * 100) > 6;

//Rule3 = Oversold Conditions;
S1 = STOCH(BAR1=40, BAR2=3);
S2 = STOCH(BAR1=14, BAR2=3);
CCH = (LOWESTLOW(BARS=10) / HIGHESTHIGH(BARS=100)-1)*100;
Rule3 = (LOWESTLOW(S1, BARS=4) < 25) and (LOWESTLOW(S2, BARS=4) < 25) and S2 >= S1 and CCH<-15;

//Signal;
Buy1 or (Rule1 and Rule2 and Rule3)

// SELL RULES;

// Rule1 = High Volatility;
VIX = GETDATA(CODE=VIX:CBOEI, TIMEFRAME=1 Week);
VIXUP=(VIX / (LOWESTLOW(VIX,BARS=15, INCBAR=True),-1)-1);
ATRUP = (ATR(BARS=2) / (LOWESTLOW(ATR(BARS=2), BARS=15, INCBAR=True), -1)-1) ;

Rule1 = VIXUP >1 or ATRUP > 2;

//Rule2 = Market Losses;
Rule2 = ((LOWESTLOW(CLOSE(),BARS=2, INCBAR=True) / HIGHESTHIGH(CLOSE(), BARS=4, INCBAR=True)-1) * 100) < -6;

//Rule3 = Overbought Conditions;
S1 = STOCH(BAR1=40, BAR2=3);
S2 = STOCH(BAR1=14, BAR2=3);
Rule3 = (HighestHigh(S1, BARS=4) > 85) and (HighestHigh(S2, BARS=4) > 85) and S1 > = S2;

//Rule4 = Downtrend;
Rule4 = CLOSE() < MA(BARS=20, CALC=Close);

//Rule5 = High Volume;
Rule5 = (VOL()/(MA(VOL(), BARS=50))*100) > 180;

//Signal;
Rule1 and Rule2 and Rule3 and Rule4 and Rule5
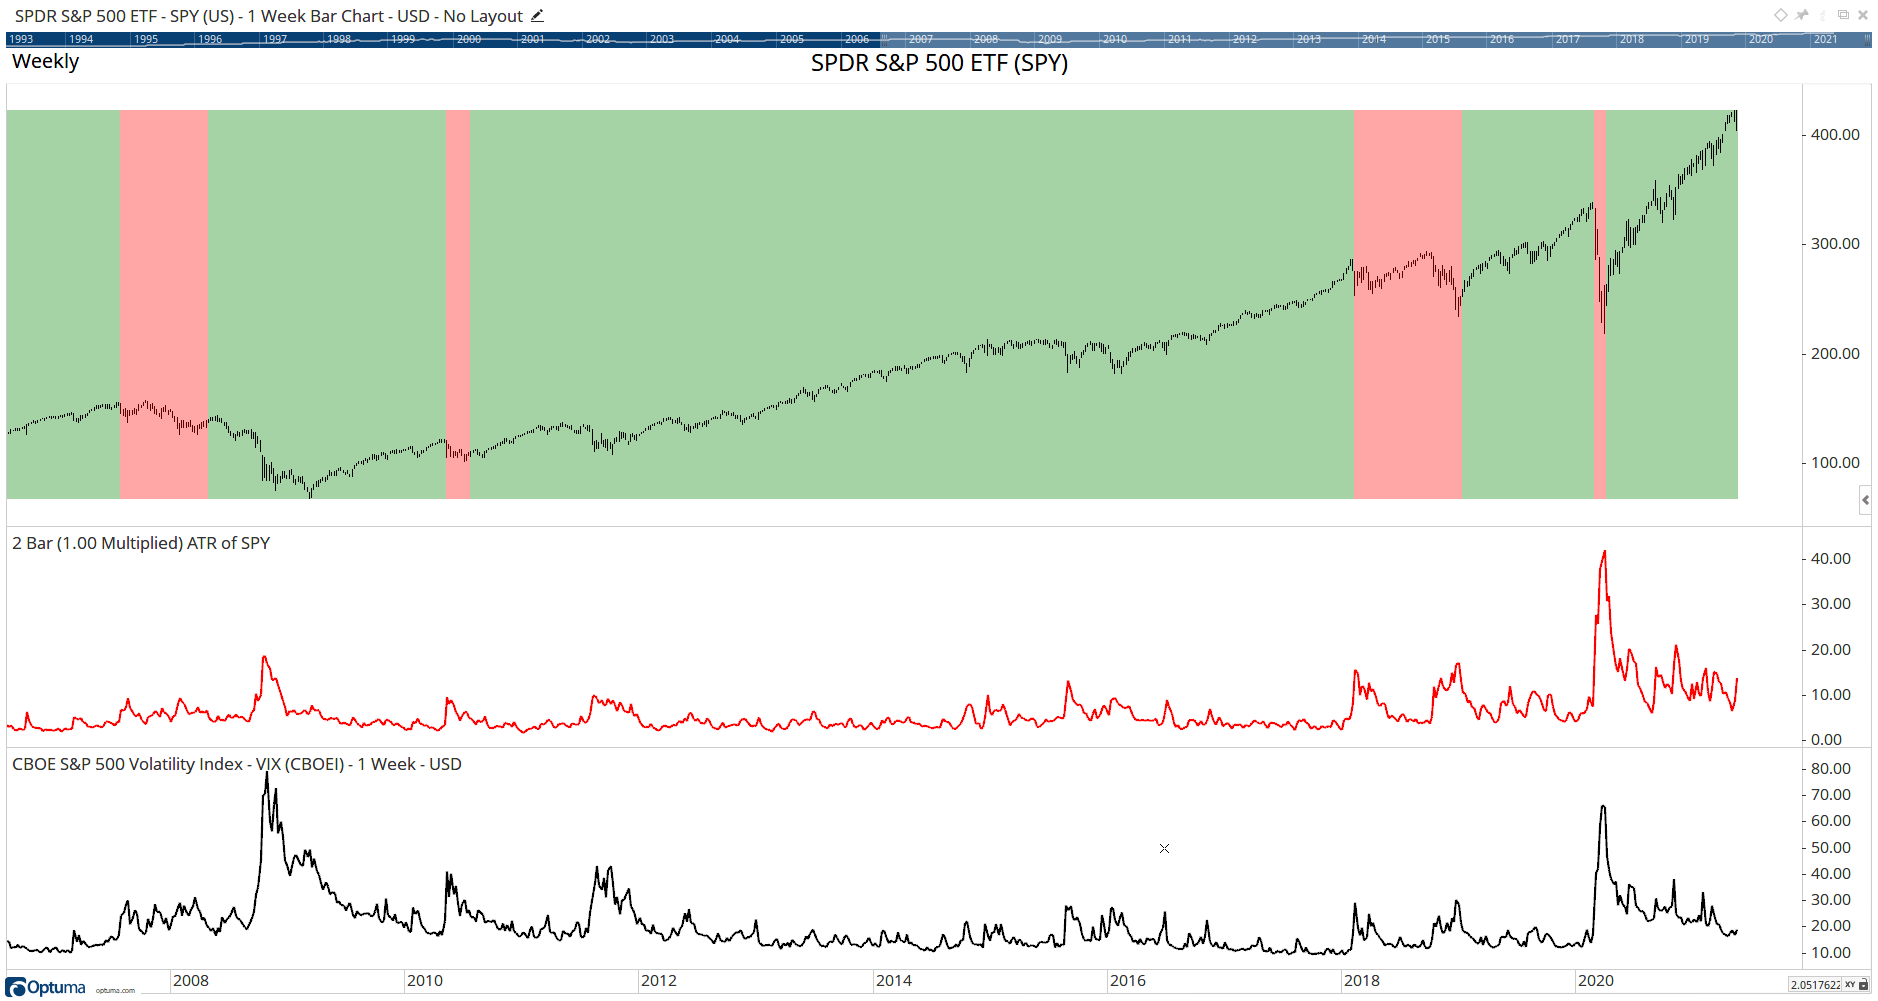
FIGURE 6: OPTUMA. This sample chart displays the buy & sell system on the weekly SPY with ATR and VIX in the subpanels.
—support@optuma.com
BACK TO LIST

AIQ: JULY 2021
The importable AIQ EDS file based on Markos Katsanos’ article in this issue, “Buy & Hold, Or Buy & Sell?” can be obtained on request via email to info@TradersEdgeSystems.com. The code is also available here:
!Buy & Hold, Or Buy & Sell?
!Author: Markos Katsanos, TASC July 2021
!Coded by: Richard Denning, 5/17/2021

C is [close].
C1 is valresult(C,1).
H is [high].
L is [low].
LL3 is lowresult(L,3).
HH3 is highresult(H,3).
LL14 is lowresult(l,14).
HH14 is highresult(H,14).
LL40 is lowresult(L,40).
HH40 is highresult(H,40).
V is [volume].
WilderLen is 2.
ATRlen is WilderLen*2-1.
VIX is TickerUDF("VIX",C).
VIXDN is (VIX/highresult(VIX,15,1)-1)*100.
VIXUP is (VIX/lowresult(VIX,15,1)-1)*100.
VIXDNMIN is -30.
VIXUPMIN is 100.

! AVERAGE TRUE RANGE
HD if hasdatafor(ATRlen+20) >= ATRlen.
TR is Max(H - L,max(abs(C1 - L),abs(C1 - H))).
ATR is iff(HD,expavg(TR,ATRlen),0).

ATRDN is (ATR/highresult(ATR,15,1)-1)*100.
ATRUP is (ATR/lowresult(ATR,15,1)-1)*100.
UP is (highresult(C,2)/lowresult(C,4)-1)*100.
DN is (lowresult(C,2)/highresult(C,4)-1)*100.
CCH is (lowresult(C,10)/highresult(C,100)-1)*100.
HHB is scanany(C=^highresult(C,4),4) then offsettodate(month(),day(),year()).
VOLUP is V/simpleavg(V,50,HHB-1)*100.
LLB is scanany(C=^lowresult(C,4),4) then offsettodate(month(),day(),year()).
SMA10 is simpleavg(C,10).
BUYINITIAL if SMA10 >= valresult(SMA10,1)
   AND StochK3 < 40
   AND hasdatafor(20)>=10.
B2 if UP > 6
  AND (VIXDN<VIXDNMIN OR ATRDN<2*VIXDNMIN)
  AND CCH<-15
  AND lowresult(StochK40,^LLB)<25
  AND lowresult(StochK14,^LLB)<25
  AND StochK14>=StochK40.
Buy if BUYINITIAL or B2.

SELL if C<simpleavg(C,20)
  AND DN<-6
  AND (VIXUP>VIXUPMIN OR ATRUP>2*VIXUPMIN)
  AND VOLUP>80 AND highresult(StochK40,^HHB)>85
  AND highresult(StochK14,^HHB)>85
  AND StochK40>=StochK14.

Stoch3 is (C - LL3) / (HH3 - LL3) * 100.
StochK3 is simpleavg(Stoch3,3).
Stoch14 is (C - LL14) / (HH14 - LL14) * 100.
StochK14 is simpleavg(Stoch14,3).
Stoch40 is (C - LL40) / (HH40 - LL40) * 100.
StochK40 is simpleavg(Stoch40,3).

ShowData if 1.
Figure 7 shows a backtest of the weekly system using the Nasdaq 100 list of stocks from 5/17/1999 to 5/17/2021.

FIGURE 7: AIQ. Shown here is a summary of the EDS weekly backtest using the Nasdaq 100 list of stocks from 5/17/1999 to 5/17/2021.
—Richard Denning
info@TradersEdgeSystems.com
for AIQ Systems
BACK TO LIST

TRADE NAVIGATOR: JULY 2021
We have created a library file based on the article in this issue by Markos Katsanos titled “Buy & Hold, Or Buy & Sell?” for users to download. The library filename is “SC202107.” To download and install it, click on the blue telephone button, select download special file, then replace the word “upgrade” with “SC202107” (without the quotes), and click on the start button. When prompted to upgrade, click yes. If prompted to close all software, click continue. Your library will now download.
This library contains a strategy called “SC202107 Buy and Sell,” two highlight bars that are named “buy condition” and “sell condition,” an indicator named “HistVol,” and a template named “SC202107.” Following are instructions on how to access each of these items from your downloaded library file.
SC202107 template
This template can be inserted onto your chart by opening the charting dropdown menu, selecting the templates command, then selecting the “SC202107” template.
SC202107 buy and sell strategy
This prebuilt strategy can be overlaid onto your chart by opening the charting dropdown menu, selecting the add to chart command, then selecting the strategies tab.
Buy and sell condition highlight bar
You can insert the highlight bars onto your chart by opening the charting dropdown menu, selecting the add to chart command, then on the “highlight bars” tab, find your named indicators, select them, then click on the add button. You can repeat this procedure for additional indicators if you wish.
HistVol indicator
You can insert this indicator onto your chart by opening the charting dropdown menu, selecting the add to chart command, then on the “indicators” tab, find your named indicator, select it, then click on the add button. You can repeat this procedure for additional indicators if you wish.
If you need assistance with creating or using the indicators and/or template, our technical support staff is available to help via phone or via live chat through our website.
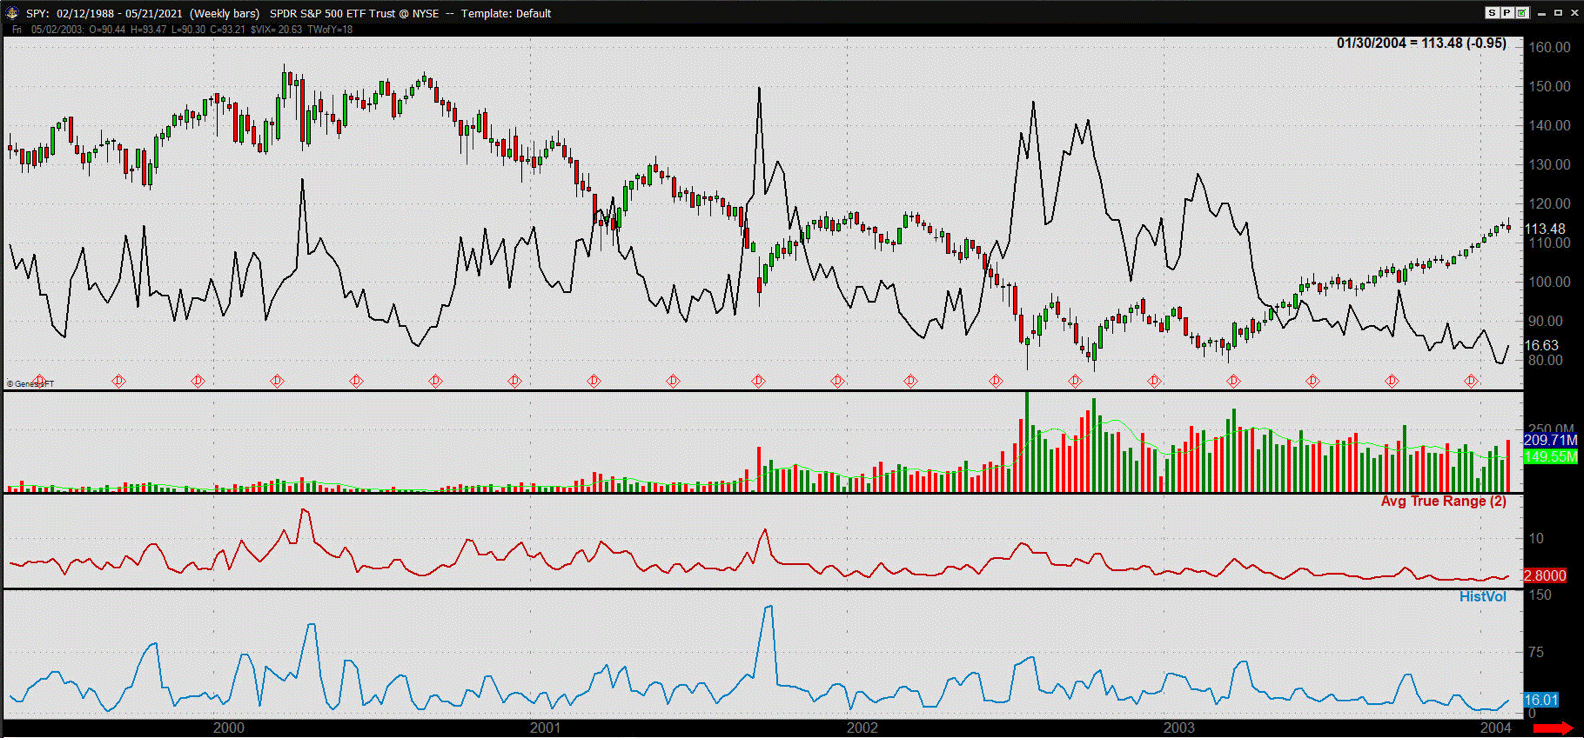
FIGURE 8: TRADE NAVIGATOR. This displays the "SC202107" template from the library.
—Genesis Financial Data
Tech support 719 884-0245
www.TradeNavigator.com
BACK TO LIST

THE ZORRO PROJECT: JULY 2021
Buying and holding a stock index ETF is a long-term profitable strategy, but it exposes your capital to the full market risk. A method to go out of the market in a downtrend and invest in an uptrend would solve that problem. This is what Markos Katsanos’ article in this issue (“Buy & Hold, Or Buy & Sell?”) proposes to do.
We have converted the AmiBroker code provided with the article to C for use in Zorro:
function run()
{
  StartDate = 20101231;
  EndDate = 20201231;
  BarPeriod = 7*1440; // 1 week
  LookBack = 100;
  Capital = 100000;

  set(PARAMETERS,TESTNOW,PLOTNOW);
  setf(PlotMode,PL_ALL);
  PlotScale = 8;

  asset("VIX");
  var VIXdn = (price(0)/HH(15,1)-1)*100;
  var VIXup = (price(0)/LL(15,1)-1)*100;
  var VIXDnMin = -optimize(30,20,40,10);
  var VIXUpMin = optimize(100,80,120,10);
  plot("VIX",price(0),NEW,BLACK);

  asset("SPY"); // use unadjusted data!
  vars SPYs = series(priceClose());
  vars Vols = series(marketVol());
  vars ATRs = series(ATR(2));
  var ATRDn = (ATRs[0]/MaxVal(ATRs+1,15)-1)*100;
  var ATRUp = (ATRs[0]/MinVal(ATRs+1,15)-1)*100;
  var Up = (HH(2)/LL(4)-1)*100;
  var Dn = (LL(2)/HH(4)-1)*100;
  var Cch = (LL(10)/HH(100)-1)*100;
  vars StochK14s = series(StochK(14,3));
  vars StochK40s = series(StochK(40,3));
  int HHb = MaxIndex(SPYs,4);
  int LLb = MinIndex(SPYs,4);
  var VOLUp = (Vols[0]/SMA(Vols+HHb+1,50)-1)*100;
  plot("Volume",Vols,BARS|NEW,BLUE);
  plot("ATR(2)",ATRs,LINE|NEW,RED);

  int BuyInitial = once(
    SMA(SPYs,10) >= SMA(SPYs+1,10) and
    StochK(3,3) < 40);

  int Buy = Up > 6 and
    (VIXdn < VIXDnMin or ATRDn < 2*VIXDnMin) and
    Cch < -15 and
    MinVal(StochK40s,LLb) < 25 and
    MinVal(StochK14s,LLb) < 25 and
    StochK14s[0] >= StochK40s[0];

  int Sell = SPYs[0] < SMA(SPYs,20) and
    Dn < -6 and
    (VIXup > VIXUpMin or ATRUp > 2*VIXUpMin) and
    VOLUp > 80 and
    MaxVal(StochK40s,HHb) > 85 and
    MaxVal(StochK14s,HHb) > 85 and
    StochK14s[0] <= StochK40s[0];

  MaxLong = 1;
  Leverage = 1;
  Margin = Equity; // invest all money
  Fill = 3; // enter/exit at next open
  if(Sell)
    exitLong();
  else if(BuyInitial or Buy)
    enterLong();
//plot tiny triangles for the buy and sell signals
  if(Buy) plot("Buy",0.9*priceLow(),MAIN|TRIANGLE,GREEN);
  if(Sell) plot("Sell",1.1*priceHigh(),MAIN|TRIANGLE4,RED);
}
The chart in Figure 9 displays the signals. On the chart we can see that the system is indeed only in the market when SPY rises. The blue line is the VIX, the tiny red and green triangles are the buy and sell signals. They appear well placed.
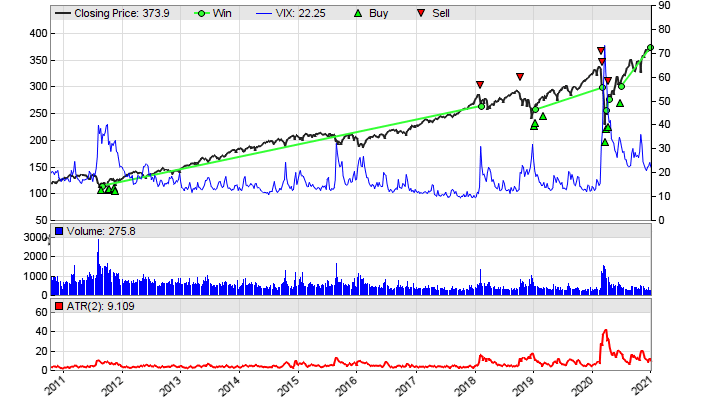
FIGURE 9: ZORRO PROJECT. The chart displays the buy & sell system. We can see that the system is only in the market when SPY rises. The blue line is the VIX, and the tiny red and green triangles are the buy and sell signals.
It should be mentioned that the author’s AmiBroker setup must be exactly reproduced for getting the same result. Tiny deviations, such as using adjusted instead of unadjusted SPY data, shifting the bars by a few hours, or using a slightly different Stoch variant, produced a quite different backtest.
The buy & sell system can be downloaded from the 2021 script repository on https://financial-hacker.com. The Zorro platform can be downloaded from https://zorro-project.com.
—Petra Volkova
The Zorro Project by oP group Germany
zorro-project.com
BACK TO LIST
MICROSOFT EXCEL: JULY 2021
In his article in this issue, titled “Buy & Hold, Or Buy & Sell?” Markos Katsanos presents a look at a long view trading strategy applied to the SPY ETF.
Be warned! This spreadsheet is quite slow to calculate after any change! Some of that time is consumed in the graphics engine to render the charts with lots of bars. The rest goes to the direct calculation. Several of the indicators used here are computationally intense.
The sidebar code that accompanies the article is focused on supporting the long-side transaction decisions and requires a number of conditions for entry and exit of a long position.
In the article, Katsanos mentions that he briefly explored the short side but did not find that it contributed a lot. The short-side strategy is commented out in the sidebar’s code. It simply equates going short with closing a long and subsequently covering a short with the opening of a long.
For grins I put the short side into this spreadsheet as an option under the control of a checkbox in the user controls area on the left. For SPY in Figure 10, adding the short capability appears to be beneficial by contributing $93.66 from the short side to my one-share trading simulation. However, for other symbols, such as The Coca-Cola Company (KO) demonstrated in Figure 11, this simple short-side decision strategy indeed proves to be not quite robust enough.

FIGURE 10: EXCEL. The buy & sell system based on Markos Katsanos’ article in this issue is shown here applied to the SPY ETF.

FIGURE 11: EXCEL. Shown here are data tables for the strategies and their corresponding surface charts.
To download this spreadsheet: The spreadsheet file for this Traders’ Tip can be downloaded here. To successfully download it, follow these steps:
- Right-click on the Excel file link, then
- Select “save as” (or “save target as”) to place a copy of the spreadsheet file on your hard drive.
—Ron McAllister
Excel and VBA programmer
rpmac_xltt@sprynet.com
BACK TO LIST

eSIGNAL: JULY 2021
For this month’s Traders’ Tip, we’ve provided the “Moving Average Bands.efs” study based on the article by Vitali Apirine in this issue titled “Moving Average Bands (part 1).” The study displays increasing or decreasing volatility to determine potential entry points in trending or sideways markets.
The study contains formula parameters that may be configured through the edit chart window (right-click on the chart and select “edit chart”). A sample chart displaying the study is shown in Figure 12.

FIGURE 12: eSIGNAL. Here is an example of the study plotted on a daily chart of $SPX.
To discuss this study or download a complete copy of the formula code, please visit the EFS library discussion board forum under the forums link from the support menu at www.esignal.com or visit our EFS KnowledgeBase at www.esignal.com/support/kb/efs. The eSignal formula script (EFS) is also available for copying & pasting below.
/**********************************
Provided By:
Copyright 2019 Intercontinental Exchange, Inc. All Rights Reserved.
eSignal is a service mark and/or a registered service mark of Intercontinental Exchange, Inc.
in the United States and/or other countries. This sample eSignal Formula Script (EFS)
is for educational purposes only.
Intercontinental Exchange, Inc. reserves the right to modify and overwrite this EFS file with each new release.

Description:
    Moving Average Bands
    by Vitali Apirine


Version:            1.00  05/14/2021

Formula Parameters:                    Default:
Periods1                               50
Periods2                               10
Mltp                                   1

Notes:
The related article is copyrighted material. If you are not a subscriber
of Stocks & Commodities, please visit www.traders.com.

**********************************/
var fpArray = new Array();
var bInit = false;

function preMain() {
    setStudyTitle("Moving Average Bands");
    setCursorLabelName("Upper Band", 0);
    setCursorLabelName("Middle band", 1);
    setCursorLabelName("Lower Band", 2);
    setCursorLabelName("MA2", 3);
    setPriceStudy(false);
    setDefaultBarFgColor(Color.RGB(0x00,0x94,0xFF), 0);
    setDefaultBarFgColor(Color.RGB(0xFE,0x69,0x00), 1);
    setDefaultBarFgColor(Color.RGB(0x00,0x94,0xFF), 2);
    setDefaultBarFgColor(Color.black, 3);
    setPlotType( PLOTTYPE_LINE , 0 );
    setPlotType( PLOTTYPE_LINE , 1 );
    setPlotType( PLOTTYPE_LINE , 2 );
    setPlotType( PLOTTYPE_LINE , 3 );


    var x=0;
    fpArray[x] = new FunctionParameter("Periods1", FunctionParameter.NUMBER);
	with(fpArray[x++]){
        setLowerLimit(1);
        setDefault(50);
    }
    fpArray[x] = new FunctionParameter("Periods2", FunctionParameter.NUMBER);
	with(fpArray[x++]){
        setLowerLimit(1);
        setDefault(10);
    }
    fpArray[x] = new FunctionParameter("Mltp", FunctionParameter.NUMBER);
	with(fpArray[x++]){
        setName('Multiplier');
        setLowerLimit(0);
        setDefault(1);
    }

}

var bVersion = null;
var xMA1 = null;
var xMA2 = null;
var xDST = null;
var xClose = null;
var xDV = null;
var xDev = null;


function main(Periods1, Periods2, Mltp) {
    if (bVersion == null) bVersion = verify();
    if (bVersion == false) return;

    if ( bInit == false ) {
        xClose = close();
        xMA1 = ema(Periods1, xClose)
        xMA2 = ema(Periods2, xClose)
        xDST = efsInternal('Calc_DST', xMA1, xMA2);
        xDV = efsInternal('Calc_DV', xDST, Periods2);
        xDev = efsInternal('Calc_Dev', xDV, Mltp);

        bInit = true;
    }

    if (getCurrentBarCount() <= (Periods1 + Periods2)) return;

    return [xMA1.getValue(0) + xDev.getValue(0), xMA1.getValue(0), xMA1.getValue(0) - xDev.getValue(0), xMA2.getValue(0)]
}

function Calc_Dev(xDV, Mltp){
    var ret = 0;
    ret = Math.sqrt(xDV.getValue(0)) * Mltp;
    return ret;
}

function Calc_DV(xDST, Periods2){
    var sum = 0;
    var ret = 0;
    for (var i = 0; i < Periods2; i++){
        sum = sum + (xDST.getValue(-i) * xDST.getValue(-i))
    }
    ret = sum / Periods2;
    return ret;
}

function Calc_DST(xMA1, xMA2){
    var ret = 0;
    ret = xMA1.getValue(0) - xMA2.getValue(0);
    return ret;
}

function verify(){
    var b = false;
    if (getBuildNumber() < 779){

        drawTextAbsolute(5, 35, "This study requires version 10.6 or later.",
            Color.white, Color.blue, Text.RELATIVETOBOTTOM|Text.RELATIVETOLEFT|Text.BOLD|Text.LEFT,
            null, 13, "error");
        drawTextAbsolute(5, 20, "Click HERE to upgrade.@URL=https://www.esignal.com/download/default.asp",
            Color.white, Color.blue, Text.RELATIVETOBOTTOM|Text.RELATIVETOLEFT|Text.BOLD|Text.LEFT,
            null, 13, "upgrade");
        return b;
    }
    else
        b = true;

    return b;
}
—Eric Lippert
eSignal, an Interactive Data company
800 779-6555, www.eSignal.com
BACK TO LIST
Originally published in the July 2021 issue of
Technical Analysis of STOCKS & COMMODITIES magazine.
All rights reserved. © Copyright 2021, Technical Analysis, Inc.


