TRADERS’ TIPS
August 2021
For this month’s Traders’ Tips, the focus is Vitali Apirine’s article in this issue, “Moving Average Band Width”, as well as his July 2021 article “Moving Average Bands.” Here, we present the August 2021 Traders’ Tips code with possible implementations in various software.
You can right-click on any chart to open it in a new tab or window and view it at it’s originally supplied size, often much larger than the version printed in the magazine.
The Traders’ Tips section is provided to help the reader implement a selected technique from an article in this issue or another recent issue. The entries here are contributed by software developers or programmers for software that is capable of customization.

TradeStation: August 2021
In “Moving Average Bands” (part 1, July 2021 issue) and “Moving Average Band Width” (part 2, August 2021 issue), author Vitali Apirine explains how moving average bands (MAB) can be used as a trend-following indicator by displaying the movement of a shorter-term moving average in relation to the movement of a longer-term moving average. The distance between the bands will widen as volatility increases and will narrow as volatility decreases. In part 2, the moving average band width (MABW) measures the percentage difference between the bands. Changes in this difference may indicate a forthcoming move or change in the trend.
Provided here is the EasyLanguage code for both MAB and MABW.
Indicator:  TASC AUG 2021 MAB
// TASC AUG 2021
// Part 1: Trading Bands For Trends
// Moving Average Bands (MAB)
// COPYRIGHT VITALI APIRINE 2021

inputs:
	int Periods1( 50 ),
	int Periods2( 10 ),
	double Mltp( 1 );

variables:
	MA1( 0 ),
	MA2( 0 ),
	Dev( 0 ),
	Dst( 0 ),
	DV( 0 ),
	LowerBand( 0 ),
	UpperBand( 0 );

MA1 = XAverage(Close, Periods1);
MA2 = XAverage(Close, Periods2);
Dst = MA1 - MA2;
DV = Summation(Dst * Dst, Periods2) / Periods2;
Dev = SquareRoot(DV) * Mltp;
UpperBand = MA1 + Dev;
LowerBand = MA1 - Dev;

Plot1( UpperBand, "UpperBand" );
Plot2( LowerBand, "LowerBand" );
Plot3( MA1, "MidLine" );
Plot4( MA2, "Long Term EMA" );


Indicator:  TASC AUG 2021 MABW
// TASC AUG 2021
// Part 2: A Picture Of Narrowness
// Moving Average Bands (MABW)
// COPYRIGHT VITALI APIRINE 2021

inputs:
	int Periods1( 50 ),
	int Periods2( 10 ),
	double Mltp( 1 );

variables:
	MA1( 0 ),
	MA2( 0 ),
	Dev( 0 ),
	Dst( 0 ),
	DV( 0 ),
	LLV( 0 ),
	BandWidth( 0 ),
	LowerBand( 0 ),
	UpperBand( 0 );

MA1 = XAverage(Close, Periods1);
MA2 = XAverage(Close, Periods2);
Dst = MA1 - MA2;
DV = Summation(Dst * Dst, Periods2) / Periods2;
Dev = SquareRoot(DV) * Mltp;
UpperBand = MA1 + Dev;
LowerBand = MA1 - Dev;
BandWidth =(UpperBand - LowerBand) / MA1 * 100;
LLV = Lowest(BandWidth, Periods1);

Plot1( BandWidth, "BandWidth" );
Plot2( LLV, "LLV" ); {Low MABW Line}
A sample chart is shown in Figure 1.

FIGURE 1: TRADESTATION. Shown here is a daily chart of the Russell 2000 index with the indicators applied.
This article is for informational purposes. No type of trading or investment recommendation, advice, or strategy is being made, given, or in any manner provided by TradeStation Securities or its affiliates.
—John Robinson
TradeStation Securities, Inc.
www.TradeStation.com
BACK TO LIST

thinkorswim: August 2021
We have put together a couple of studies based on a pair of articles by Vitali Apirine appearing in the July 2021 issue (“Moving Average Bands, part 1)” and August 2021 issue (“Moving Average Band Width, part 2).” We built the indicators referenced in the articles by using our proprietary scripting language, thinkscript. To ease the loading process, simply click on https://tos.mx/jSJKR4c or enter it into the address into setup→open shared item from within thinkorswim then choose view thinkScript study and name it “MovAvgBands” or a name you like and can identify it by. The second study for the moving average band width can be found from this link: https://tos.mx/OZr9CI5. Follow the same instructions as for the first study, but label it with the name “MovAvgBandWidth.”
Figure 2 shows the MovAvgBands as an upper study and the MovAvgBandsWidth as a lower study on a 15-year weekly timeframe chart of SPX. Please see the articles by Vitali Apirine for more information on how to interpret these studies.

FIGURE 2: THINKORSWIM. The example chart shows the MovAvgBands as an upper study and the MovAvgBandsWidth as a lower study on a 15-year weekly timeframe chart of SPX.
—thinkorswim
A division of TD Ameritrade, Inc.
www.thinkorswim.com
BACK TO LIST

eSIGNAL: August 2021
For this month’s Traders’ Tip, we’ve provided the study MovingAverageBandWidth.efs based on the article in this issue by Vitali Apirine, “Moving Average Band Width (part 2).” (For the eSignal study based on part 1 of Apirine’s article on moving average bands, which appeared in the July 2021 issue, please see the July 2021 Traders’ Tips section, or visit our EFS library discussion board forum under the forums link from the support menu at www.esignal.com or visit our EFS KnowledgeBase at https://www.esignal.com/support/kb/efs.)
The study contains formula parameters that may be configured through the edit chart window (right-click on the chart and select “edit chart”). A sample chart is shown in Figure 3.

FIGURE 3: ESIGNAL. Here is an example of the study plotted on a daily chart of $INDU.
/**********************************
Provided By:
Copyright 2019 Intercontinental Exchange, Inc. All Rights Reserved.
eSignal is a service mark and/or a registered service mark of Intercontinental Exchange, Inc.
in the United States and/or other countries. This sample eSignal Formula Script (EFS)
is for educational purposes only.
Intercontinental Exchange, Inc. reserves the right to modify and overwrite this EFS file with each new release.

Description:
    Moving Average Band Width
    by Vitali Apirine


Version:            1.00  06/16/2021

Formula Parameters:                    Default:
Period1                                50
Period2                                10
Mltp                                   1

Notes:
The related article is copyrighted material. If you are not a subscriber
of Stocks & Commodities, please visit www.traders.com.

**********************************/
var fpArray = new Array();
var bInit = false;

function preMain() {
    setStudyTitle("Moving Average Band Width");
    setCursorLabelName("MABW", 0);
    setCursorLabelName("LLV", 1);
    setPriceStudy(false);
    setDefaultBarFgColor(Color.RGB(0x00,0x94,0xFF), 0);
    setDefaultBarFgColor(Color.green, 1);
    setPlotType( PLOTTYPE_LINE , 0 );
    setPlotType( PLOTTYPE_LINE , 1 );
    setDefaultBarStyle(PS_DASH, 1);


    var x=0;
    fpArray[x] = new FunctionParameter("Periods1", FunctionParameter.NUMBER);
	with(fpArray[x++]){
        setLowerLimit(1);
        setDefault(50);
    }
    fpArray[x] = new FunctionParameter("Periods2", FunctionParameter.NUMBER);
	with(fpArray[x++]){
        setLowerLimit(1);
        setDefault(10);
    }
    fpArray[x] = new FunctionParameter("Mltp", FunctionParameter.NUMBER);
	with(fpArray[x++]){
        setLowerLimit(0);
        setDefault(1);
    }

}

var bVersion = null;
var MA1 = null;
var MA2 = null;
var xDst = null;
var xClose = null;
var xDV = null;
var xDev = null;
var xBNDW = null;


function main(Periods1, Periods2, Mltp) {
    if (bVersion == null) bVersion = verify();
    if (bVersion == false) return;

    if ( bInit == false ) {
        xClose = close();
        MA1 = ema(Periods1, xClose);
        MA2 = ema(Periods2, xClose);
        xDst = efsInternal('Calc_Dst', MA1, MA2);
        xDV = efsInternal('Calc_DV', xDst, Periods2);
        xDev = efsInternal('Calc_Dev', xDV, Mltp);
        xBNDW = efsInternal('Calc_BNDW', MA1, xDev);

        bInit = true;
    }

    if (getCurrentBarCount() <= (Periods1 + Periods2)) return;

    return [xBNDW.getValue(0), llv(Periods1, xBNDW)]
}

function Calc_BNDW(MA1, xDev){
    var ret = 0;
    UPBND = MA1.getValue(0) + xDev.getValue(0);
    DWNBND = MA1.getValue(0) - xDev.getValue(0);
    ret = (UPBND - DWNBND) / MA1.getValue(0) * 100;
    return ret;
}

function Calc_Dev(xDV, Mltp){
    var ret = 0;
    ret = Math.sqrt(xDV.getValue(0)) * Mltp;
    return ret;
}

function Calc_DV(xDst, Periods2){
    var Sum = 0;
    for (var i = 0; i < Periods2; i++){
        Sum = Sum + Math.pow(xDst.getValue(-i), 2)
    }
    var ret = Sum / Periods2;
    return ret;
}

function Calc_Dst(MA1, MA2){
    return (MA1.getValue(0) - MA2.getValue(0));
}

function verify(){
    var b = false;
    if (getBuildNumber() < 779){

        drawTextAbsolute(5, 35, "This study requires version 10.6 or later.",
            Color.white, Color.blue, Text.RELATIVETOBOTTOM|Text.RELATIVETOLEFT|Text.BOLD|Text.LEFT,
            null, 13, "error");
        drawTextAbsolute(5, 20, "Click HERE to upgrade.@URL=https://www.esignal.com/download/default.asp",
            Color.white, Color.blue, Text.RELATIVETOBOTTOM|Text.RELATIVETOLEFT|Text.BOLD|Text.LEFT,
            null, 13, "upgrade");
        return b;
    }
    else
        b = true;

    return b;
}
To discuss this study or download a complete copy of the formula code, please visit the EFS library discussion board forum under the forums link from the support menu at www.esignal.com or visit our EFS KnowledgeBase at https://www.esignal.com/support/kb/efs. The eSignal formula script (EFS) is also shown above.
—Eric Lippert
eSignal, an Interactive Data company
800 779-6555, www.eSignal.com
BACK TO LIST

Wealth-Lab.com: August 2021
We have added the moving average bands and moving average band width indicators to Wealth-Lab 7 for the convenience of our users. We’ll show how Wealth-Lab’s building blocks feature makes it easy to set up trading systems. For a description of the two indicators, see Vitali Apirine’s articles in this issue (August 2021 issue) and last month’s issue (July 2021 issue).
The first example system demonstrated here, which is a simple trend-following system using MA bands, is based on the premise that the moving average band boundaries can be used to help identify uptrends and downtrends:
Example system 1 rules
- Enter when the 10-day moving average (EMA) breaks above the upper MA band
- Exit when the EMA crosses below the lower MA band
Figure 4 demonstrates using Wealth-Lab’s building blocks for the example system. Figure 5 shows a chart of the referenced bands plotted on the SPY.
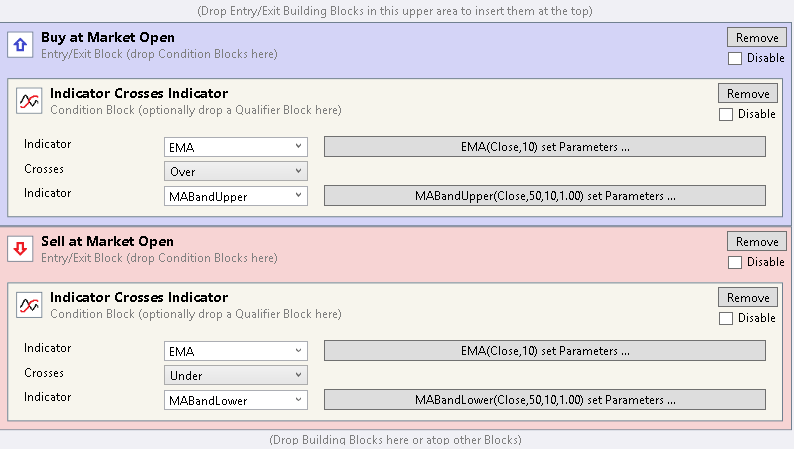
FIGURE 4: WEALTH-LAB. This shows an example of constructing example system 1 by using Wealth-Lab’s building blocks feature.
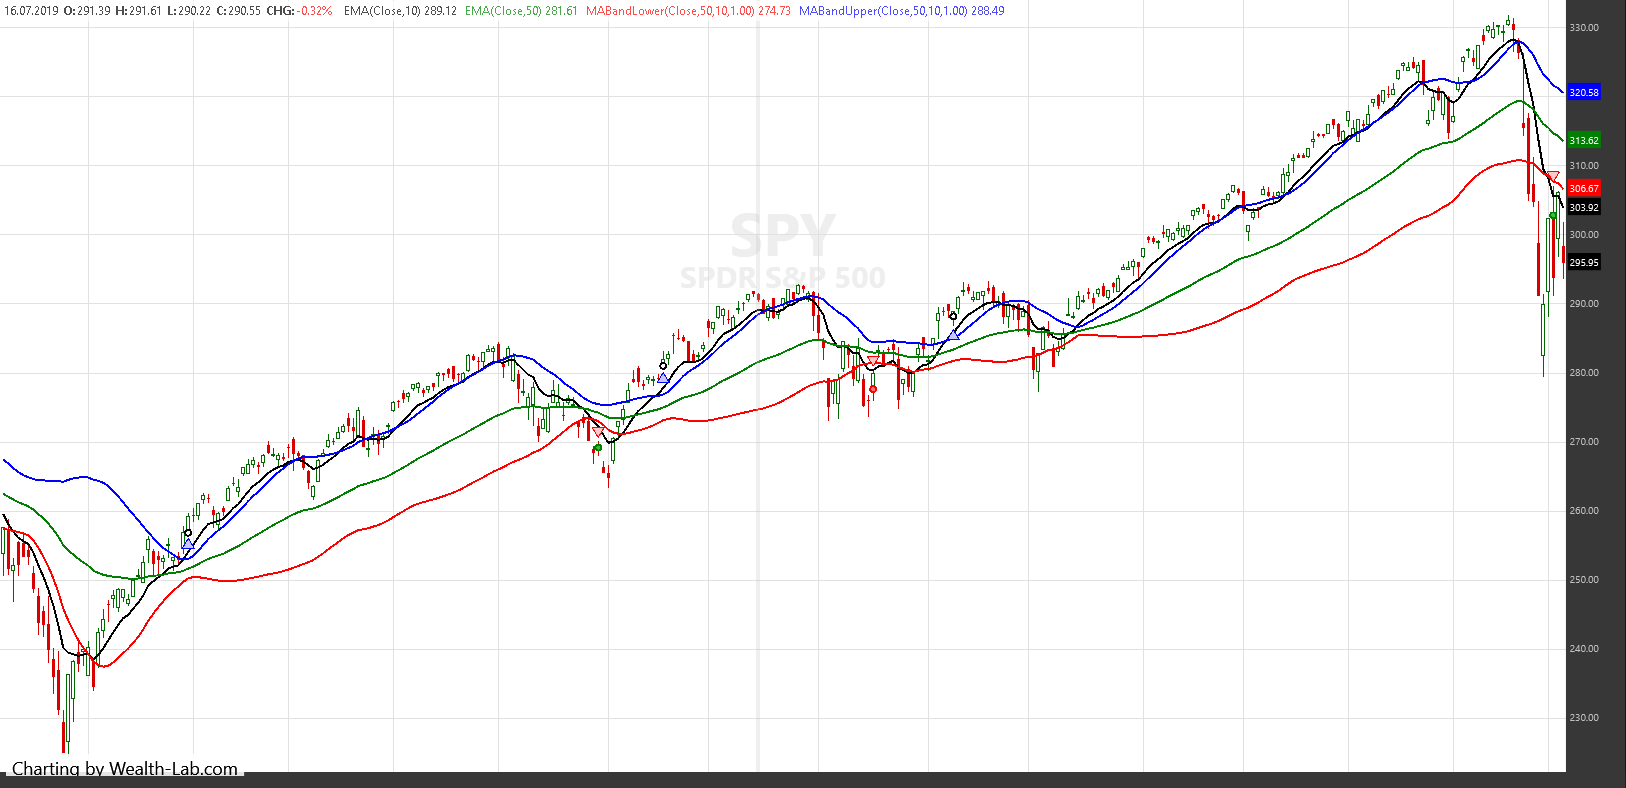
FIGURE 5: WEALTH-LAB. This chart shows some sample trade signals for example system 1 on a chart of SPY.
Band width indicators help identify consolidation patterns, which may lead to powerful breakouts. Typically, consolidation manifests itself as a narrowness followed by a short moving average cross above the upper band. As such a pattern takes some time to form, it may have already ended by the time a breakout happens.
The time diversity of the two events usually makes programming the idea less straightforward. But in Wealth-Lab, users can quickly build the trading system without having to code as follows:
Example system 2 rules
- Enter when the 10-day moving average (EMA) breaks above the upper MA band, preceded by the moving average band width (MABW) making a 20-day lowest low at least once within the last 10 days
- Exit on a trailing stop of 3 ATRs (14-day) from the trade’s highest point
Figure 6 demonstrates using Wealth-Lab’s building blocks to set up the MABW indicator. Figure 7 shows an example of implementing the MABW indicator on a chart of SPY.
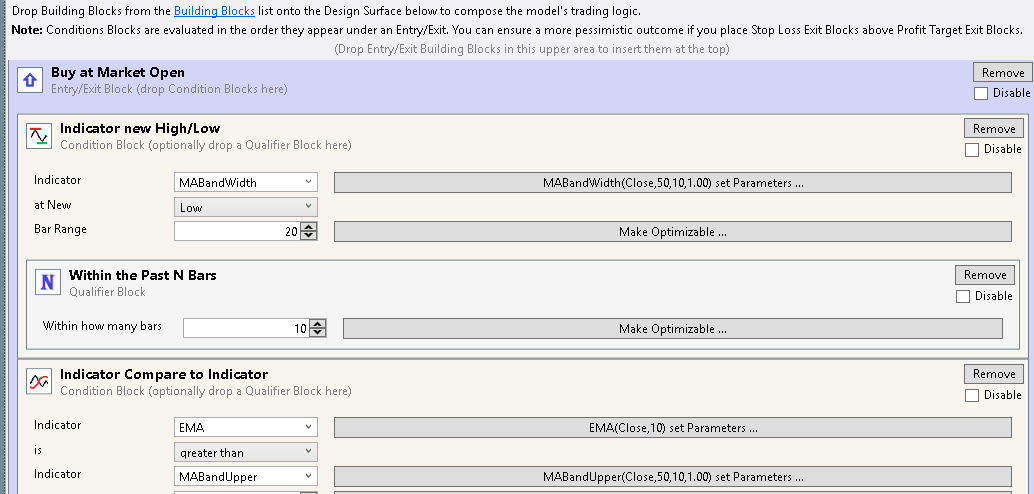
FIGURE 6: WEALTH-LAB. This shows an example of constructing example system 2 by using Wealth-Lab’s building blocks feature.
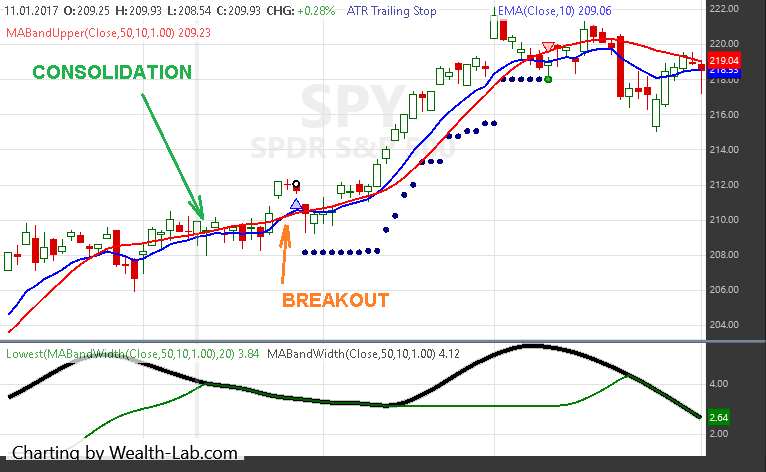
FIGURE 7: WEALTH-LAB. This chart shows some sample trade signals for example system 2 on a chart of SPY. Note how the consolidation and breakout events are spread out in time.
—Gene Geren (Eugene)
Wealth-Lab team
www.wealth-lab.com
BACK TO LIST

NinjaTrader: August 2021
The moving average band (MAB) and moving average band width (MABW) indicators discussed in the July 2021 and August 2021 S&C articles by Vitali Apirine (“Moving Average Bands, Part 1” and “Moving Average Band Width, Part 2”) are available for download at the following links for NinjaTrader 8 and NinjaTrader 7:
Once the file is downloaded, you can import the indicators into NinjaTrader 8 from within the control center by selecting Tools → Import → NinjaScript Add-On and then selecting the downloaded file for NinjaTrader 8. To import into NinjaTrader 7, from within the control center window, select the menu File → Utilities → Import NinjaScript and select the downloaded file.
You can review the source code for both indicators in NinjaTrader 8 by selecting the menu New → NinjaScript Editor → Indicators from within the control center window and selecting the MAB or MABW file. You can review the indicators’ source code in NinjaTrader 7 by selecting the menu Tools → Edit NinjaScript → Indicator from within the control center window and selecting the MAB or MABW file
A sample chart is shown in Figure 8.

FIGURE 8: NINJATRADER. The NYSE Composite Index is shown in the upper pane with MAB(50,10,1) in the middle pane. The MABW(50,10,1) is in the lower pane (January–October 2017).
—Kate Windheuser
NinjaTrader, LLC
www.ninjatrader.com
BACK TO LIST

Neuroshell Trader: August 2021
The moving average bands and band width indicators described in Vitali Apirine’s two-part article appearing between last issue and this issue can be easily implemented in NeuroShell Trader by combining a few of the NeuroShell Trader’s 800+ indicators. To implement the indicators, select “new indicator” from the insert menu and use the indicator wizard to set up the following indicators:
Dst:	Sub( ExpAvg(Close,50), ExpAvg(Close, 10))
Dev:	Mul2( SqrRt( Divide( Sum( Pow( Dst, 2), 10), 10)), 1 )
UpBnd:	Add2( ExpAvg(Close,50), Dev )
DwnBnd:	Sub( ExpAvg(Close,50), Dev )
BndW:	Mul2( Divide( Dev, ExpAvg(Close,50) ), 200 )
NeuroShell Trader users can go to the Stocks & Commodities section of the NeuroShell Trader free technical support website to download a copy of this or any previous Traders’ Tips.

FIGURE 9: NEUROSHELL TRADER. This NeuroShell Trader chart shows the moving average bands (MAB) and band width (MABW) indicators on the S&P 500 (SPY).
—Ward Systems Group, Inc.
sales@wardsystems.com
www.neuroshell.com
BACK TO LIST

Optuma: August 2021
Provided here is code for use in Optuma based on the two-part article by Vitali Apirine on moving average bands and moving average band width (“Moving Average Bands,” part 1, July 2021 issue, and “Moving Average Band Width,” part 2, August 2021 issue).
Figure 10 shows the moving average bands (MAB 50,10) displayed in a pane above a chart of the SPY. Figure 11 shows the moving average band width indicator (MABW 50,200) in the upper pane.
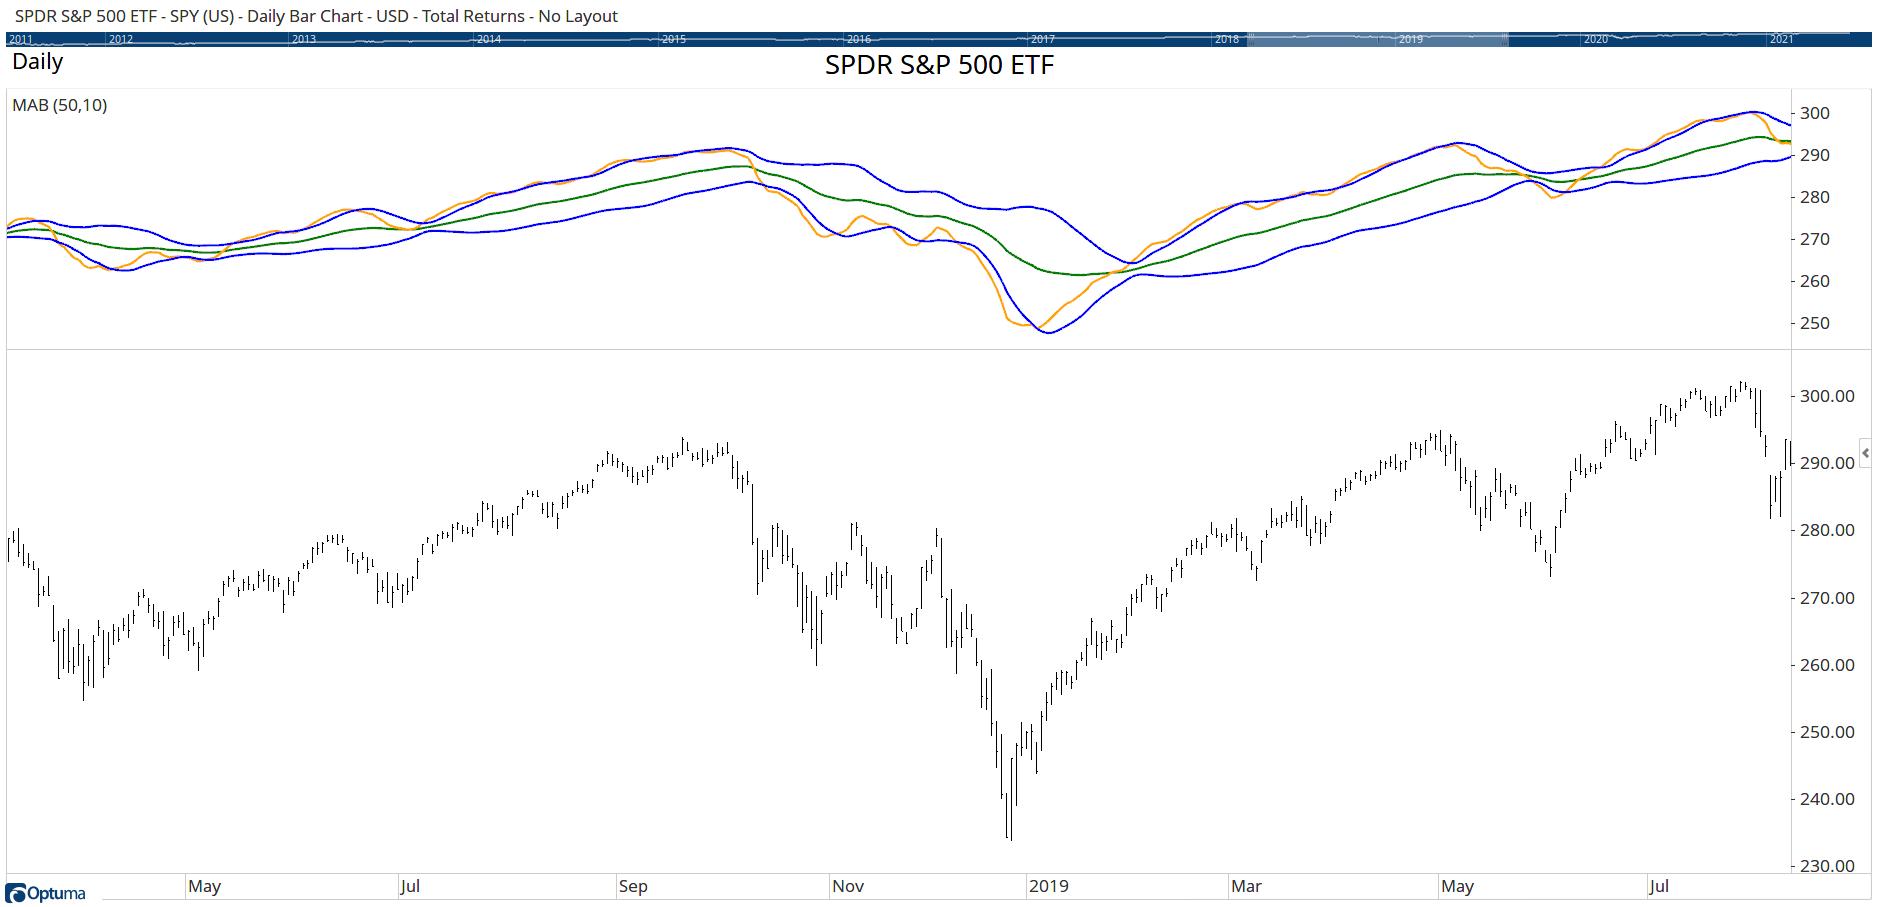
FIGURE 10: OPTUMA. This sample chart displays the moving average bands (MAB 50,10) in a pane above a chart of the SPY.
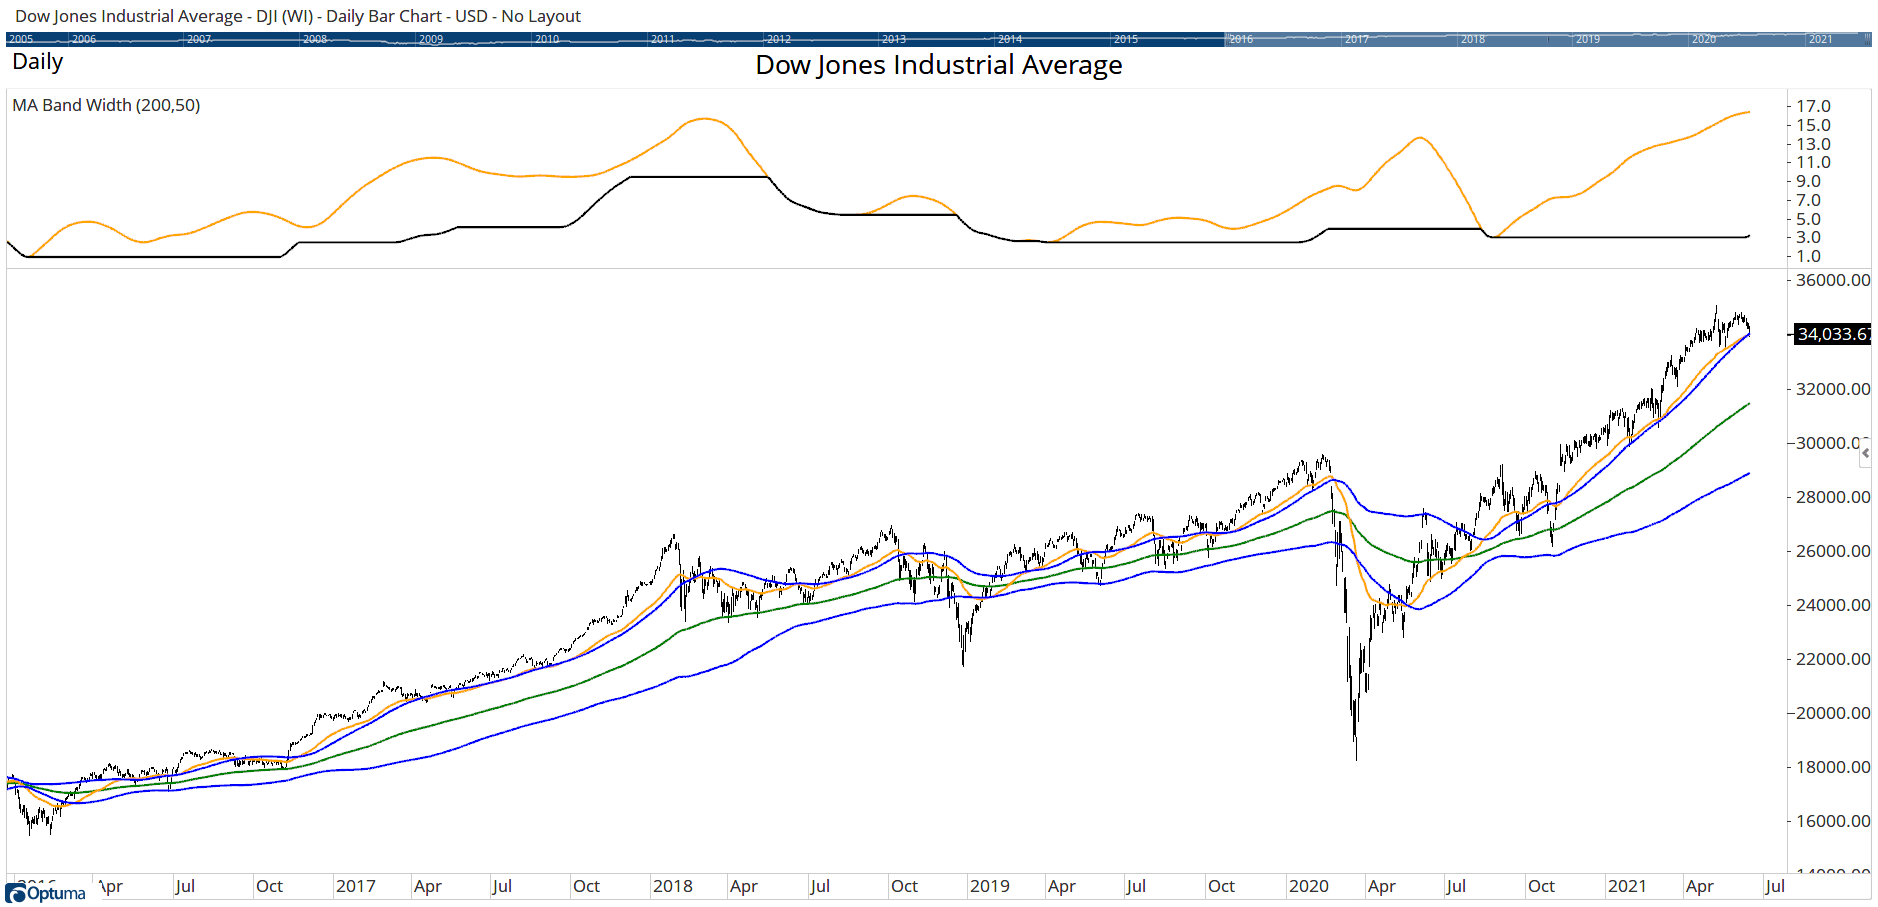
FIGURE 11: OPTUMA. This sample chart displays the moving average band width indicator (MABW 50,200) in the upper pane.
Moving Average Bands:

//Set Periods;
#$BARS1=50;
#$BARS2=10;
//Calc EMAs & Dev;
MA1=MA(STYLE=Exponential, CALC=Close, BARS=$BARS1);
MA2=MA(STYLE=Exponential, CALC=Close, BARS=$BARS2);
DST=MA1-MA2;
D2 = DST * DST;
DV= MA(D2, CALC=Close, BARS=$BARS2);
DEV=SQRT(DV);
//Plot Bands;
Plot1=MA1;
Plot2=MA2;
Plot3=MA1+DEV;
Plot4=MA1-DEV;


Moving Average Band Width:

//Set Periods;
#$BARS1=200;
#$BARS2=50;
//Calc EMAs & Dev;
MA1=MA(STYLE=Exponential, CALC=Close, BARS=$BARS1);
MA2=MA(STYLE=Exponential, CALC=Close, BARS=$BARS2);
DST=MA1-MA2;
D2 = DST * DST;
DV= MA(D2, CALC=Close, BARS=$BARS2);
DEV=SQRT(DV);
//MABW;
UP=MA1+DEV;
DN=MA1-DEV;
MABW=(UP-DN)/MA1 * 100;
LLV = LOWESTLOW(MABW, BARS=$BARS1, INCBAR=True);
Plot1=MABW;
Plot2=LLV;
—support@optuma.com
BACK TO LIST

TradersStudio: August 2021
The importable TradersStudio files based on Vitali Apirine’s two-part article, (“Moving Average Bands,” part 1, July 2021 issue, and “Moving Average Band Width,” part 2, August 2021 issue) can be obtained on request via email to info@TradersEdgeSystems.com. The code is also shown below.
- Function MABW: Computes both the MAB and MABW indicators
- Indicator plot MAB_IND: Plots the MAB on a chart
- Indicator plot MABW_IND: Plots the MABW on a chart
'Moving Average Bands
'Moving Average Band Width
'Author: Vitali Aprine, TASC July & Aug 2021
'Coded by: Richard Denning, 6/21/2021

'MAIN FUNCTION TO COMPUTE BOTH MA BANDS AND MA BAND WIDTH:

Function MABW(len1,len2,mult1,byref MABup,byref MABdn, byref MABmid,byref lowMABW)
'INPUTS: len1 = 50,len2 = 10,mult1 = 1
Dim MA1 As BarArray
Dim MA2 As BarArray
Dim MAdiff As BarArray
Dim DV As BarArray
Dim dev As BarArray

MA1 = XAverage(C,len1)
MA2 = XAverage(C,len2)
MAdiff = MA1 - MA2
DV = Average(MAdiff*MAdiff,len2)
dev = Sqr(DV)*mult1
MABup = MA1 + dev
MABmid = MA1
MABdn = MA1 - dev
If MABmid <> 0 Then
 MABW = (MABup - MABdn) / MABmid * 100
End If
lowMABW = Lowest(MABW,len1)
End Function
'---------------------------------------
'INDICATOR PLOT FOR MA BANDS"

Sub MAB_IND(len1,len2,mult1)
'INPUTS: len1 = 50,len2 = 10,mult1 = 1
Dim MABup
Dim MABdn
Dim MABmid
Dim lowMABW
Dim myMABW
myMABW = MABW(len1,len2,mult1,MABup,MABmid,MABdn,lowMABW)
Plot1(MABup)
plot2(MABmid)
plot3(MABdn)
End Sub
'---------------------------------------
'INDICATOR PLOT FOR MA BAND WIDTH:

Sub MABW_IND(len1,len2,mult1)
'INPUTS: len1 = 50,len2 = 10,mult1 = 1
Dim MABup
Dim MABdn
Dim MABmid
Dim lowMABW
Dim myMABW
myMABW = MABW(len1,len2,mult1,MABup,MABmid,MABdn,lowMABW)
Plot1(myMABW)
plot2(lowMABW)
End Sub
'---------------------------------------
Figure 12 shows both indicators on a chart of Apple Inc. (AAPL) during 2013.

FIGURE 12: TRADERSSTUDIO. Both the MAB and MABW indicators are shown on a chart of Apple Inc. (AAPL) during 2013.
—Richard Denning
info@TradersEdgeSystems.com
for TradersStudio
BACK TO LIST

AIQ: August 2021
The importable AIQ EDS file based on Vitali Apirine’s two-part article, (“Moving Average Bands,” part 1, July 2021 issue, and “Moving Average Band Width,” part 2, August 2021 issue) can be obtained on request via email to info@TradersEdgeSystems.com. The code is also shown below.
!Moving Average Bands
!Moving Average Band Width
!Author: Vitali Aprine, TASC July & Aug 2021
!Coded by: Richard Denning, 6/14/2021

!INPUTS:
Len1 is 50.
Len2 is 10.
Mult1 is 1.
C is [close].

MA1 is expavg(C,Len1).
MA2 is expavg(C,Len2).
MAdiff is MA1 - MA2.
DV is sum(MAdiff*MAdiff,Len2) / Len2.
Dev is sqrt(DV)*Mult1.
MABup is MA1 + Dev.
MABmid is MA1.
MABdn is MA1 - Dev.
MABW is (MABup - MABdn) / MABmid * 100.
LowMABW is lowresult(MABW,Len1).
Figure 13 shows the MAB and MABW indicators on a chart of Apple, Inc. (AAPL).

FIGURE 13: AIQ. This shows the MAB and MABW indicators on a chart of Apple, Inc. (AAPL).
—Richard Denning
info@TradersEdgeSystems.com
for AIQ Systems
BACK TO LIST

The Zorro Project: August 2021
Compared to plain indicators, bands have the advantage that they look more colorful on charts. Additionally, they offer two more lines for triggering trade signals. In his article in the July 2021 issue, “Moving Average Bands (part 1),” Vitali Apirine presents a variation on Bollinger Bands based on the difference between two exponential moving averages. The code in C to recreate the described bands for use on the Zorro platform is as follows:
var MAB(int Period1,int Period2,var Mltp)
{
  var MA1 = EMA(seriesC(),Period1);
  var MA2 = EMA(seriesC(),Period2);
  var Dst = MA1-MA2;
  var Dv = SMA(series(Dst*Dst),Period2);
  var Dev = sqrt(Dv)*Mltp;
  rRealMiddleBand = MA1;
  rRealUpperBand = MA1+Dev;
  rRealLowerBand = MA1-Dev;
  return MA2;
}
The three variables rRealMiddleBand, rRealUpperBand, rRealLowerBand are predefined variables for band indicators. Here is code in C to replicate the author’s chart:
function run()
{
  StartDate = 20111201;
  EndDate = 20130815;
  BarPeriod = 1440;
  LookBack = 300;

  asset("NAS100");
  var Signal = MAB(200,50,1);
  plot("MA2",Signal,LINE,BLUE);
  plot("MAB1",rRealUpperBand,BAND1,RED);
  plot("MAB2",rRealLowerBand,BAND2,RED|TRANSP);
}
This code generates the chart shown in Figure 14 of the Nasdaq index from 2012 to mid-2013 with the parameters (200,50,1) for the slow and fast MA and the deviation multiplier.
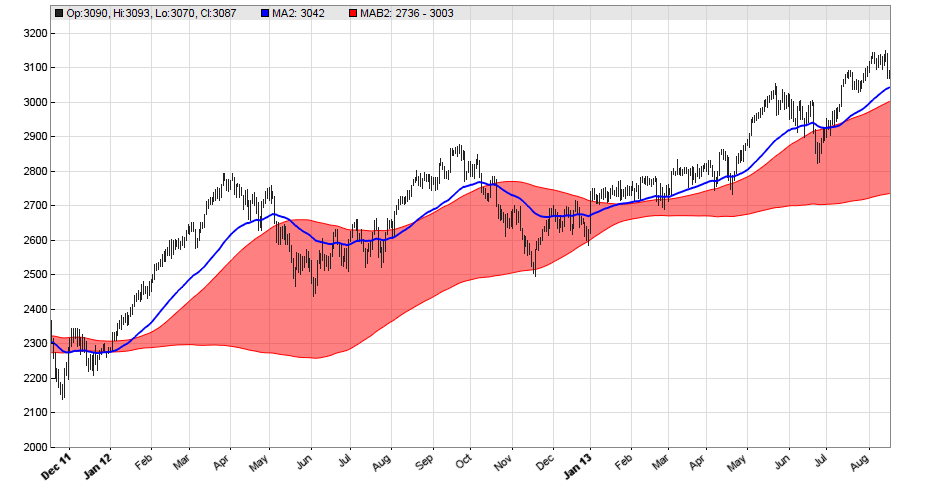
FIGURE 14: ZORRO PROJECT. Moving average bands are shown on a chart of the Nasdaq index from 2012 to mid-2013 with parameters (200,50,1) for the slow and fast MA and the deviation multiplier.
The blue line is the fast MA. The author suggests using the crossing of this line with the upper and lower band for buy and sell signals. We can put that to the test by adding the following code:
vars Signals = series(Signal);
MaxLong = MaxShort = 1;
if(crossOver(Signals,rRealUpperBand))
  enterLong();
if(crossUnder(Signals,rRealUpperBand))
  exitLong();
if(crossUnder(Signals,rRealLowerBand))
  enterShort();
if(crossOver(Signals,rRealLowerBand))
  exitShort();
Figure 15 shows the equity curve from 14 trade signals between 2011 and 2021 using the same MAB parameters shown in the article. This bumpy system would require strong nerves, since it twice lost almost all its capital. But as the author states in his article, you need a lot more indicators on your chart when you really want to trade with moving average bands.
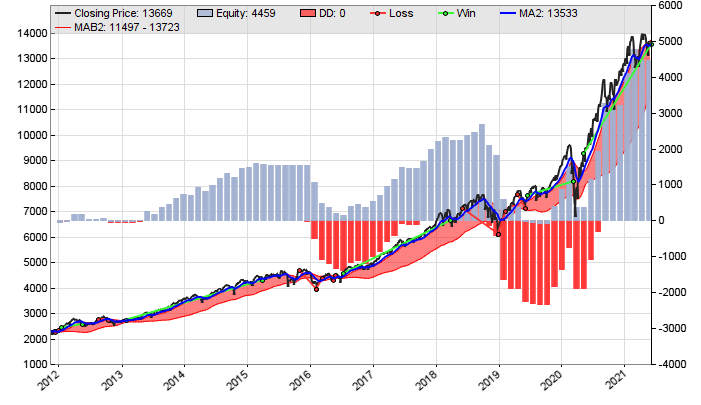
FIGURE 15: ZORRO PROJECT. A sample equity curve is shown from 14 trade signals between 2011 and 2021 using the same MAB parameters.
In part 2 of the article (“Moving Average Band Width”) in this issue, Vitali Apirine suggests using the width of the band as an additional indicator for helping to spot trend changes or consolidations. The following additional code plots the band width and its lowest value within the last slow period:
var Bndw = 100*(rRealUpperBand-rRealLowerBand)/rRealMiddleBand;
plot("Width",Bndw,NEW|LINE,RED);
plot("Low",MinVal(series(Bndw),200),LINE,BLACK);
The chart in Figure 16 displays the band width (red) and its 200-day low (black) in the additional window below the main chart.
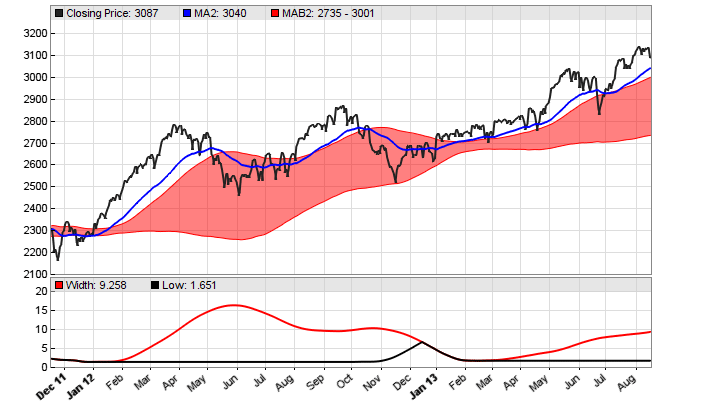
FIGURE 16: ZORRO PROJECT. The band width (red) and its 200-day low (black) are displayed in the window below the main chart.
The MA bands indicator and sample system can be downloaded from the 2021 script repository on https://financial-hacker.com. The Zorro platform can be downloaded from https://zorro-project.com.
—Petra Volkova
The Zorro Project by oP group Germany
https://zorro-project.com
BACK TO LIST

Trade Navigator: August 2021
Users of Trade Navigator can download the library file named “SC202108,” which contains a template named “S&C moving average bands” and the following indicators: MABW, Lowest MAB, Upper MAB, Lower MAB, Mid MAB, and MAB2.
For your convenience, we created the template in the library file so that you can modify the chart with a pre-built indicator package and settings. To use the template (Figure 17), open the charting pulldown menu and select the templates command. Then select the “S&C moving average bands” template.
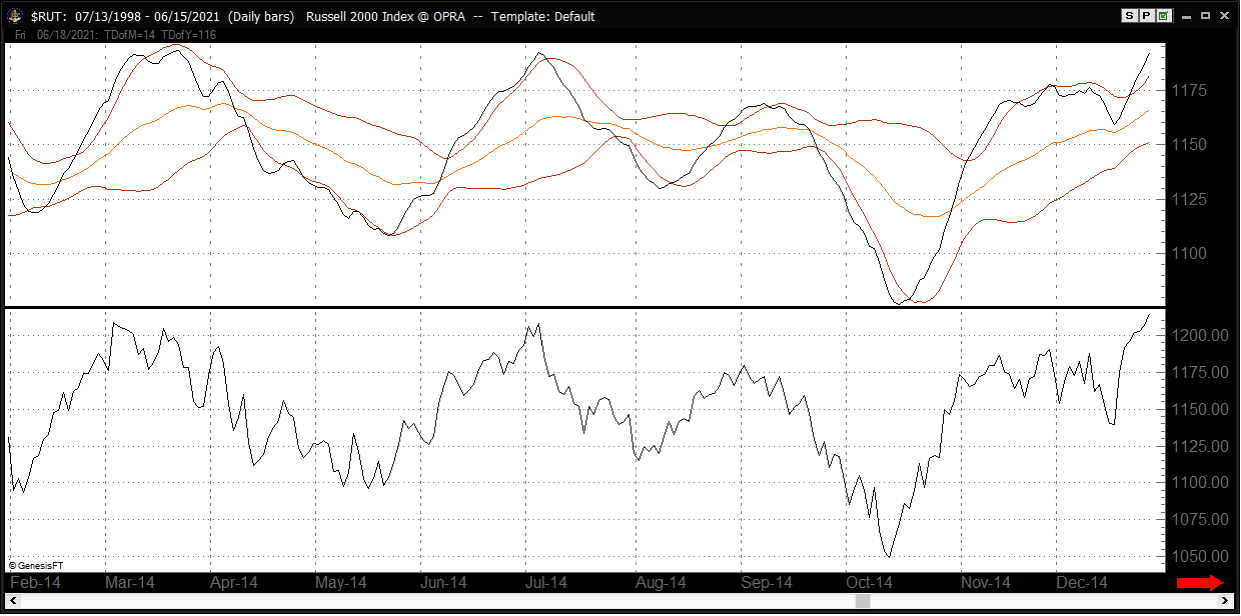
FIGURE 17: TRADE NAVIGATOR. The modifiable chart template is available for download.
You can add the indicators to your chart individually by opening the charting dropdown menu and selecting the add to chart command. Then on the indicators tab, select your named indicator and click add. Repeat for additional indicators if you wish (Figure 18).
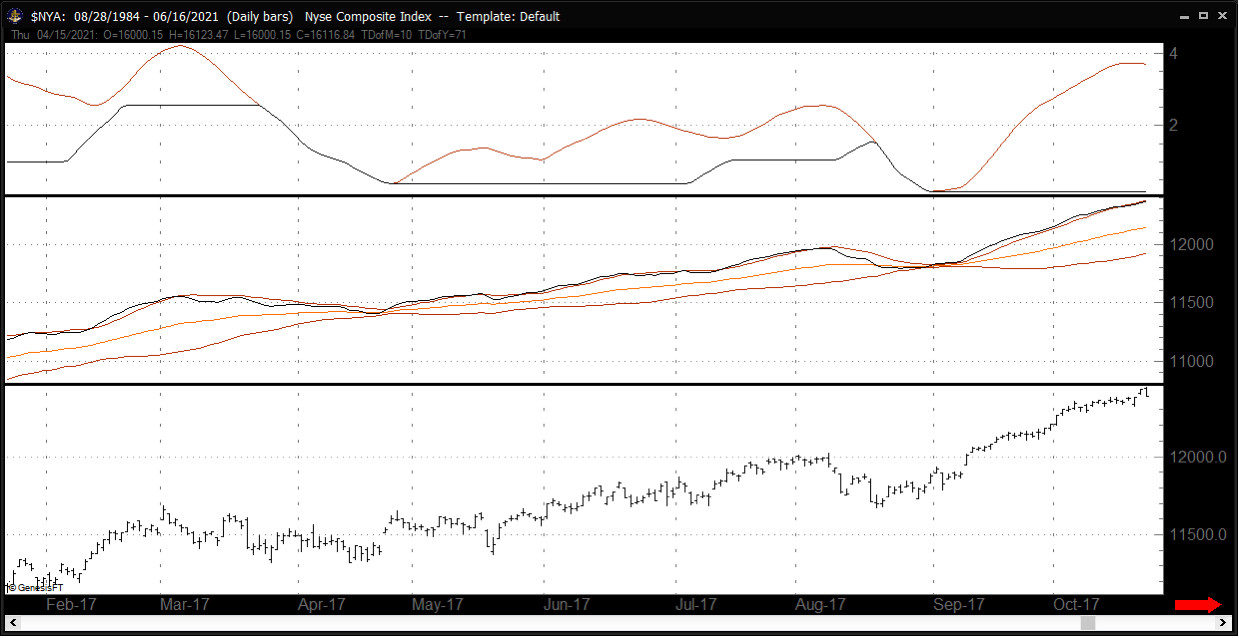
FIGURE 18: TRADE NAVIGATOR. The indicators MABW, lowest MAB, upper MAB, lower MAB, mid MAB, and MAB2 are shown added to a chart.
Customer support is available by phone or by live chat at our website if any assistance is needed.
—Genesis Financial Data
Tech support 719 884-0245
www.TradeNavigator.com
BACK TO LIST
Microsoft Excel: August 2021
The spreadsheet given here is based on Vitali Apirine’s articles on moving average bands and moving average band width (July 2021 and August 2021 issues).
The lookback periods used in the article’s examples suggest that these indicators are aimed at taking a longer view of trending and sideways market periods while ignoring or smoothing over the smaller gyrations.
The two-part article provides us with examples using daily and weekly bars. However, the logic involved will easily accommodate bars at much smaller intervals. So if you have such data available, it should be worth your time to explore at that level.
Trying to cram both indicators into the chart space of my template can make some details difficult to see. But it is worthwhile to see how the significant indicator features play out next to each other (Figure 19). Then, using the buttons to the right of the charts, you may drill down on either indicator as in Figures 20 and 21.

FIGURE 19: EXCEL. This shows an approximation in Excel of Figure 4 from Vitali Apirine’s article in this issue.

FIGURE 20: EXCEL. This shows moving average bands (MAB) on a chart in Excel.

FIGURE 21: EXCEL. This shows the moving average band width (MABW) indicator on a chart in Excel.
While not specifically mentioned in the article, the MetaStock code sidebar contains a scaling factor provision labeled MLTP, which was set to 1. If you have a chart where the bands run close together and it is difficult to see where the short-term average is in relationship to the bands, I found that using a larger MLTP value of 3 or 4 could be used to spread the bands out for a better visual. This indeed increased the values seen on the y-axis for both the bands and the band width charts.
Interestingly, because of the dynamic axis scaling used here, with a larger multiplier value applied, the shapes created by the lines on the band width chart are larger in terms of absolute value but look the same.
To download this spreadsheet: The spreadsheet file for this Traders’ Tip can be downloaded here. To successfully download it, follow these steps:
- Right-click on the Excel file link, then
- Select “save as” (or “save target as”) to place a copy of the spreadsheet file on your hard drive.
—Ron McAllister
Excel and VBA programmer
rpmac_xltt@sprynet.com
BACK TO LIST
Originally published in the August 2021 issue of
Technical Analysis of STOCKS & COMMODITIES magazine.
All rights reserved. © Copyright 2021, Technical Analysis, Inc.


