TRADERS’ TIPS
October 2021

For this month’s Traders’ Tips, the focus is John F. Ehlers’ article in this issue, “Cycle/Trend Analytics And The MAD Indicator.” Here, we present the October 2021 Traders’ Tips code with possible implementations in various software.
New contributor this month: TradingView (Pine code)
You can right-click on any chart to open it in a new tab or window and view it at it’s originally supplied size, often much larger than the version printed in the magazine.
The Traders’ Tips section is provided to help the reader implement a selected technique from an article in this issue or another recent issue. The entries here are contributed by software developers or programmers for software that is capable of customization.

TradingView: October 2021
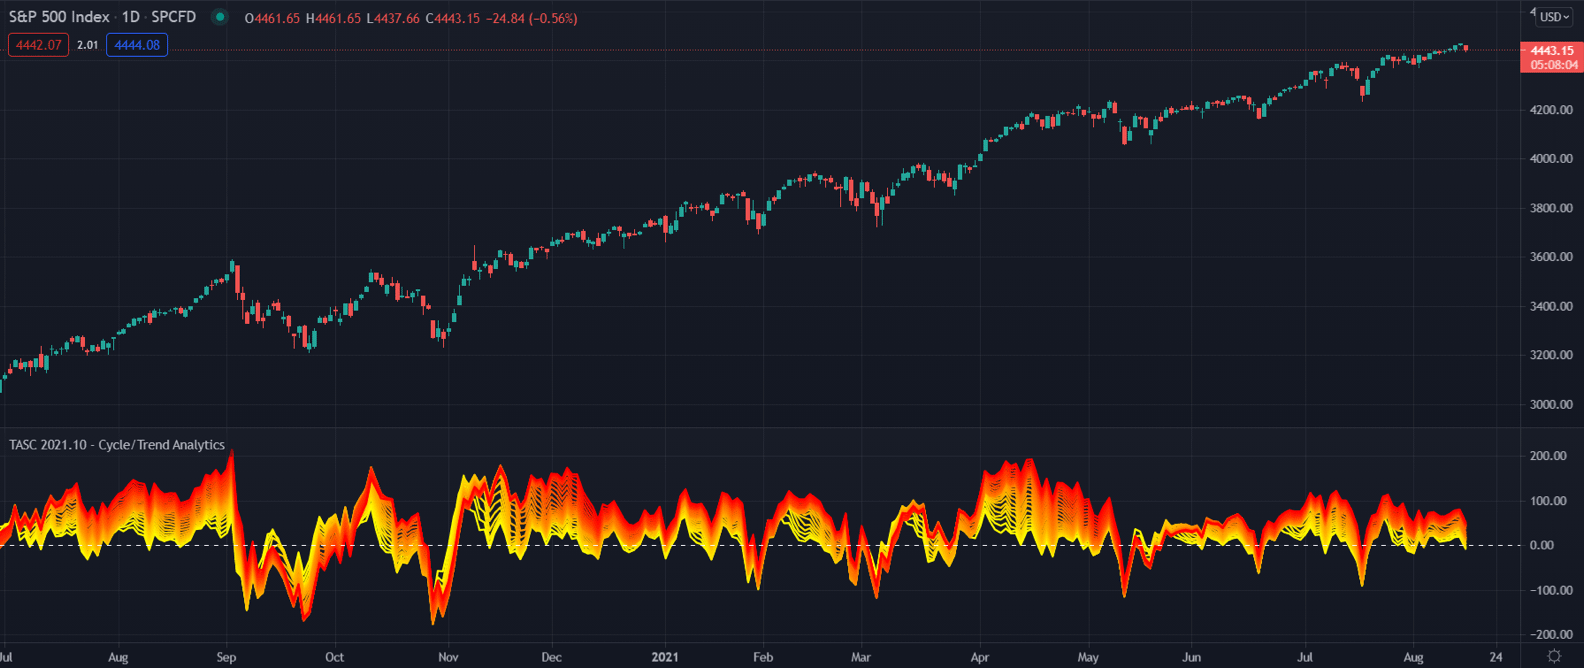
The TradingView Pine code for the cycle/trend analytics indicator presented by John Ehlers in his article in this issue, “Cycle/Trend Analytics And The MAD Indicator,” is as follows:
// (C) 2021 John F. Ehlers
// Translation from EasyLanguage to TradingView's Pine Script by Ricardo Santos, for PineCoders.
//@version=4
study("TASC 2021.10 - Cycle/Trend Analytics")

string i_mode = input("trend", "Mode", options = ["cycle", "trend"])

float cyclePrice = 0.0
float trendPrice = 0.0
color c_cyan  = color.new(#00ffff, 20)

if i_mode == "cycle"
    cyclePrice := sin(360 * bar_index / 30)
    trendPrice := cyclePrice
else if i_mode == "trend"
    cyclePrice := na
    trendPrice := close

plot(trendPrice - sma(trendPrice, 05), "Osc05", color.rgb(255, 306 - 10.2 * 05, 0, 0), 2)
plot(trendPrice - sma(trendPrice, 06), "Osc06", color.rgb(255, 306 - 10.2 * 06, 0, 0), 2)
plot(trendPrice - sma(trendPrice, 07), "Osc07", color.rgb(255, 306 - 10.2 * 07, 0, 0), 2)
plot(trendPrice - sma(trendPrice, 08), "Osc08", color.rgb(255, 306 - 10.2 * 08, 0, 0), 2)
plot(trendPrice - sma(trendPrice, 09), "Osc09", color.rgb(255, 306 - 10.2 * 09, 0, 0), 2)
plot(trendPrice - sma(trendPrice, 10), "Osc10", color.rgb(255, 306 - 10.2 * 10, 0, 0), 2)
plot(trendPrice - sma(trendPrice, 11), "Osc11", color.rgb(255, 306 - 10.2 * 11, 0, 0), 2)
plot(trendPrice - sma(trendPrice, 12), "Osc12", color.rgb(255, 306 - 10.2 * 12, 0, 0), 2)
plot(trendPrice - sma(trendPrice, 13), "Osc13", color.rgb(255, 306 - 10.2 * 13, 0, 0), 2)
plot(trendPrice - sma(trendPrice, 14), "Osc14", color.rgb(255, 306 - 10.2 * 14, 0, 0), 2)
plot(trendPrice - sma(trendPrice, 15), "Osc15", color.rgb(255, 306 - 10.2 * 15, 0, 0), 2)
plot(trendPrice - sma(trendPrice, 16), "Osc16", color.rgb(255, 306 - 10.2 * 16, 0, 0), 2)
plot(trendPrice - sma(trendPrice, 17), "Osc17", color.rgb(255, 306 - 10.2 * 17, 0, 0), 2)
plot(trendPrice - sma(trendPrice, 18), "Osc18", color.rgb(255, 306 - 10.2 * 18, 0, 0), 2)
plot(trendPrice - sma(trendPrice, 19), "Osc19", color.rgb(255, 306 - 10.2 * 19, 0, 0), 2)
plot(trendPrice - sma(trendPrice, 20), "Osc20", color.rgb(255, 306 - 10.2 * 20, 0, 0), 2)
plot(trendPrice - sma(trendPrice, 21), "Osc21", color.rgb(255, 306 - 10.2 * 21, 0, 0), 2)
plot(trendPrice - sma(trendPrice, 22), "Osc22", color.rgb(255, 306 - 10.2 * 22, 0, 0), 2)
plot(trendPrice - sma(trendPrice, 23), "Osc23", color.rgb(255, 306 - 10.2 * 23, 0, 0), 2)
plot(trendPrice - sma(trendPrice, 24), "Osc24", color.rgb(255, 306 - 10.2 * 24, 0, 0), 2)
plot(trendPrice - sma(trendPrice, 25), "Osc25", color.rgb(255, 306 - 10.2 * 25, 0, 0), 2)
plot(trendPrice - sma(trendPrice, 26), "Osc26", color.rgb(255, 306 - 10.2 * 26, 0, 0), 2)
plot(trendPrice - sma(trendPrice, 27), "Osc27", color.rgb(255, 306 - 10.2 * 27, 0, 0), 2)
plot(trendPrice - sma(trendPrice, 28), "Osc28", color.rgb(255, 306 - 10.2 * 28, 0, 0), 2)
plot(trendPrice - sma(trendPrice, 29), "Osc29", color.rgb(255, 306 - 10.2 * 29, 0, 0), 2)
plot(trendPrice - sma(trendPrice, 30), "Osc30", color.rgb(255, 306 - 10.2 * 30, 0, 0), 2)

plot(cyclePrice, "Cycle Price", c_cyan, 3)
plot(sma(cyclePrice, 5) - sma(cyclePrice, 30), "MA delta", color.green, 3)
hline(0, "Zero", color.white)
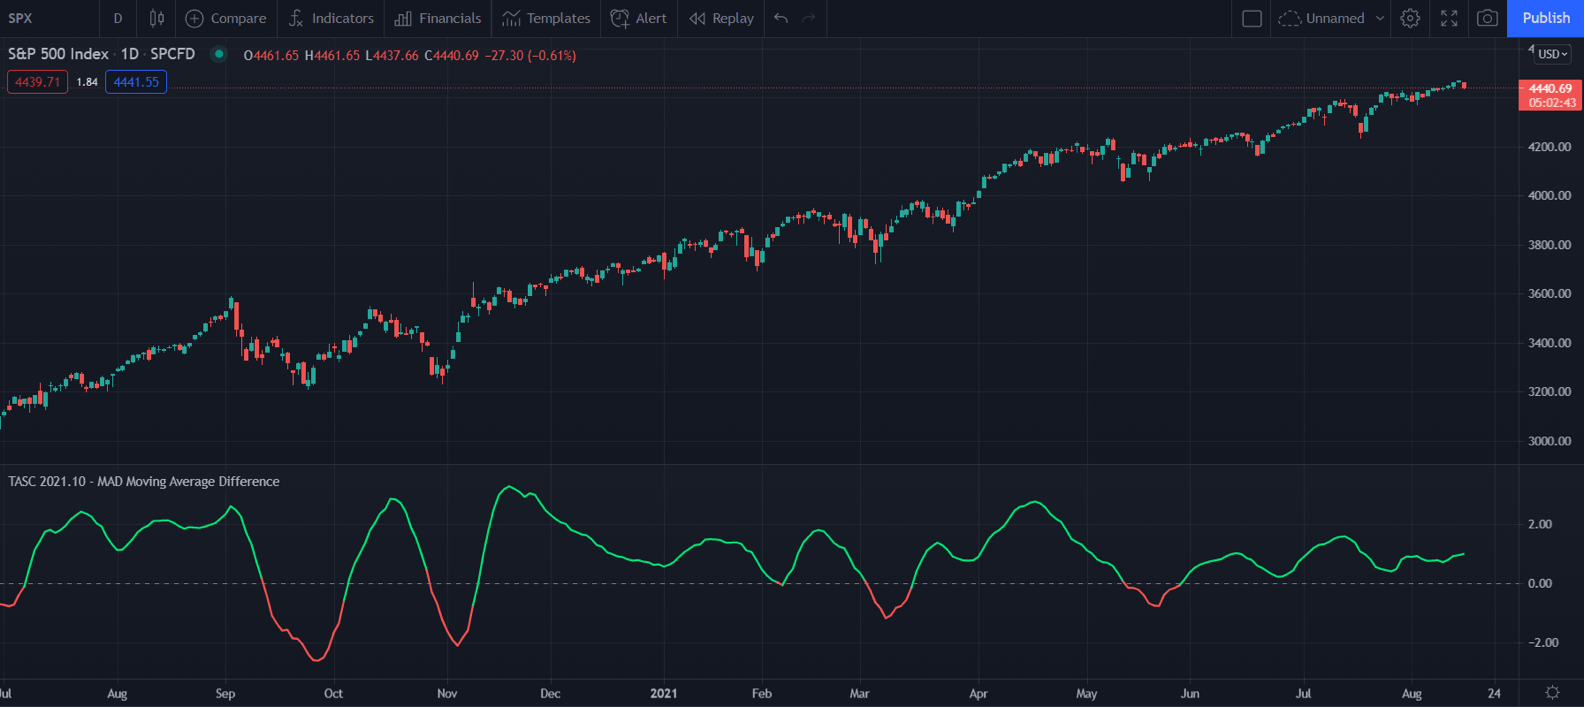
The Pine code for the MAD indicator presented by John Ehlers in his article in this issue is as follows:
//@version=4
// (C) 2021 John F. Ehlers
// Translation from EasyLanguage to TradingView's Pine Script by Ricardo Santos, for PineCoders.
study("TASC 2021.10 - MAD Moving Average Difference")
int i_shortLength = input(8, "Short Length")
int i_longLength  = input(23, "Long Length")

float shortAvg = sma(close, i_shortLength)
float longAvg  = sma(close, i_longLength)
float mad = 100 * (shortAvg - longAvg) / longAvg

plot(mad, "MAD", mad > 0 ? color.lime : color.red, 2)
hline(0, "Zero")
These indicators are available on TradingView at:
tradingview.com/u/PineCodersTASC/#published-scripts
—TradingView
https://www.tradingview.com
BACK TO LIST

eSignal: October 2021
For this month’s Traders’ Tip, we’ve provided the CycleTrend Analytics.efs and Moving Average Difference Indicator.efs studies based on the article in this issue by John Ehlers, “Cycle/Trend Analytics And The MAD Indicator.” These studies, in combination, create a trend indicator that is simple and robust.
The study contains formula parameters that may be configured through the edit chart window (right-click on the chart and select “edit chart”). A sample chart is shown in Figure 3.

FIGURE 3: eSIGNAL. Here is an example of the studies plotted on a daily chart of SPY.
To discuss this study or download a complete copy of the formula code, please visit the EFS library discussion board forum under the forums link from the support menu at www.esignal.com or visit our EFS KnowledgeBase at www.esignal.com/support/kb/efs. The eSignal formula script (EFS) is also available for copying & pasting below.
/**********************************
Provided By:
Copyright 2019 Intercontinental Exchange, Inc. All Rights Reserved.
eSignal is a service mark and/or a registered service mark of Intercontinental Exchange, Inc.
in the United States and/or other countries. This sample eSignal Formula Script (EFS)
is for educational purposes only.
Intercontinental Exchange, Inc. reserves the right to modify and overwrite this EFS file with each new release.

Description:
    Cycle/Trend Analytics And The MAD Indicator
    by John F. Ehlers


Version:            1.00  08/12/2021

Formula Parameters:                    Default:
CTMode                                 Cycle


Notes:
The related article is copyrighted material. If you are not a subscriber
of Stocks & Commodities, please visit www.traders.com.

**********************************/
var fpArray = new Array();
var bInit = false;

function preMain() {
    setStudyTitle("Cycle/Trend Analytics");
    setCursorLabelName(" ", 0);
    setCursorLabelName(" ", 1);
    setPriceStudy(false);
    setDefaultBarFgColor(Color.RGB(0x00,0x94,0xFF), 0);
    setDefaultBarFgColor(Color.green, 1);
    setPlotType( PLOTTYPE_LINE , 0 );
    setPlotType( PLOTTYPE_LINE , 1 );
    setDefaultBarThickness(4, 0);
    setDefaultBarThickness(4, 1);


    var x=0;
    fpArray[x] = new FunctionParameter("CTMode", FunctionParameter.STRING);
	with(fpArray[x++]){
        addOption("Cycle");
        addOption("Trend");
        setDefault("Cycle");
    }
}

var bVersion = null;
var xClose = null;
var xColor2 = [];
var Osc = [];

function main(CTMode) {
    if (bVersion == null) bVersion = verify();
    if (bVersion == false) return;

    if ( bInit == false ) {
        xClose = close();
        addBand(0, PS_DASH, 1, Color.white, 1);

        if (CTMode == "Cycle") {
            xPrice = efsInternal('Calc_Price');
        }
        else xPrice = xClose;

        Color1 = 255;
        Color3 = 0;

        for (i = 2; i <= 27; i++) {
            xColor2[i] = 306 - 10.2 * (i+3);
        }

        bInit = true;
    }
    if (getCurrentBarCount() < 30) return;

    for (i = 2; i <= 27; i++){
        count = i + 3;
        Osc[i] = xPrice.getValue(0) - sma(count, xPrice, 0);
        setBarFgColor(Color.RGB(Color1,xColor2[i],Color3), i);
        setCursorLabelName("S"+ count, i);
    }

    if (CTMode == "Cycle") {
        Osc[0] = xPrice.getValue(0);
        Osc[1] = sma(5, xPrice, 0) - sma(30, xPrice, 0)
    }

    return Osc;
}

function Calc_Price(){
    return (Math.sin(2 * Math.PI * getCurrentBarIndex() / (30)));
}

function verify(){
    var b = false;
    if (getBuildNumber() < 779){

        drawTextAbsolute(5, 35, "This study requires version 10.6 or later.",
            Color.white, Color.blue, Text.RELATIVETOBOTTOM|Text.RELATIVETOLEFT|Text.BOLD|Text.LEFT,
            null, 13, "error");
        drawTextAbsolute(5, 20, "Click HERE to upgrade.@URL=https://www.esignal.com/download/default.asp",
            Color.white, Color.blue, Text.RELATIVETOBOTTOM|Text.RELATIVETOLEFT|Text.BOLD|Text.LEFT,
            null, 13, "upgrade");
        return b;
    }
    else
        b = true;

    return b;
}
/**********************************
Provided By:
Copyright 2019 Intercontinental Exchange, Inc. All Rights Reserved.
eSignal is a service mark and/or a registered service mark of Intercontinental Exchange, Inc.
in the United States and/or other countries. This sample eSignal Formula Script (EFS)
is for educational purposes only.
Intercontinental Exchange, Inc. reserves the right to modify and overwrite this EFS file with each new release.

Description:
    Cycle/Trend Analytics And The MAD Indicator
    by John F. Ehlers


Version:            1.00  08/12/2021

Formula Parameters:                    Default:
ShortLength                            8
LongLength                             23


Notes:
The related article is copyrighted material. If you are not a subscriber
of Stocks & Commodities, please visit www.traders.com.

**********************************/
var fpArray = new Array();
var bInit = false;

function preMain() {
    setStudyTitle("Moving Average Difference Indicator");
    setCursorLabelName("MAD", 0);
    setPriceStudy(false);
    setDefaultBarFgColor(Color.RGB(0x00,0x94,0xFF), 0);
    setPlotType( PLOTTYPE_LINE , 0 );


    var x=0;
    fpArray[x] = new FunctionParameter("ShortLength", FunctionParameter.NUMBER);
	with(fpArray[x++]){
        setLowerLimit(1);
        setDefault(8);
    }
    fpArray[x] = new FunctionParameter("LongLength", FunctionParameter.NUMBER);
	with(fpArray[x++]){
        setLowerLimit(1);
        setDefault(23);
    }
}

var bVersion = null;
var xClose = null;
var xMAD = null;

function main(ShortLength, LongLength) {
    if (bVersion == null) bVersion = verify();
    if (bVersion == false) return;

    if ( bInit == false ) {
        xClose = close();
        addBand(0, PS_DASH, 1, Color.grey, 1);
        xMAD = efsInternal('Calc_MAD', xClose, ShortLength, LongLength);

        bInit = true;
    }

    if (getCurrentBarCount() < LongLength || getCurrentBarCount() < ShortLength) return;


    return xMAD.getValue(0);
}

function Calc_MAD(xClose, ShortLength, LongLength){
    ret = 100 * (sma(ShortLength, xClose) - sma(LongLength, xClose)) / sma(LongLength, xClose);
    return ret;
}

function verify(){
    var b = false;
    if (getBuildNumber() < 779){

        drawTextAbsolute(5, 35, "This study requires version 10.6 or later.",
            Color.white, Color.blue, Text.RELATIVETOBOTTOM|Text.RELATIVETOLEFT|Text.BOLD|Text.LEFT,
            null, 13, "error");
        drawTextAbsolute(5, 20, "Click HERE to upgrade.@URL=https://www.esignal.com/download/default.asp",
            Color.white, Color.blue, Text.RELATIVETOBOTTOM|Text.RELATIVETOLEFT|Text.BOLD|Text.LEFT,
            null, 13, "upgrade");
        return b;
    }
    else
        b = true;

    return b;
}
—Eric Lippert
eSignal, an Interactive Data company
800 779-6555, www.eSignal.com
BACK TO LIST

Wealth-Lab.com: October 2021
We have added John Ehlers’ MAD indicator into Wealth-Lab 7’s recent build for the convenience of our users. This gives you the ability to quickly prototype various trading systems based on the indicator. For example, Figure 4 shows a classic trading system—the MACD (now MAD) crossing above the zero line is often considered a bullish signal, and vice versa.
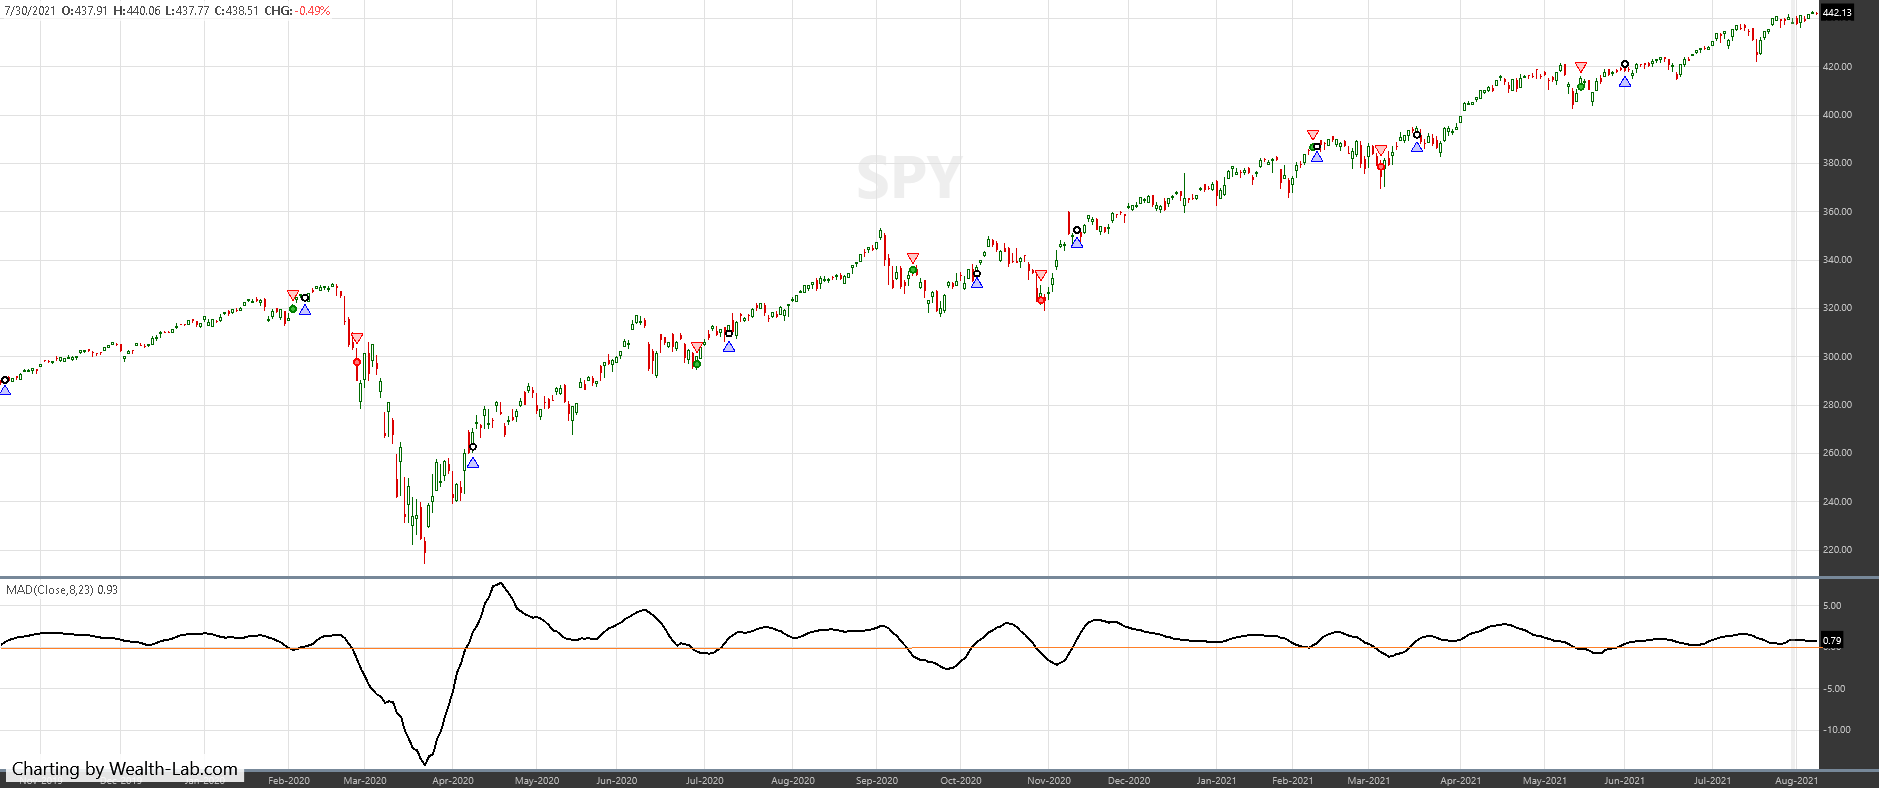
FIGURE 4: WEALTH-LAB. This example chart shows recent trades taken by the system if applied to a daily chart of SPY.
System rules
- Enter when the MAD indicator crosses over its zero line
- Exit when the MAD indicator crosses under its zero line
Figure 5 shows an example of applying Ehlers’ new MAD indicator in Wealth-Lab’s building blocks. In this way, no coding is needed when you use our building blocks to set up a strategy.
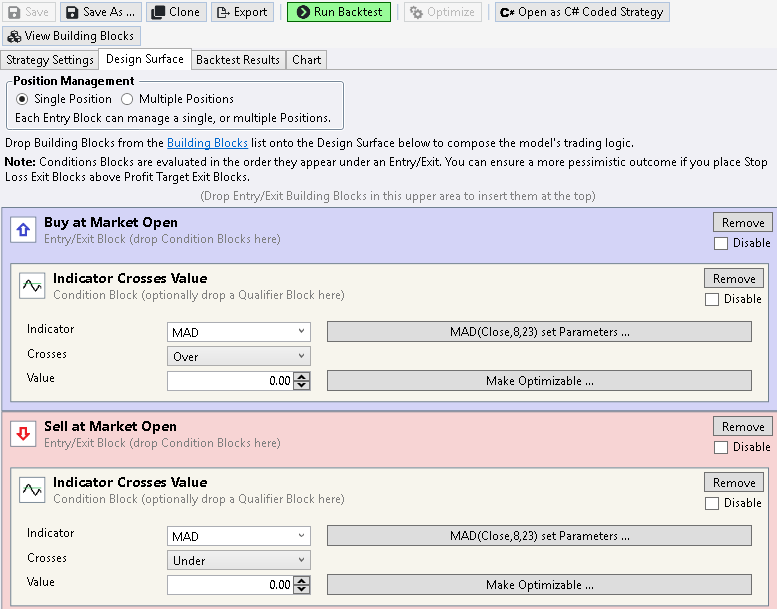
FIGURE 5: WEALTH-LAB. This demonstrates setting up the system using Wealth-Lab 7’s building blocks.
—Gene Geren, Robert Sucher
Wealth-Lab team
www.wealth-lab.com
BACK TO LIST

Neuroshell Trader: October 2021
John Ehlers’ MAD indicator, as described in his article in this issue, “Cycle/Trend Analytics And The MAD Indicator,” can be easily implemented in NeuroShell Trader by combining some of NeuroShell Trader’s 800+ indicators.
To implement the indicators, select new indicator from the insert menu and use the indicator wizard to create the following indicator:
Divide( Avg1-Avg2( Close, 20, 40), Avg( Close, 40) )
A sample chart displaying the indicator is shown in Figure 6.

FIGURE 6: NEUROSHELL TRADER. This NeuroShell Trader chart shows the MAD indicator applied to MSFT.
Users of NeuroShell Trader can go to the Stocks & Commodities section of the NeuroShell Trader free technical support website to download a copy of this or any previous Traders’ Tips.
—Ward Systems Group, Inc.
sales@wardsystems.com
www.neuroshell.com
BACK TO LIST

NinjaTrader: October 2021
The indicators described in John Ehlers’ article in this issue, “Cycle/Trend Analytics And The MAD Indicator,” are available for download at the following links for NinjaTrader 8 and for NinjaTrader 7:
Once the file is downloaded, you can import the indicators into NinjaTrader 8 from within the control center by selecting Tools → Import → NinjaScript Add-On and then selecting the downloaded file for NinjaTrader 8. To import in NinjaTrader 7, from within the control center window, select the menu File → Utilities → Import NinjaScript and select the downloaded file.
You can review the source code for these indicators in NinjaTrader 8 by selecting the menu New → NinjaScript Editor → Indicators from within the control center window and selecting the CycleTrendAnalytics or MAD file. You can review the indicators’ source code in NinjaTrader 7 by selecting the menu Tools → Edit NinjaScript → Indicator from within the control center window and selecting the CycleTrendAnalytics or MAD file.
NinjaScript uses compiled DLLs that run native, not interpreted, which provides you with the highest performance possible.
A sample chart displaying these indicators is shown in Figure 7.

FIGURE 7: NINJATRADER. This daily chart shows the EMINI S&P 500 futures continuous contract with the cycle/trend analytics indicator in the topmost pane set to “cycle,” followed by the cycle/trend analytics set to “trend” in the next pane down, and finally the MAD indicator in the bottommost pane from 12/1/2019 through 7/2/2021.
—Kate Windheuser
NinjaTrader, LLC
www.ninjatrader.com
BACK TO LIST

Optuma: October 2021
The cycle and trend modes and MAD oscillator discussed in John Ehlers’ article in this issue (“Cycle/Trend Analytics And The MAD Indicator”) will be added to Optuma’s Ehlers Tool Group (www.optuma.com/ehlers) and will be available to all clients. Here is the scripting code for the MAD oscillator:
//MvgAv Inputs;
#$Short = 8;
#$Long = 23;
//Calculate MAD;
S1 = MA(BARS=$Short, CALC=Close);
L1 = MA(BARS=$Long, CALC=Close);
100 * ((S1 - L1)/L1)
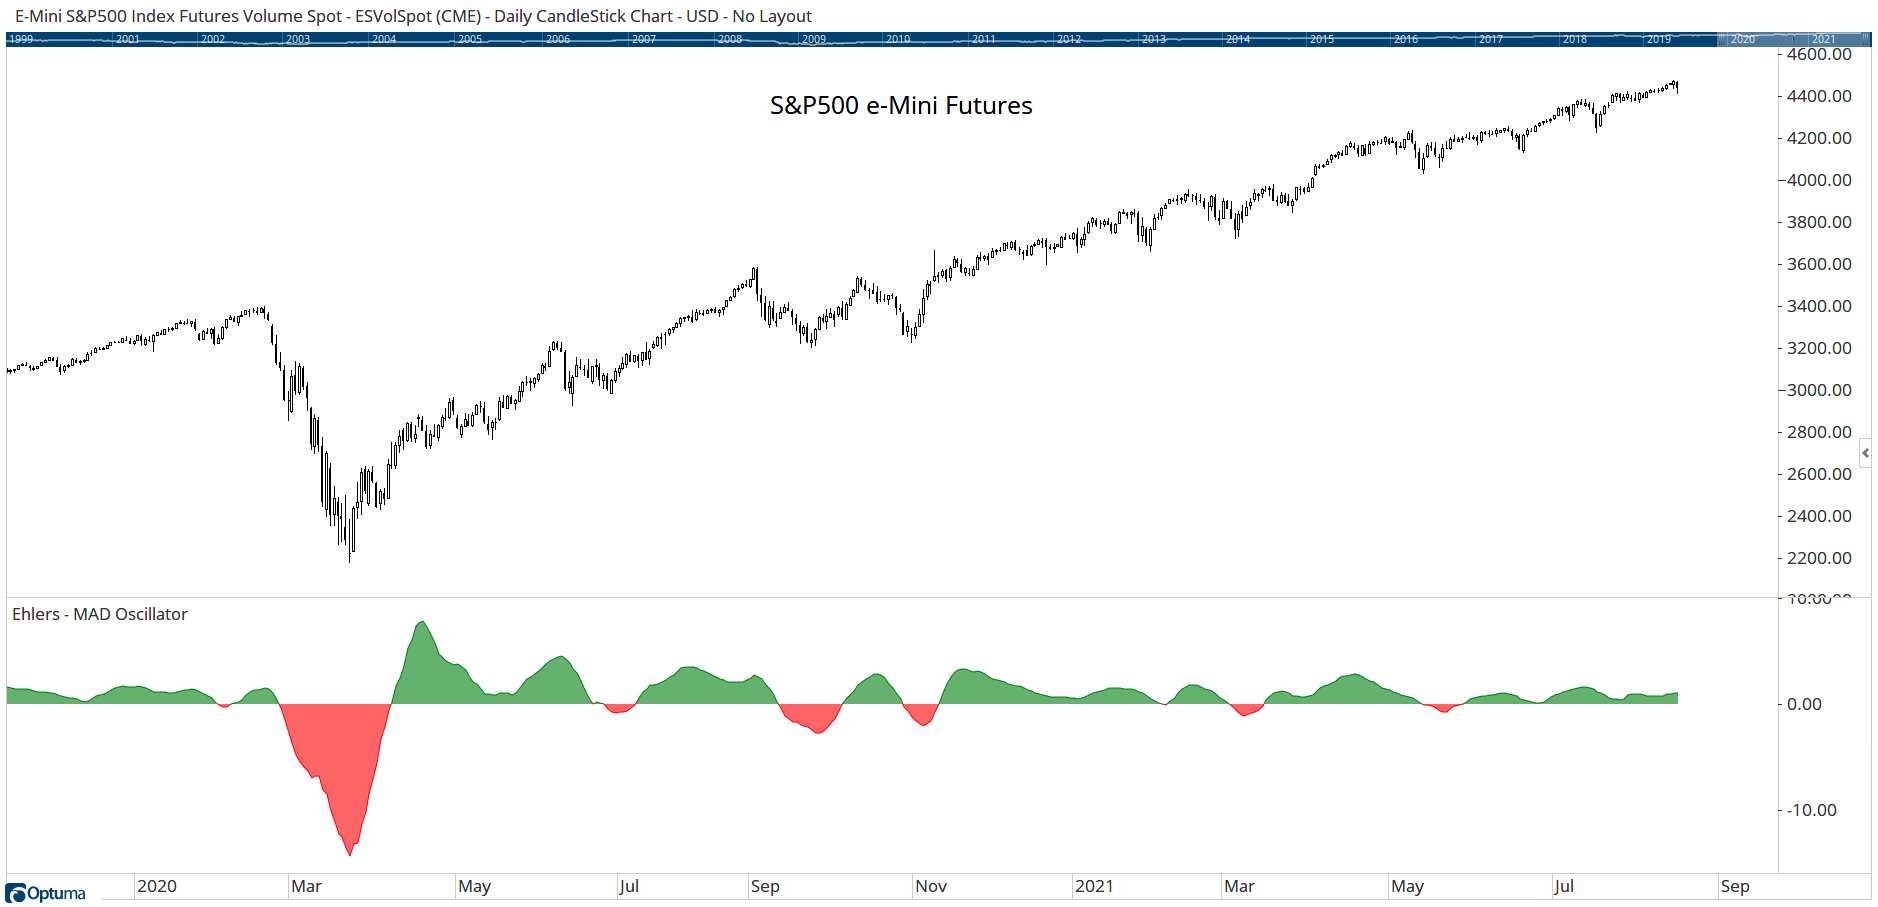
FIGURE 8: OPTUMA. This sample chart displays John Ehlers’ MAD indicator on S&P 500 emini futures.
—support@optuma.com
www.optuma.com
BACK TO LIST

Aiq: October 2021
The importable AIQ EDS file based on John Ehlers’ article in this issue, “Cycle/Trend Analysis And The MAD Indicator,” can be obtained on request via email to info@TradersEdgeSystems.com. The code is also available below. Code for the author’s indicator is set up in the AIQ code file.
!CYCLE/TREND ANALYTICS AND THE MAD INDICATOR
!Author: John F. Ehlers, TASC Oct 2021
!Coded by: Richard Denning, 8/15/2021

!MAD (Moving Average Difference) Indicator
!(C) 2021 John F. Ehler

Shortlength is 8.
LongLength is 23.
MAD is 100*(simpleavg([Close], ShortLength) -
    simpleavg([Close], LongLength)) /
    simpleavg([Close], LongLength).
Figure 9 shows the MAD indicator on a chart of Tesla, Inc. (TSLA).

FIGURE 9: AIQ. This shows a chart of Tesla, Inc. with the MAD indicator applied.
—Richard Denning
info@TradersEdgeSystems.com
for AIQ Systems
BACK TO LIST

TradersStudio: October 2021
The importable TradersStudio file based on John Ehlers’ article in this issue, “Cycle/Trend Analytics And The MAD Indicator,” can be obtained on request via email to info@TradersEdgeSystems.com. The code is also available below.
Code for the author’s indicators is provided in the following files:
- Function EHLERS_MAD: Computes the MAD indicator
- Indicator plot EHLERS_MAD_IND: Plots the MAD indicator on a chart
'CYCLE/TREND ANALYTICS AND THE MAD INDICATOR
'Author: John F. Ehlers, TASC Oct 2021
'Coded by: Richard Denning, 8/15/2021

'MAD (Moving Average Difference) Indicator
'(C) 2021 John F. Ehler
Function EHLERS_MAD(ShortLength,LongLength)
    'Shortlength=8
    'LongLength=23
EHLERS_MAD = 100*(Average(Close, ShortLength) - Average(Close, LongLength)) / Average(Close, LongLength)
End Function
Figure 10 shows the indicators on a chart of Amazon Inc. (AMZN) from 2012 to 2014.

FIGURE 10: TRADERSSTUDIO. The MAD indicator is shown on a chart of Microsoft Inc (MSFT) during 2011–2012.
—Richard Denning
info@TradersEdgeSystems.com
for TradersStudio
BACK TO LIST

The Zorro Project: October 2021
In his article in this issue, “Cycle/Trend Analytics And The MAD Indicator,” John Ehlers proposes a new trend indicator, the MAD (moving average difference) oscillator. As the name suggests, the indicator is just the difference of two moving averages normalized to +/-100. The code in C for Zorro is as follows:
var MAD(vars Data, int ShortPeriod, int LongPeriod)
{
	return 100*(SMA(Data,ShortPeriod)/SMA(Data,LongPeriod)-1.);
}
According to Ehlers, the two periods should differ by half the period of the dominant cycle in the data. This ensures that the indicator output is in phase with the dominant cycle, thus indicating its trend with no lag. For putting that to the test, we can apply an SMA 5-20 difference to a 30-period sine wave. The code for this is as follows:
function run()
{
   MaxBars = 200;
   asset(""); // dummy asset
   ColorUp = ColorDn = 0; // don't plot a price curve

   vars Sine = series(genSine(30,30));
   var Diff = SMA(Sine,5) - SMA(Sine,20);
   plot("Sine",Sine[0]-0.5,LINE,BLUE);
   plot("MAD",Diff,LINE,RED);
}
The resulting chart is shown in Figure 11. The chart displays the SMA 5-20 difference (red) applied to a 30-period sine wave (blue). We can see that the red difference is indeed exactly in sync with the blue sine wave.
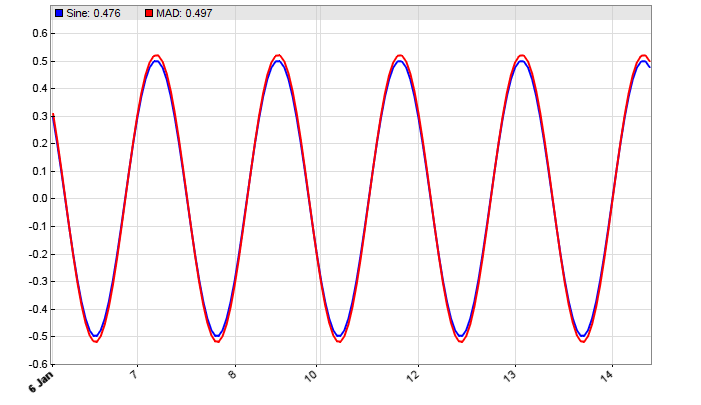
FIGURE 11: ZORRO PROJECT. The chart displays the SMA 5-20 difference (red) applied to a 30-period sine wave (blue). We can see that the red difference is exactly in sync with the blue sine wave.
In our tests this seems to work only with the selected 5-20-30 periods from Ehlers’ code. We tried other SMA periods like 10 and 25, but the red curve gets a phase shift although the difference is the same. Maybe Ehlers will shed some light on that phenomenon in a future article.
Here’s the code to replicate his chart with SPY data from the STOOQ website:
void run()
{
  StartDate = 20191201;
  EndDate = 20210701;
  BarPeriod = 1440;

  assetAdd("SPY","STOOQ:*");
  asset("SPY");
  plot("MAD",MAD(seriesC(),8,23),NEW,RED);
}
The resulting chart in Figure 12 matches Ehlers’ example. Note that his normalization by dividing through the longer SMA introduces a small phase shift. So the chart would look slightly different with a plain SMA difference.
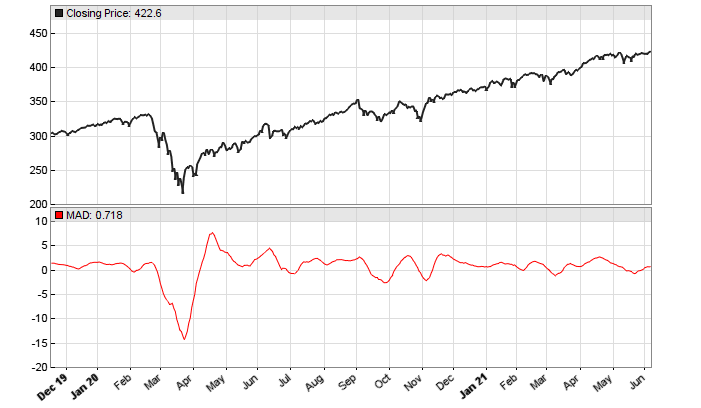
FIGURE 12: ZORRO PROJECT. This example SPY chart replicates the chart in John Ehlers’ article in this issue.
In his next article, Ehlers indicates that he will show examples of the indicator, so we will wait until then before testing it in a trading system.
The MAD oscillator and test script can be downloaded from the 2021 script repository on https://financial-hacker.com. The Zorro platform can be downloaded from https://zorro-project.com.
—Petra Volkova
The Zorro Project by oP group Germany
https://zorro-project.com
BACK TO LIST
Microsoft Excel: October 2021
In his article in this issue, “Cycle/Trend Analytics And The MAD Indicator,” John Ehlers walks us through the development of his moving average difference (MAD) indicator.
The mathematical steps and the charting techniques used to illustrate the steps are both informative and colorful.
First, I’ll show a set of “price minus SMA-of-price” oscillators where the length of the SMA varies from 5 to 30. Figure 13 shows the cycle mode and Figure 14 shows the trend mode.

FIGURE 13: EXCEL, CYCLE MODE ANALYTIC. This displays the SMA oscillators with lengths from 5 to 30 using a 30-bar sine wave as input.

FIGURE 14: EXCEL, TREND MODE ANALYTIC. This shows the same set of SMA oscillators using the closing price as input.
Ehlers notes that when you substitute the close price as the input, “the separation between the reddest line and the yellowest line reflects the strength of the trend.” Further, “When the red line is on top, the trend is up and when the red line is on the bottom, the trend is down.” This leads us to Ehlers’ MAD indicator as the difference between two simple moving averages (Figure 15).

FIGURE 15: EXCEL, MAD INDICATOR. Here you can see the MAD indicator plotted using lengths 8 and 23.
A key point of the development of MAD is the choice of lengths for the shorter and longer moving averages.
Ehlers has a couple of comments on this topic:
- MAD becomes smoother as the length of the shorter moving average becomes longer.
- If the dominant cycle of the input is known, then the difference between the averaging lengths should be approximately half the period of the dominant cycle.
- If the dominant cycle is unknown, make the length of the longer average twice the length of the shorter average.
Finally, a bit of visual perspective: See Figure 16.

FIGURE 16: EXCEL, MAD INDICATOR. This chart demonstrates the trend mode oscillator and MAD indicator.
To download this spreadsheet: The spreadsheet file for this Traders’ Tip can be downloaded here. To successfully download it, follow these steps:
- Right-click on the Excel file link, then
- Select “save as” (or “save target as”) to place a copy of the spreadsheet file on your hard drive.
—Ron McAllister
Excel and VBA programmer
rpmac_xltt@sprynet.com
BACK TO LIST

TradeStation: October 2021
In his article “Cycle/Trend Analytics And The MAD Indicator,” author John Ehlers discusses how his research into characteristics of cycles in market data led to the development of a new trend indicator called the moving average difference (MAD). First, the two modes (“cycle” and “trend”) of the cycle/trend analytics indicator provide a foundational context for the MAD oscillator. Essentially, the MAD oscillator is a difference between two simple moving averages with varying lengths. The difference in lengths should be approximately half the period of the dominant cycle in the data. If unknown, it is suggested to make the length of the longer moving average twice that of the shorter one.
Indicator:  TASC AUG 2021 MAB
// TASC OCT 2021
// Cycle/Trend Analytics
// (C) 2021 John F. Ehlers

Inputs:
	CTMode("trend"); // "cycle" or "trend"

Vars:
	Price(0),
	Length(0),
	NormalLength(0),
	Color1(0),
	Color2(0),
	Color3(0);

Arrays:
	Osc[50](0);

Plot1(0,"",white, 1, 1);
	Price = Close;

If CTMode = "cycle" Then
Begin
	Price = Sine(360*CurrentBar / 30);
	Plot2(Price,"", cyan, 4, 4);
	Plot3(Average(Price, 5) - Average(Price, 30),"", green, 4, 4);
End;

Color1 = 255;
Color3 = 0;
For Length = 5 to 30 Begin
	Osc[Length] = Price - Average(Price, Length);
End;

For Length = 5 to 30
Begin
	Color2 = 306 - 10.2*Length;
	//If Length = 3 Then Plot3[0](Osc[Length], "S3", RGB(Color1,
	//Color2, Color3),0,4);
	If Length = 4 Then Plot4[0](Osc[Length], "S4", RGB(Color1,
	 Color2, Color3),0,4);
	If Length = 5 Then Plot5[0](Osc[Length], "S5", RGB(Color1,
	 Color2, Color3),0,4);
	If Length = 6 Then Plot6[0](Osc[Length], "S6", RGB(Color1,
	 Color2, Color3),0,4);
	If Length = 7 Then Plot7[0](Osc[Length], "S7", RGB(Color1,
	 Color2, Color3),0,4);
	If Length = 8 Then Plot8[0](Osc[Length], "S8", RGB(Color1,
	 Color2, Color3),0,4);
	If Length = 9 Then Plot9[0](Osc[Length], "S9", RGB(Color1,
	 Color2, Color3),0,4);
	If Length = 10 Then Plot10[0](Osc[Length], "S10", RGB(Color1,
	 Color2, Color3),0,4);
	If Length = 11 Then Plot11[0](Osc[Length], "S11", RGB(Color1,
	 Color2, Color3),0,4);
	If Length = 12 Then Plot12[0](Osc[Length], "S12", RGB(Color1,
	 Color2, Color3),0,4);
	If Length = 13 Then Plot13[0](Osc[Length], "S13", RGB(Color1,
	 Color2, Color3),0,4);
	If Length = 14 Then Plot14[0](Osc[Length], "S14", RGB(Color1,
	 Color2, Color3),0,4);
	If Length = 15 Then Plot15[0](Osc[Length], "S15", RGB(Color1,
	 Color2, Color3),0,4);
	If Length = 16 Then Plot16[0](Osc[Length], "S16", RGB(Color1,
	 Color2, Color3),0,4);
	If Length = 17 Then Plot17[0](Osc[Length], "S17", RGB(Color1,
	 Color2, Color3),0,4);
	If Length = 18 Then Plot18[0](Osc[Length], "S18", RGB(Color1,
	 Color2, Color3),0,4);
	If Length = 19 Then Plot19[0](Osc[Length], "S19", RGB(Color1,
	 Color2, Color3),0,4);
	If Length = 20 Then Plot20[0](Osc[Length], "S20", RGB(Color1,
	 Color2, Color3),0,4);
	If Length = 21 Then Plot21[0](Osc[Length], "S21", RGB(Color1,
	 Color2, Color3),0,4);
	If Length = 22 Then Plot22[0](Osc[Length], "S22", RGB(Color1,
	 Color2, Color3),0,4);
	If Length = 23 Then Plot23[0](Osc[Length], "S23", RGB(Color1,
	 Color2, Color3),0,4);
	If Length = 24 Then Plot24[0](Osc[Length], "S24", RGB(Color1,
	 Color2, Color3),0,4);
	If Length = 25 Then Plot25[0](Osc[Length], "S25", RGB(Color1,
	 Color2, Color3),0,4);
	If Length = 26 Then Plot26[0](Osc[Length], "S26", RGB(Color1,
	 Color2, Color3),0,4);
	If Length = 27 Then Plot27[0](Osc[Length], "S27", RGB(Color1,
	 Color2, Color3),0,4);
	If Length = 28 Then Plot28[0](Osc[Length], "S28", RGB(Color1,
	 Color2, Color3),0,4);
	If Length = 29 Then Plot29[0](Osc[Length], "S29", RGB(Color1,
	 Color2, Color3),0,4);
	If Length = 30 Then Plot30[0](Osc[Length], "S30", RGB(Color1,
	 Color2, Color3),0,4);
End


Indicator:  TASC OCT 2021 MAD
// TASC AUG 2021
// MAD (Moving Average Difference) Indicator
// (C) 2021 John F. Ehlers

Inputs:
	ShortLength(8),
	LongLength(23);

Vars:
	MAD(0);
	MAD = 100*(Average(Close,
	 ShortLength) - Average(Close,
	 LongLength)) / Average(Close,
	 LongLength);

Plot1(MAD, "", red, 4, 4);
Plot2(0,"", white, 1, 1)

FIGURE 17: TRADESTATION. A daily chart of the continuous E-mini S&P 500 Index with the indicators applied.
This article is for informational purposes. No type of trading or investment recommendation, advice or strategy is being made, given or in any manner provided by TradeStation Securities or its affiliates.
—John Robinson
TradeStation Securities, Inc.
www.TradeStation.com
BACK TO LIST
Originally published in the October 2021 issue of
Technical Analysis of STOCKS & COMMODITIES magazine.
All rights reserved. © Copyright 2021, Technical Analysis, Inc.


