TRADERS’ TIPS
December 2021

For this month’s Traders’ Tips, the focus is John Ehlers’ article in this issue, “The DMH: An Improved Directional Movement Indicator.” Here, we present the December 2021 Traders’ Tips code with possible implementations in various software.
You can right-click on any chart to open it in a new tab or window and view it at it’s originally supplied size, often much larger than the version printed in the magazine.
The Traders’ Tips section is provided to help the reader implement a selected technique from an article in this issue or another recent issue. The entries here are contributed by software developers or programmers for software that is capable of customization.

Thinkorswim: December 2021
We put together a study based on the article by John Ehlers in this issue titled “The DMH: An Improved Directional Movement Indicator.” We built the strategy referenced by using our proprietary scripting language, thinkscript. To ease the loading process, simply click on https://tos.mx/B1kwmEN or enter it into the address into setup→open shared item from within thinkorswim then choose view thinkScript study and name it “DMH” or whatever you like and can identify. You can then add the strategy to your charts from the edit studies menu from within the charts tab and then select studies.
Figure 1 shows the study added to a two-year daily chart of the emini S&P 500 futures. Please see John Ehlers’ article for more information on how to utilize the study.
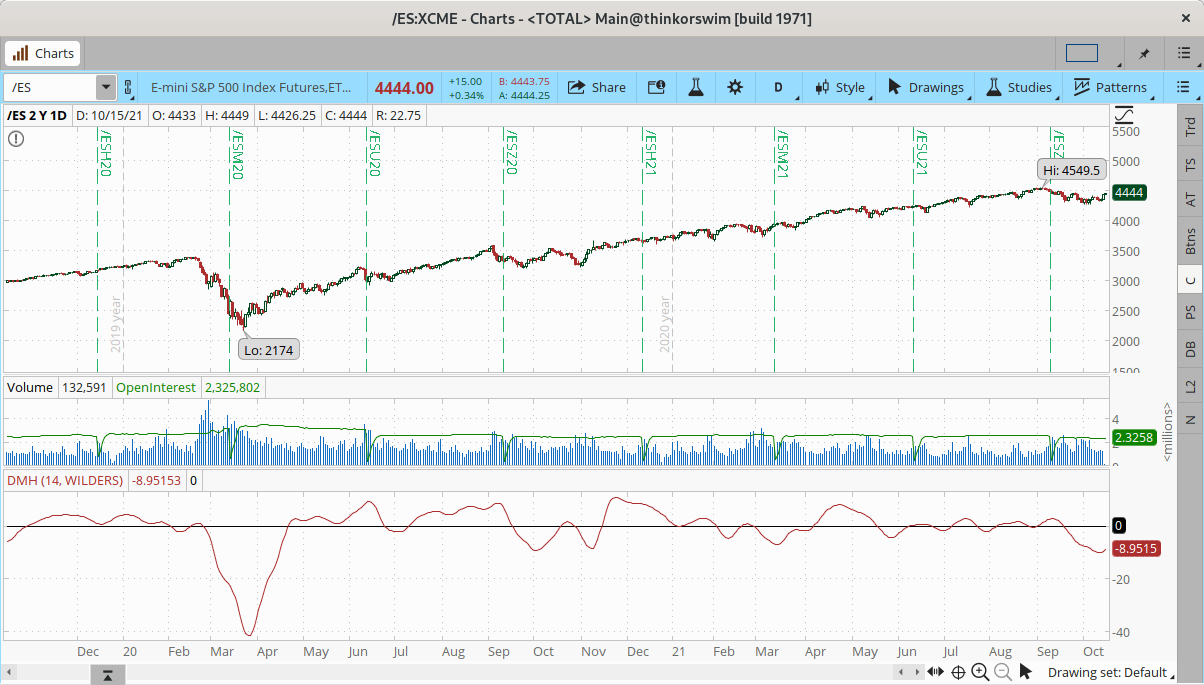
FIGURE 1: THINKORSWIM. This sample chart shows the study added to a two-year daily chart of the emini S&P 500 futures.
—thinkorswim
A division of TD Ameritrade, Inc.
www.thinkorswim.com
BACK TO LIST

TradingView: December 2021
Here is the TradingView Pine code for implementing the DMH indicator, based on John Ehlers’ article in this issue, “The DMH: An Improved Directional Movement Indicator.”
The Pine Script code given here uses the recently launched version 5 of the language.
The calculation starts with the classic definition of PlusDM and MinusDM. These directional movements are summed in an exponential moving average (EMA). Then, this EMA is further smoothed in a finite impulse response (FIR) filter using Hann window coefficients over the calculation period:
//  TASC Issue: December 2021 - Vol. 39, Issue 13
//     Article: "The DMH: An Improved
//               Directional Movement Indicator"
//  Article By: John F. Ehlers
//    Language: TradingView's Pine Script v5
// Provided By: PineCoders, for TradingView.com

//@version=5
indicator("TASC 2021.12 Directional Movement w/Hann", "DMH")

lengthInput = input.int(10,     "Length:", minval = 2)
lWidthInput = input.int( 2, "Line Width:", minval = 1)

hann(src, period) => // Hann FIR Filter
    var PIx2 = 2.0 * math.pi / (period + 1)
    sum4Hann  = 0.0, sumCoefs = 0.0
    for count= 1 to period
        coef      =  1.0 - math.cos(count * PIx2)
        sum4Hann += coef * src[count - 1]
        sumCoefs += coef
    nz(sum4Hann / sumCoefs)

dmh(period) => // Directional Movement w/Hann
    upMove = high - high[1]
    dnMove = -low +  low[1]
    pDM = upMove > dnMove and upMove > 0 ? upMove : 0.0
    mDM = dnMove > upMove and dnMove > 0 ? dnMove : 0.0
    hann(ta.rma(pDM - mDM, period), period)

signal = dmh(lengthInput)

plotColor = signal > 0.0 ? #FFCC00   : #0055FF
areaColor = signal > 0.0 ? #FFCC0055 : #0055FF55

plot(signal, "Area", areaColor, style = plot.style_area)
plot(signal,  "DMH", plotColor, lWidthInput)
hline(0, "Zero", color.gray)
The indicator is available on TradingView from the PineCodersTASC account: https://www.tradingview.com/u/PineCodersTASC/#published-scripts.
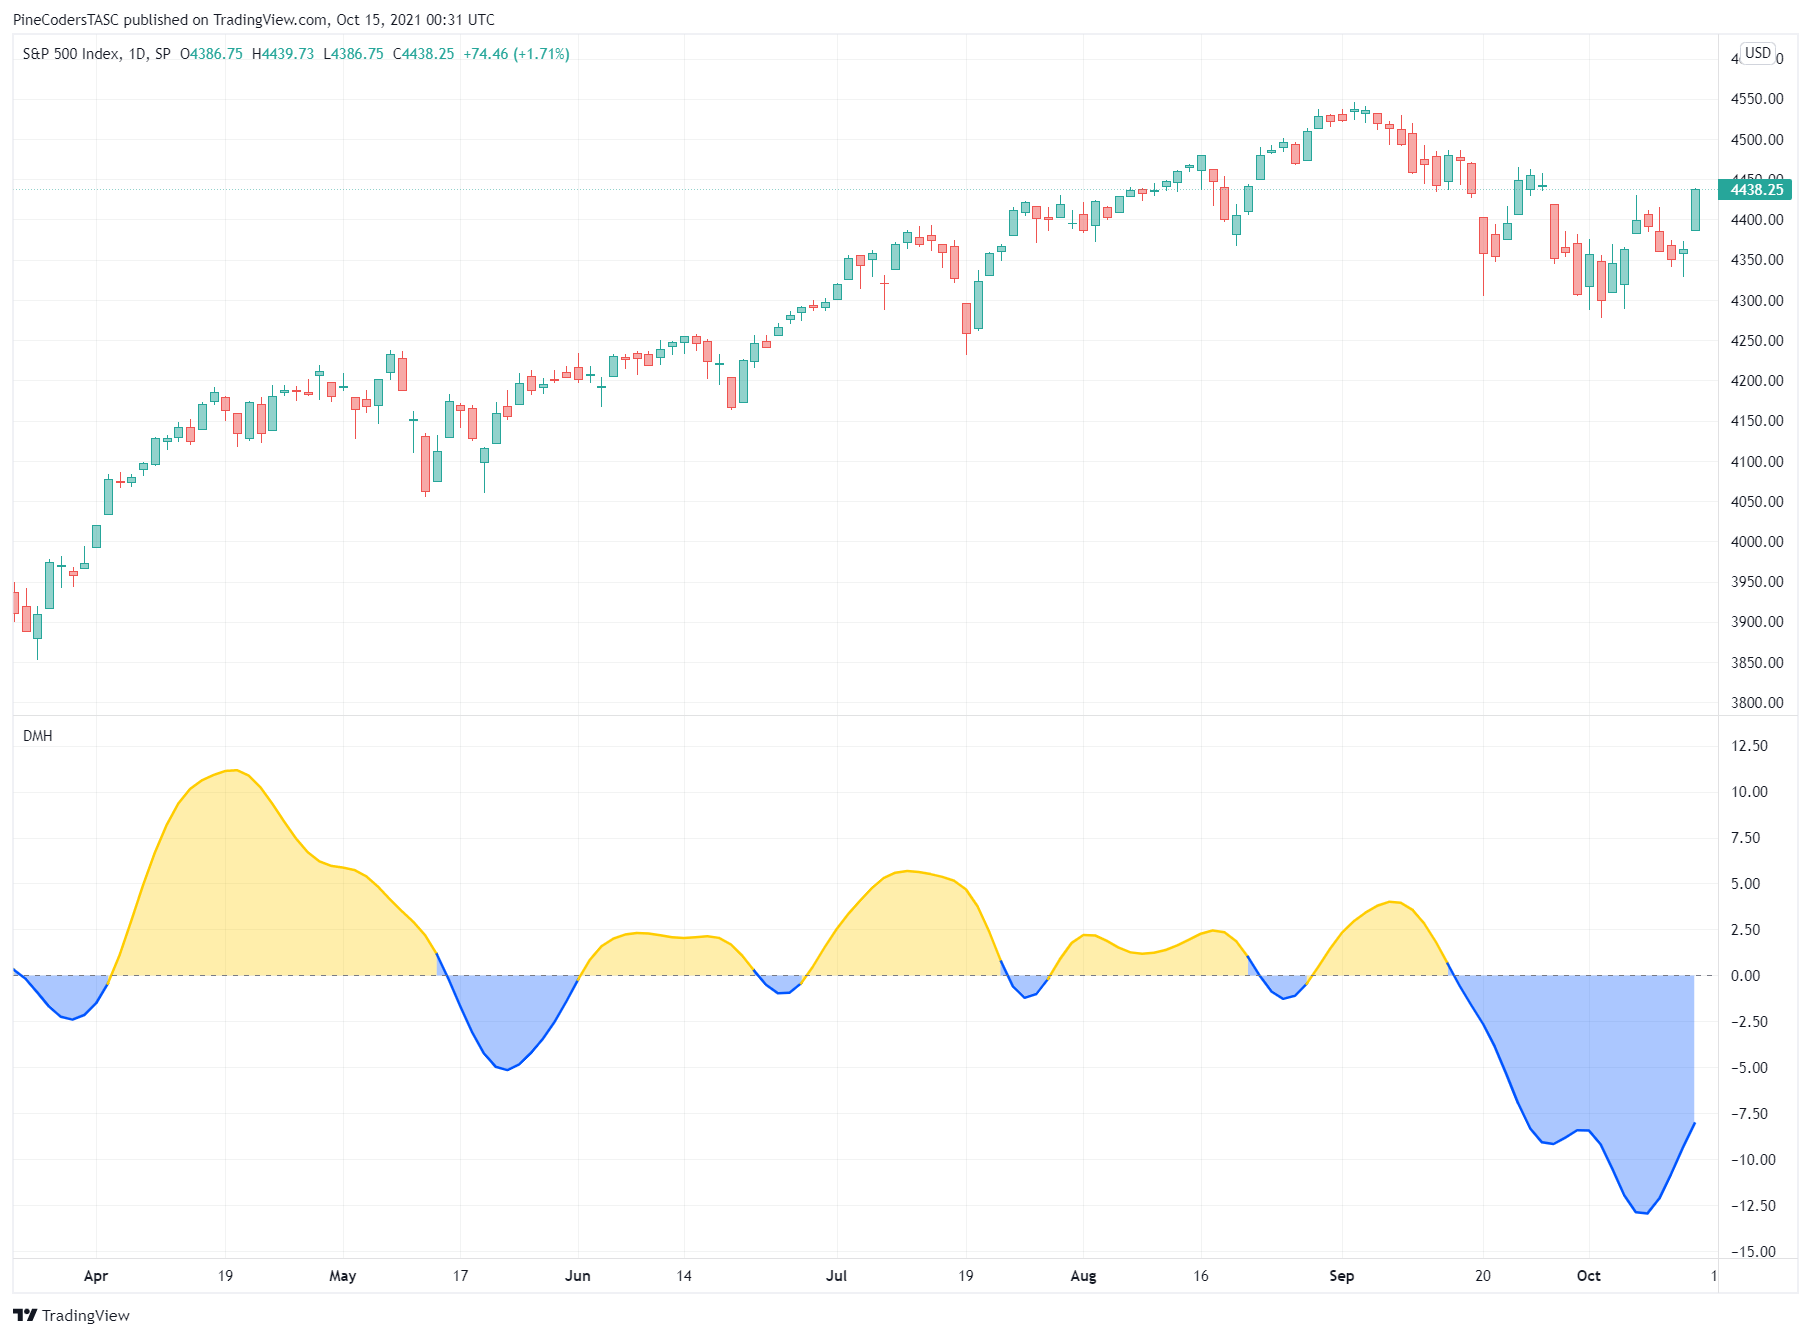
FIGURE 2: TRADINGVIEW. The DMH (directional movement indicator using Hann windowing coefficients) is shown on a chart of SPX.
—Pinecoders, for TradingView
https://www.tradingview.com
BACK TO LIST

eSIGNAL: December 2021
For this month’s Traders’ Tip, we’ve provided the study “Directional Movement using Hann Windowing.efs” based on the article in this issue by John Ehlers titled “The DMH: An Improved Directional Movement Indicator.” This study offers an improvement over the classic directional movement indicator developed by J. Welles Wilder by applying a finite impulse response (FIR) filter using Hann window coefficients.
The study contains formula parameters that may be configured through the edit chart window (right-click on the chart and select “edit chart”). A sample chart is shown in Figure 3.
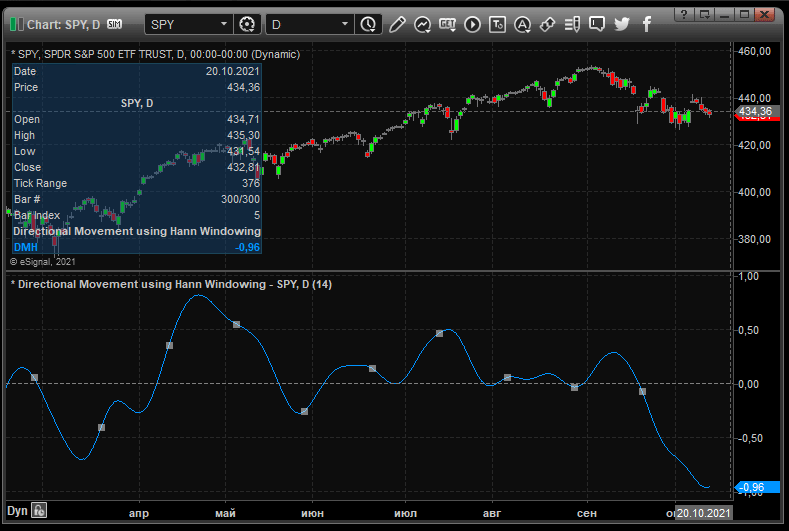
FIGURE 3: eSIGNAL. Here is an example of the study plotted on a daily chart of SPY.
To discuss this study or download a complete copy of the formula code, please visit the EFS library discussion board forum under the forums link from the support menu at www.esignal.com or visit our EFS KnowledgeBase at https://www.esignal.com/support/kb/efs. The eSignal formula script (EFS)
is also available for copying & pasting below.
/**********************************
Provided By:
Copyright 2019 Intercontinental Exchange, Inc. All Rights Reserved.
eSignal is a service mark and/or a registered service mark of Intercontinental Exchange, Inc.
in the United States and/or other countries. This sample eSignal Formula Script (EFS)
is for educational purposes only.
Intercontinental Exchange, Inc. reserves the right to modify and overwrite this EFS file with each new release.

Description:
    Directional Movement using Hann Windowing
    by John F. Ehlers


Version:            1.00  10/07/2021

Formula Parameters:                    Default:
Length                                 14


Notes:
The related article is copyrighted material. If you are not a subscriber
of Stocks & Commodities, please visit www.traders.com.

**********************************/
var fpArray = new Array();
var bInit = false;

function preMain() {
    setStudyTitle("Directional Movement using Hann Windowing");
    setCursorLabelName("DMH", 0);
    setPriceStudy(false);
    setDefaultBarFgColor(Color.RGB(0x00,0x94,0xFF), 0);
    setPlotType( PLOTTYPE_LINE , 0 );


    var x=0;
    fpArray[x] = new FunctionParameter("Length", FunctionParameter.NUMBER);
	with(fpArray[x++]){
        setLowerLimit(1);
        setDefault(14);
    }
}

var bVersion = null;
var xClose = null;
var xDMH = null;
var SF = null;
var xUpperMove = null;
var xLowerMove = null;
var PlusDM = null;
var MinusDM = null;
var xEMA = [];
var coef = null;


function main(Length) {
    if (bVersion == null) bVersion = verify();
    if (bVersion == false) return;

    if ( bInit == false ) {
        xClose = close();
        xHigh = high();
        xLow = low();
        addBand(0, PS_DASH, 1, Color.grey, 1);
        SF = 1 / Length;
        xUpperMove = efsInternal('Calc_xUpperMove', xHigh);
        xLowerMove = efsInternal('Calc_xLowerMove', xLow);
        for (var i = 0; i < Length; i++){
            xEMA[i] = 0;
        }

        bInit = true;
    }

    if (getCurrentBarCount() < Length) return;


    PlusDM = 0 ;
    MinusDM = 0 ;
    if (xUpperMove.getValue(0) > xLowerMove.getValue(0) & xUpperMove.getValue(0) > 0) {
        PlusDM = xUpperMove.getValue(0)
    }
    else if (xLowerMove.getValue(0) > xUpperMove.getValue(0) & xLowerMove.getValue(0) > 0) {
        MinusDM = xLowerMove.getValue(0)
    }

    vEMA = SF * (PlusDM - MinusDM) + (1 - SF)* xEMA[0];

    if (getBarState() == BARSTATE_NEWBAR){
        xEMA.unshift(vEMA);
        xEMA.pop();
    }
    else {
        xEMA[0] = vEMA
    }

    xDMH = Calc_DMH(xEMA, Length);

    return xDMH;
}

function Calc_DMH(xEMA, Length){
    DMSum = 0;
    coef = 0;

    for (var i = 1; i <= Length; i++){
        DMSum = DMSum + (1 - Math.cos(2 * Math.PI * i / (Length + 1))) * xEMA[i - 1];
        coef = coef + (1 - Math.cos(2 * Math.PI * i / (Length + 1)))
    }
    if (coef != 0) {
     DMH = DMSum / coef;
    }

    return DMH;
}

function Calc_xLowerMove(xLow){
    return (xLow.getValue(-1) - xLow.getValue(0));
}

function Calc_xUpperMove(xHigh){
    return (xHigh.getValue(0) - xHigh.getValue(-1));
}

function verify(){
    var b = false;
    if (getBuildNumber() < 779){

        drawTextAbsolute(5, 35, "This study requires version 10.6 or later.",
            Color.white, Color.blue, Text.RELATIVETOBOTTOM|Text.RELATIVETOLEFT|Text.BOLD|Text.LEFT,
            null, 13, "error");
        drawTextAbsolute(5, 20, "Click HERE to upgrade.@URL=https://www.esignal.com/download/default.asp",
            Color.white, Color.blue, Text.RELATIVETOBOTTOM|Text.RELATIVETOLEFT|Text.BOLD|Text.LEFT,
            null, 13, "upgrade");
        return b;
    }
    else
        b = true;

    return b;
}
—Eric Lippert
eSignal, an Interactive Data company
800 779-6555, www.eSignal.com
BACK TO LIST

Wealth-Lab.com: December 2021
In his article in this issue, “The DMH: An Improved Directional Movement Indicator,” John Ehlers presents his improved version of the classic directional movement indicator (DMI or ADX), which was originally developed by J. Welles Wilder.
It’s possible to apply Ehlers’ DMH indicator in diverse ways. As one way, Ehlers suggests using the rate of change of DMH crossing over zero for a trough (and a cross under for a peak). In our test, an ROC of DMH appears jiggy, producing quite sporadic signals.
In another approach, we made a sample system signal a buy if the DMH turns up, increasing after a decline, and vice versa for a sell, i.e., when it decreases following an advance.
For this strategy we decided to go with the zero line crossings. The rules are a piece of cake to implement in Wealth-Lab 7 thanks to its “building blocks” feature that eliminates the need to program complex ideas. In a quick test on SPY, this strategy seems to beat the turn up/down approach.
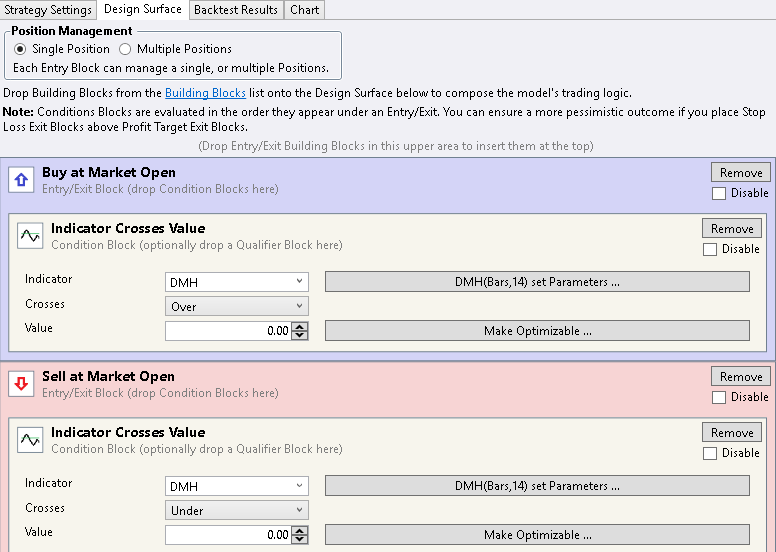
FIGURE 4: WEALTH-LAB. Setting up a DMH system in Wealth-Lab is quick and easy by using Wealth-Lab’s building blocks feature, which eliminates the need to produce code.
System rules:
- Buy if the DMH crosses over zero
- Sell when it crosses below zero.
A promising idea may be to track the peaks and troughs of the DMH. A peak/trough is a move of a certain amount above/below a previous trough/peak value, expressed as indicator points or a percentage.
It’s up to the trader to determine through testing which rule or rules result in more robust signal generation.
Figure 5 illustrates application of the DMH to a chart of SPY.
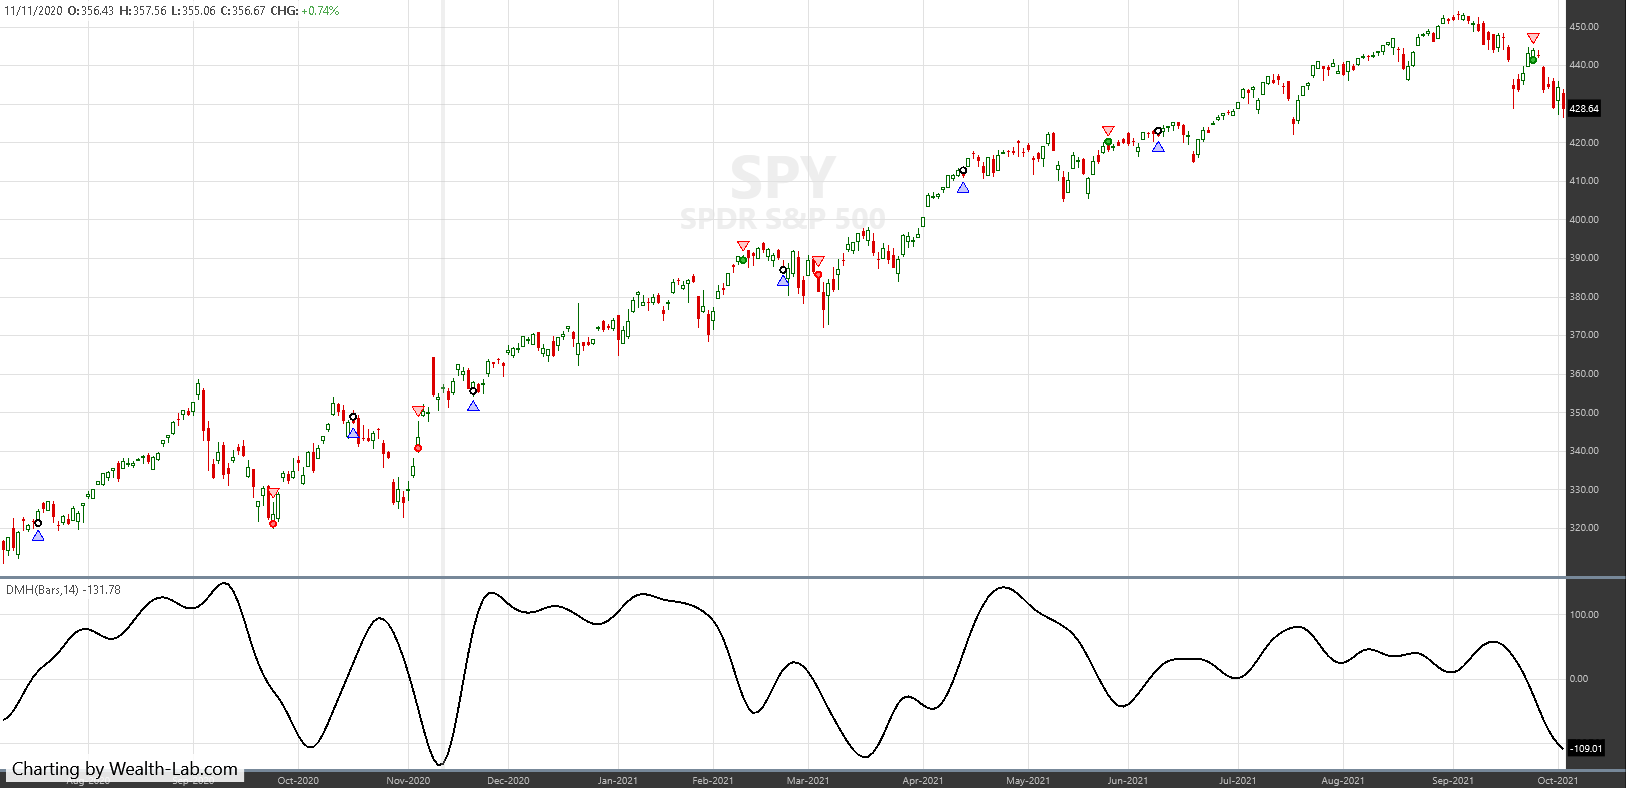
FIGURE 5: WEALTH-LAB. This chart shows an example of trade signals produced by the system if applied to a daily chart of SPY.
—Gene Geren (Eugene)
Wealth-Lab team
www.wealth-lab.com
BACK TO LIST

NinjaTrader: December 2021
The DMH indicator, as introduced by John Ehlers in his article in this issue, “The DMH: An Improved Directional Movement Indicator,” is available for download at the following links for NinjaTrader 8 and NinjaTrader 7:
Once the file is downloaded, you can import the indicator in NinjaTader 8 from within the Control Center by selecting Tools → Import → NinjaScript Add-On and then selecting the downloaded file for NinjaTrader 8. To import in NinjaTrader 7 from within the Control Center window, select the menu File → Utilities → Import NinjaScript and select the downloaded file.
You can review the indicator’s source code in NinjaTrader 8 by selecting the menu New → NinjaScript Editor → Indicators from within the Control Center window and selecting the DMH file. You can review the indicator’s source code in NinjaTrader 7 by selecting the menu Tools → Edit NinjaScript → Indicator from within the control center window and selecting the DMH file.
NinjaScript uses compiled DLLs that run native, not interpreted, which provides you with the highest performance possible.
A sample chart displaying the indicator is shown in Figure 6.
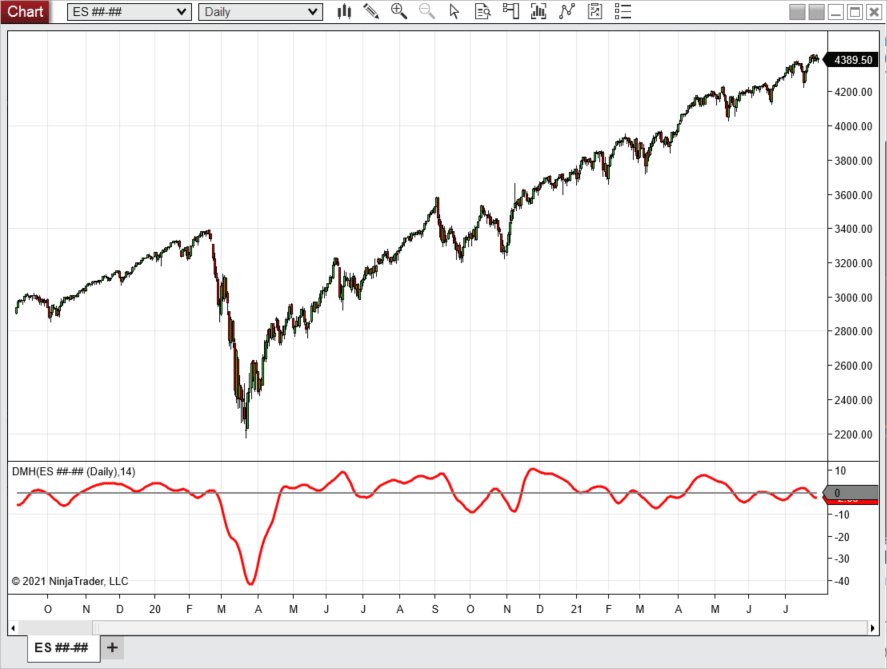
FIGURE 6: NINJATRADER. In this example, the DMH indicator is applied to the emini S&P 500 continuous futures contract from October 2019 to July 2021.
—Brandon Haulk
NinjaTrader, LLC
www.ninjatrader.com
BACK TO LIST

Neuroshell Trader: December 2021
The DMH indicator, as presented in John Ehlers’ article in this issue, “The DMH: An Improved Directional Movement Indicator,” can be easily implemented in NeuroShell Trader using NeuroShell Trader’s ability to call external dynamic linked libraries. Dynamic linked libraries can be written in C, C++, or Power Basic.
After moving the code given in the article to your preferred compiler and creating a DLL, you can insert the resulting indicator as follows:
- Select “New indicator …” from the insert menu.
- Choose the external program & library calls category.
- Select the appropriate external DLL call indicator.
- Set up the parameters to match your DLL.
- Select the finished button.
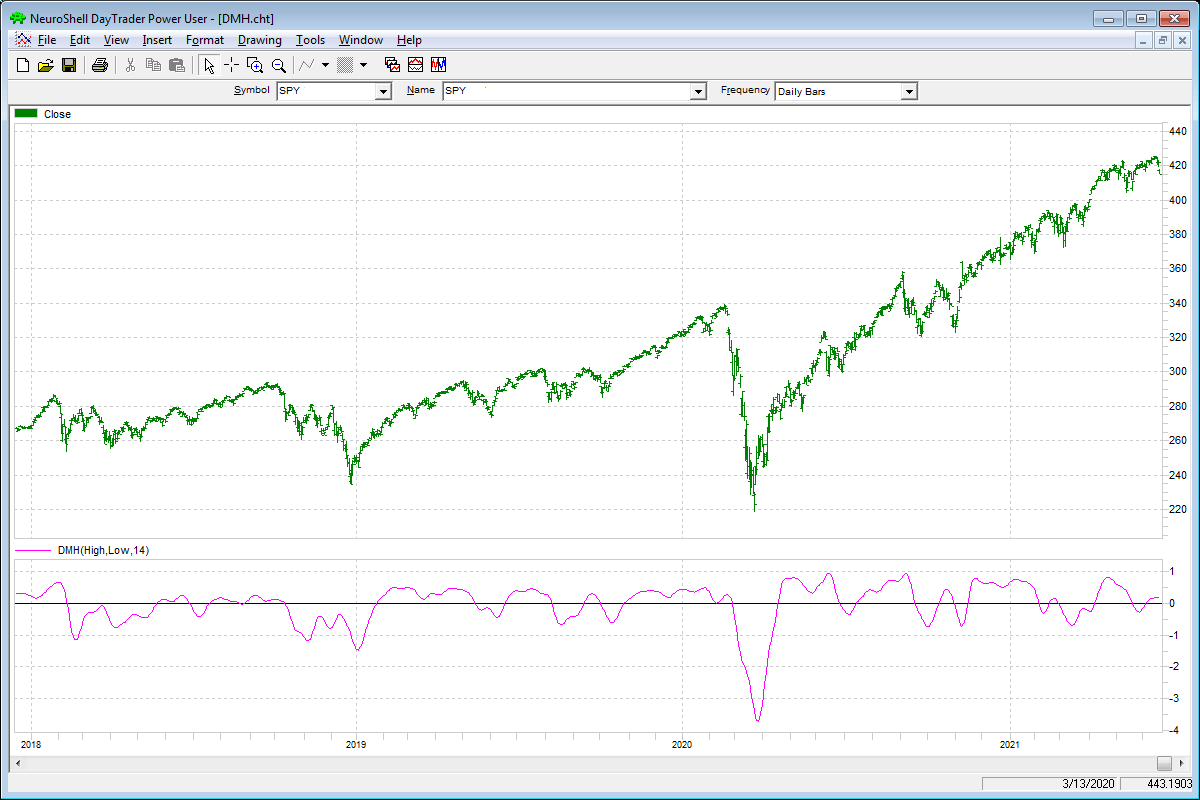
FIGURE 7: NEUROSHELL TRADER. This NeuroShell Trader chart shows the DMH indicator applied to SPY.
NeuroShell Trader users can go to the Stocks & Commodities section of the NeuroShell Trader free technical support website to download a copy of this or any previous Traders’ Tips.
—Ward Systems Group, Inc.
sales@wardsystems.com
www.neuroshell.com
BACK TO LIST

Optuma: December 2021
In his article in this issue, “The DMH: An Improved Directional Movement Indicator,” John Ehlers introduces his directional movement with Hann windowing indicator.
Here is the Optuma code for implementing this indicator, using the finite impulse response (FIR) filter available with our set of Ehlers tools (optuma.com/ehlers):
//Ehlers DMH Indicator;
#$Length = 14;
PlusDM = ADX(DEFAULT=DMPlus, BARS=1);
MinusDM = ADX(DEFAULT=DMMinus, BARS=1);
DM1 = PlusDM - MinusDM;
EMA = MA(DM1, STYLE=Exponential, CALC=Close, BARS=$Length);
//Use the Finite Impulse Response function to calculate the Hann Window;
FIR(EMA, BARS=$Length, SMOOTHSTYLE=Hann)
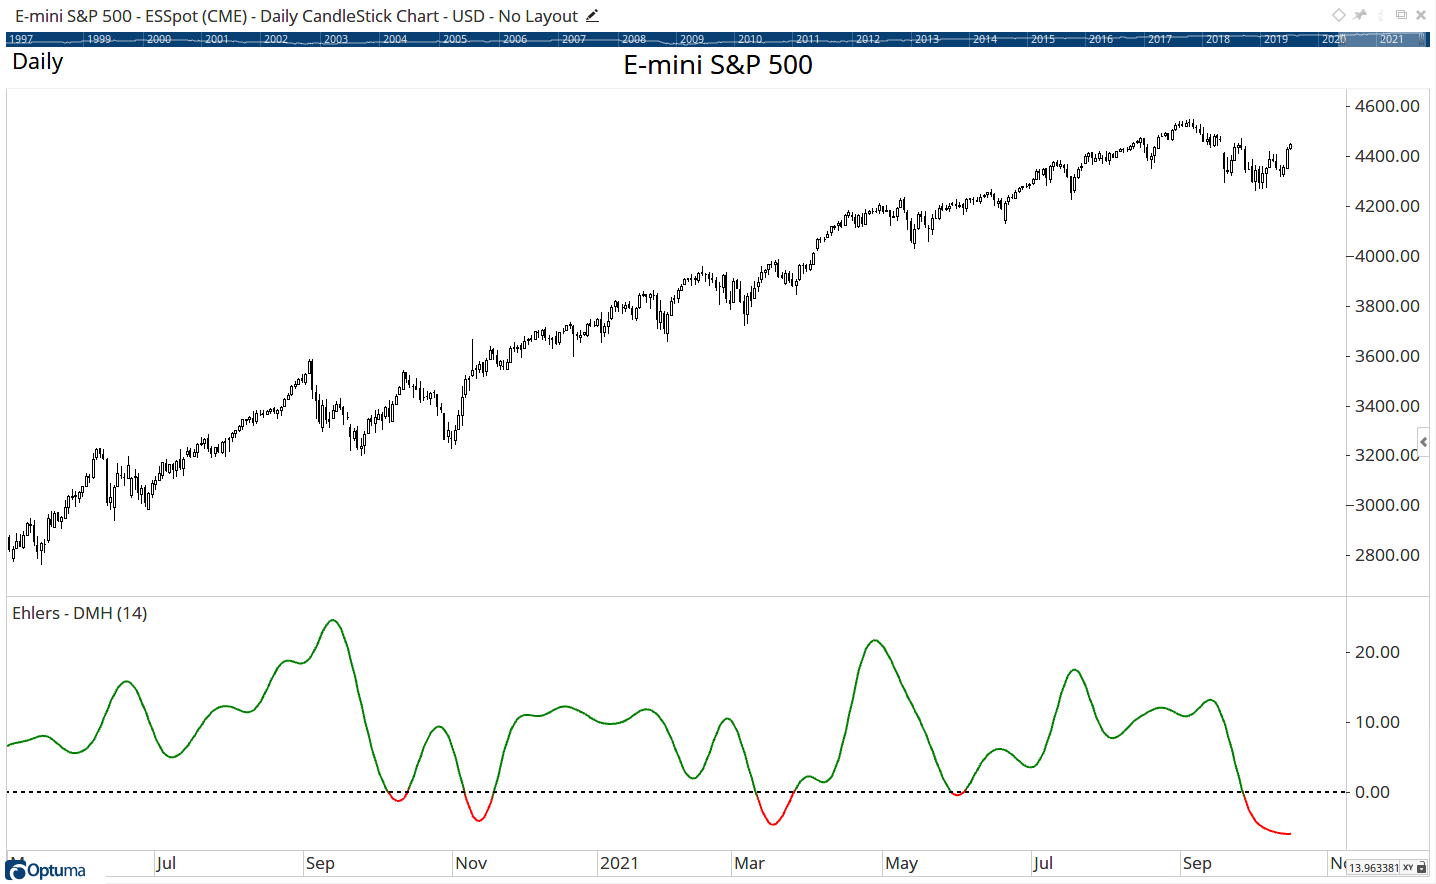
FIGURE 8: OPTUMA. This sample chart displays the DMH.
—support@optuma.com
BACK TO LIST

TradersStudio: December 2021
The importable TradersStudio files based on John Ehlers’ article in this issue, “The DMH: An Improved Directional Movement Indicator,” can be obtained on request via email to info@TradersEdgeSystems.com. The code is also shown below.
Code for the author’s indicator is provided in the following files:
- Function EHLERS_DMH: Computes DMH indicator
- Indicator plot EHLERS_DMH_IND: Plots the DMH indicator on a chart
'The DMH: An Improved Directional Movement Indicator
'Author: John F. Ehlers, TASC Dec 2021
'Coded by: Richard Denning, 10/10/2021

Function EHLERS_DMH(Len1)
    'Len1 = 14
    Dim SF As BarArray
    Dim PlusDM As BarArray
    Dim MinusDM As BarArray
    Dim UpperMove As BarArray
    Dim LowerMove As BarArray
    Dim theEMA As BarArray
    Dim DMSum As BarArray
    Dim coef As BarArray
    Dim count
    Dim DMH As BarArray

    If BarNumber=FirstBar Then
        'Len1 = 14
        SF = 0
        PlusDM = 0
        MinusDM = 0
        UpperMove = 0
        LowerMove = 0
        theEMA = 0
        DMSum = 0
        coef = 0
        count = 0
        DMH = 0
    End If

    SF = 1 / Len1
    UpperMove = High - High[1]
    LowerMove = Low[1] - Low
    PlusDM = 0
    MinusDM = 0
    If UpperMove > LowerMove And UpperMove > 0 Then
        PlusDM = UpperMove
    Else
        If LowerMove > UpperMove And LowerMove > 0 Then
            MinusDM = LowerMove
        End If
    End If
    theEMA = SF*(PlusDM - MinusDM) + (1 - SF)* theEMA[1]

'Smooth Directional Movements with Hann Windowed FIR filter
    DMSum = 0
    coef = 0
    For count = 1 To Len1
        DMSum = DMSum + (1 - TStation_Cosine(360*count / (Len1 + 1)))*theEMA[count - 1]
        coef = coef + (1 - TStation_Cosine(360*count / (Len1 + 1)))
    Next
    If coef <> 0 Then
        DMH = DMSum / coef
    End If
    EHLERS_DMH = DMH
End Function
'------------------------------------------------------------
'INDICATOR PLOT:
Sub EHLERS_DMH_IND(Len1)
  Dim DMH As BarArray
  DMH = EHLERS_DMH(Len1)
  plot1(DMH)
  plot2(0)
End Sub
'-------------------------------------------------------------
Figure 9 shows the indicator on a chart of Microsoft Inc. (MSFT) during 2012 and 2013.
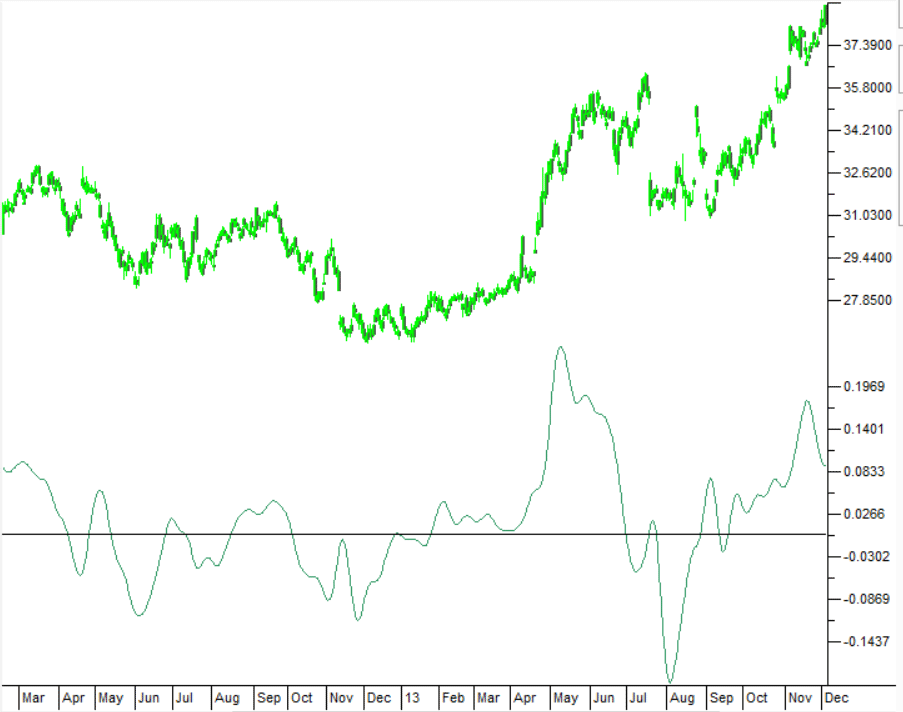
FIGURE 9: Tradersstudio. The DMH indicator on a chart of Microsoft Inc (MSFT) during 2012 and 2013.
—Richard Denning
info@TradersEdgeSystems.com
for TradersStudio
BACK TO LIST

The Zorro Project: December 2021
In this issue, John Ehlers describes a new usage for the Hann window in his article, “The DMH: An Improved Directional Movement Indicator.” His DMH indicator is based on J. Welles Wilder’s PlusDM and MinusDM indicators. A Hann window is applied to the output of the indicator. The code in C for Zorro follows:
var DMH(int Length)
{
  var SF = 1./Length;
  vars EMAs = series(0,Length);
  EMAs[0] = SF*(PlusDM(1)-MinusDM(1))+(1.-SF)*EMAs[1];
  return Sum(hann(EMAs,Length),Length);
}
The Hann() function is the same that we already used in several previous articles:
vars hann(vars Data,int Length)
{
   vars Out = series(0,Length);
   int i;
  for(i=0; i<Length; i++)
    Out[i] = Data[i] * (1-cos(2*PI*(i+1)/(Length+1)));
  return Out;
}
We do not normalize the output since its absolute value is not relevant here. For normalization, the Hann function can be simply applied to a series of 1s, and the reciprocal of the sum is then the normalization factor.
Here is the script for replicating Ehlers’ chart in his article with an SPY price curve. The resulting chart is shown in Figure 10.
void run()
{
  StartDate = 20190901;
  EndDate = 20210701;
  BarPeriod = 1440;

  asset("SPY");
  plot("DMH",DMH(14),NEW|LINE,RED);
}
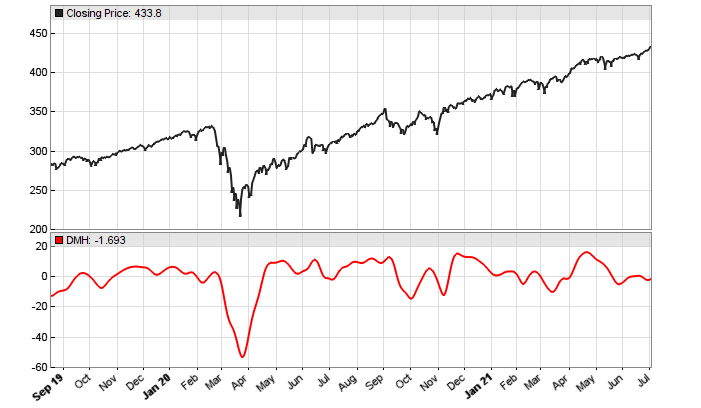
FIGURE 10: ZORRO PROJECT. This shows an example of the DMH indicator applied to SPY data.
The DMH indicator and test script can be downloaded from the 2021 script repository on https://financial-hacker.com. The Zorro platform can be downloaded from https://zorro-project.com.
—Petra Volkova
The Zorro Project by oP group Germany
https://zorro-project.com
BACK TO LIST

TradeStation: December 2021
In the article “The DMH: An Improved Directional Movement Indicator” in this issue, John Ehlers explores a method of modernizing directional movement with Hann windowing. Directional movement has been a mainstay in technical analysis and has been an examined concept by traders for decades. When the original directional movement indicator was created by J. Welles Wilder, technology did not easily allow for complex calculations. Ehlers proposes it is time for an upgrade. While the DMH indicator defaults to using Wilder’s 14 bars, Ehlers suggests the length should be at the discretion of the trader or can be determined by optimization if the DMH is used in a strategy.
Indicator:  TASC DEC 2021 DMH
// TASC DEC 2021
// DMH - Directional Movement using Hann windowing
// (C) 2021 John F. Ehlers

inputs:
	Length(14);

variables:
	SF(0), PlusDM(0), MinusDM(0),
	UpperMove(0), LowerMove(0), EMA(0),
	DMSum(0), coef(0), count(0), DMH(0);

SF = 1 / Length;
UpperMove = High - High[1];
LowerMove = Low[1] - Low;
PlusDM = 0 ;
MinusDM = 0 ;

if UpperMove > LowerMove and UpperMove > 0 then
	PlusDM = UpperMove
else if LowerMove > UpperMove and LowerMove > 0 then
	MinusDM = LowerMove;

EMA = SF*(PlusDM - MinusDM) + (1 - SF)* EMA[1];
//Smooth Directional Movements with Hann Windowed FIR filter

DMSum = 0;
coef = 0;

for count = 1 to Length
begin
	DMSum = DMSum + (1 - Cosine(360*count / (Length +
	 1)))*EMA[count - 1];
	coef = coef + (1 - Cosine(360*count / (Length + 1)));
end;

if coef <> 0 then DMH = DMSum / coef;

Plot1(DMH, "DMH");
Plot2(0, "Zero");
A sample chart is shown in Figure 11.
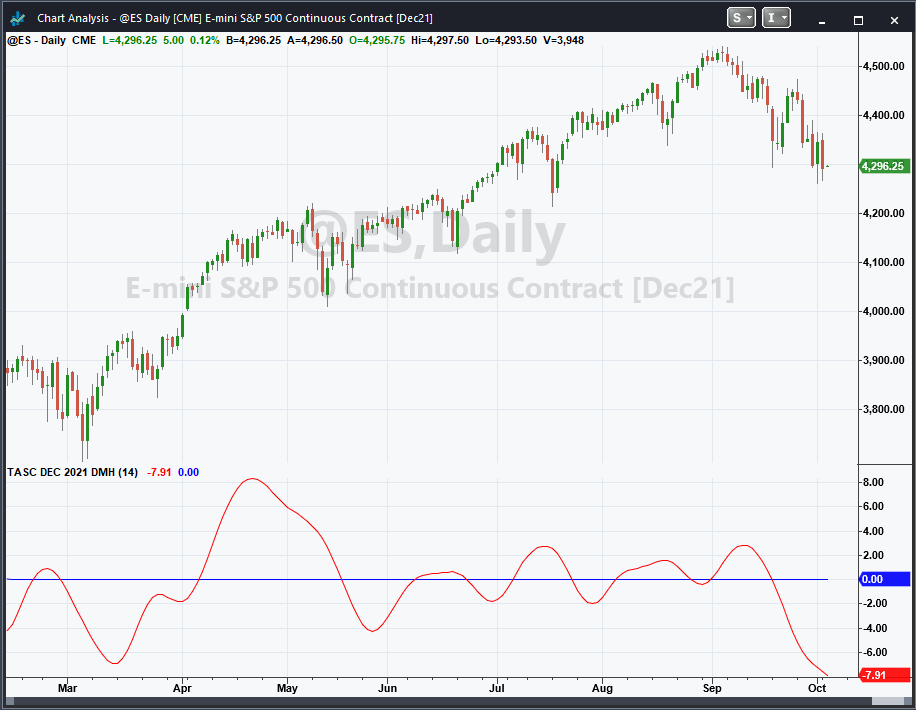
FIGURE 11: TRADESTATION. This shows a TradeStation daily chart of the continuous emini S&P 500 with the indicator applied.
This article is for informational purposes. No type of trading or investment recommendation, advice, or strategy is being made, given, or in any manner provided by TradeStation Securities or its affiliates.
—John Robinson
TradeStation Securities, Inc.
www.TradeStation.com
BACK TO LIST
Microsoft Excel: December 2021
In his article in this issue, “The DMH: An Improved Directional Movement Indicator,” John Ehlers presents a modification to the classic directional movement indicator by using Hann windowing coefficients.
Use your Mark 1 Eyeball (as they say in military parlance) on Figure 12. Quite an improvement. You can observe that the moves of the DMH echo both the strength and local direction of the trends on our chart. The relatively smooth ROC (rate of change) crossovers pinpoint the DMH trend reversals and thus potential trading entries.
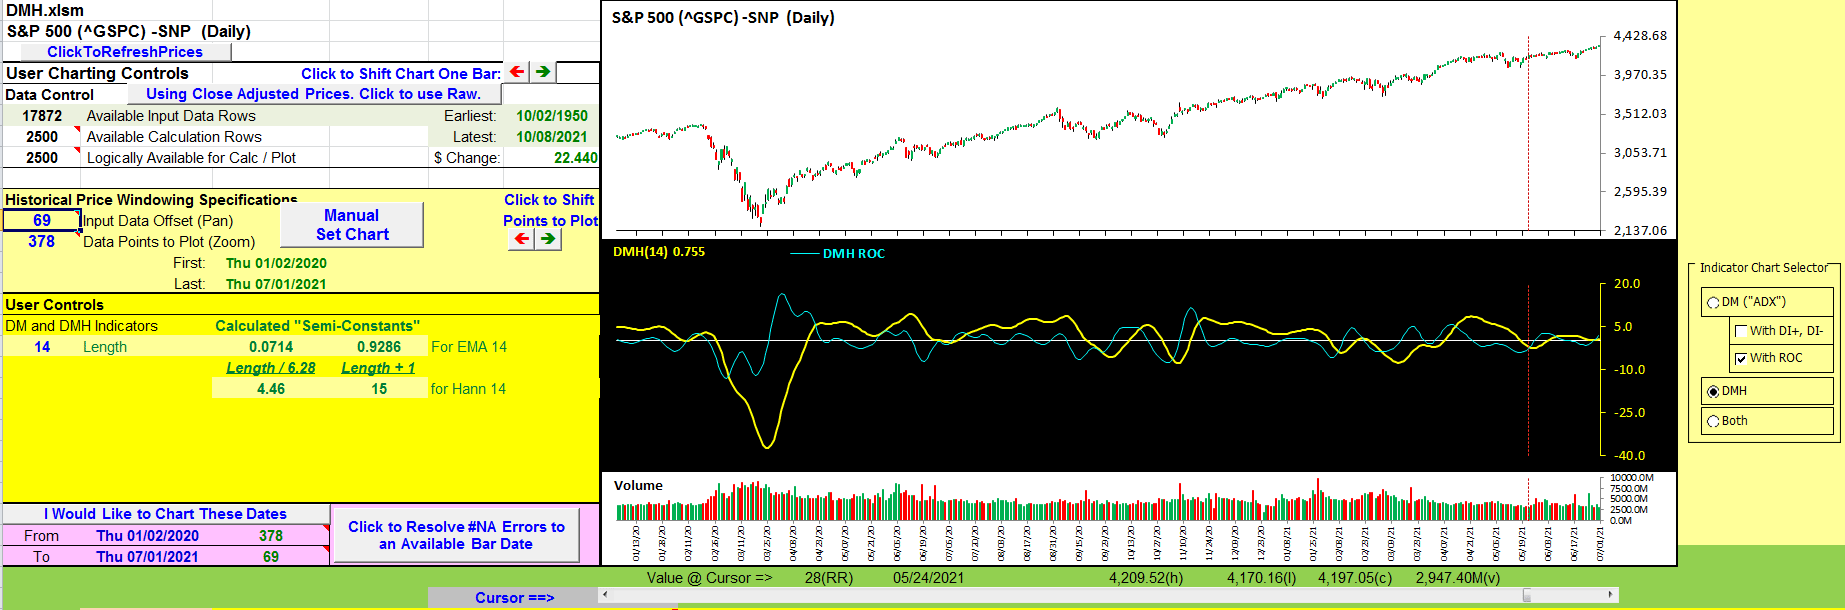
FIGURE 12: EXCEL, DMH WITH RATE OF CHANGE. The relatively smooth ROC (rate of change) crossovers pinpoint the DMH.
In an effort to reduce the potential for whipsaws, we should probably filter DMH signals with an overall trend indicator. One possibility would be 9- and 15-bar EMAs of the close. Take the long DMH signals when the 9 bar is above the 15 bar and take short DMH signals when the 9 bar is below the 15 bar.
For comparison, in Figure 13 we have the starting point of Ehlers’ discussion, the DMI (a.k.a. the ADX) plotted above the DMH. The DMI (ADX) is a strength-of-trend indicator. By itself, DMI tells us nothing about direction of a trend. The DMI will show high values for either strong uptrends or strong downtrends and low values for generally sideways movements.

FIGURE 13: EXCEL, COMPARING DMI AND DMH. The directional movement indicator (DMI; also known as the ADX) is plotted here above the DMH.
As with other charts, the ROC of DMI will still indicate reversals of strength. But as we can see, for DMI, ROC is plenty choppy.
To add directionality to a DMI (ADX) chart, we add two components of the DMI calculation, the +DI and the –DI lines (see Figure 14). When the +DI line is above the –DI line, the trend is rising and when the –DI line is above the +DI line, the trend is falling.
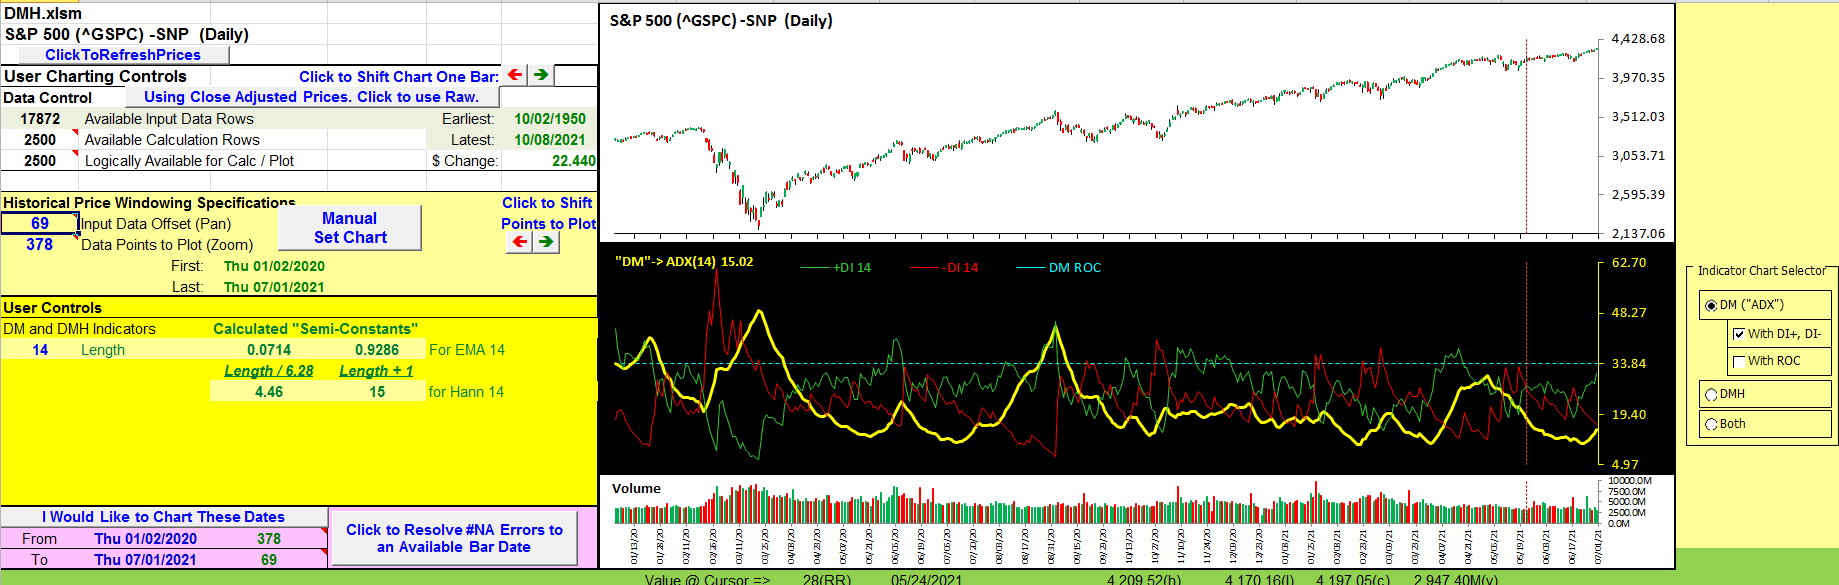
FIGURE 14: EXCEL. DMI (ADX) with +DI and -DI. To add directionality to a DMI (ADX) chart, two components of the DMI calculation, the +DI and the –DI lines, are added. When the +DI line is above the –DI line, the trend is rising and when the –DI line is above the +DI line, the trend is falling.
DMH does a reasonable job of taking us from needing to mentally combine three pieces of information to looking at a single indicator to get an idea of both local trend direction and local trend strength.
To download this spreadsheet: The spreadsheet file for this Traders’ Tip can be downloaded here. To successfully download it, follow these steps:
- Right-click on the Excel file link, then
- Select “save as” (or “save target as”) to place a copy of the spreadsheet file on your hard drive.
—Ron McAllister
Excel and VBA programmer
rpmac_xltt@sprynet.com
BACK TO LIST
Originally published in the December 2021 issue of
Technical Analysis of STOCKS & COMMODITIES magazine.
All rights reserved. © Copyright 2021, Technical Analysis, Inc.