TRADERS’ TIPS
January 2022
For this month’s Traders’ Tips, the focus is John Ehlers’ article in this issue, “(Yet Another) Improved RSI.” Here, we present the January 2022 Traders’ Tips code with possible implementations in various software.
You can right-click on any chart to open it in a new tab or window and view it at it’s originally supplied size, often much larger than the version printed in the magazine.
The Traders’ Tips section is provided to help the reader implement a selected technique from an article in this issue or another recent issue. The entries here are contributed by software developers or programmers for software that is capable of customization.

TradeStation: January 2022
In his article in this issue, “(Yet Another) Improved RSI,” John Ehlers explains how he enhances the RSI by taking advantage of Hann windowing. The RSIH indicator provides a smoother calculation than the classic RSI and has a zero mean. The inherent smoothing in the computation removes the need for supplemental filtering. The best length to use for the RSIH is described to be one that is on the order of the dominant cycle period in the data.
Indicator:  TASC DEC 2021 RSIH
// TASC JAN 2022
// RSIH - RSI with Hann Windowing
// (C) 2005-2021 John F. Ehlers

inputs:
	RSILength(14);

variables:
	count(0),
	CU(0),
	CD(0),
	MyRSI(0);

// Accumulate "Closes Up" and "Closes Down"
CU = 0;
CD = 0;

for count = 1 to RSILength begin
	if Close[count - 1] - Close[count] > 0 then
	 CU = CU + (1 - Cosine(360*count / (RSILength + 1)))
	 *(Close[count - 1] - Close[count]);
	if Close[count] - Close[count - 1] > 0 then
	 CD = CD + (1 - Cosine(360*count / (RSILength + 1)))
	 *(Close[count] - Close[count - 1]);
end;

if CU + CD <> 0 then
	MyRSI = (CU - CD) / (CU + CD);

Plot1(MyRSI, "RSIH");
Plot2(0, "Zero");
A sample chart is shown in Figure 1.

FIGURE 1: TRADESTATION. A daily chart of the continuous emini S&P 500 futures is shown with the classic RSI in the upper pane and the RSIH in the lower pane.
This article is for informational purposes. No type of trading or investment recommendation, advice, or strategy is being made, given, or in any manner provided by TradeStation Securities or its affiliates.
—John Robinson
TradeStation Securities, Inc.
www.TradeStation.com
BACK TO LIST

TradingView: January 2022
Here is the TradingView Pine code for implementing the RSIH indicator based on John Ehlers’ article in this issue, “(Yet Another) Improved RSI Enhanced With Hann Windowing.” The calculation of “closes up” and “closes down” are similar to those of Wilder’s RSI, but Hann windowing is used instead of moving averages. The resulting oscillator has a zero centerline (Figure 2).
//  TASC Issue: January 2022 - Vol. 40, Issue 1
//     Article: "(Yet Another) Improved RSI
//               Enhanced With Hann Windowing"
//  Article By: John F. Ehlers
//    Language: TradingView's Pine Script v5
// Provided By: PineCoders, for tradingview.com

//@version=5
indicator("TASC 2022.01 Improved RSI w/Hann", "RSIH")

lengthInput = input.int(14, "Length:", minval = 2)

rsih(length) =>
    var float PIx2 = 2 * math.pi
    // Accumulate "Closes Up" and "Closes Down"
    cu = 0.0
    cd = 0.0
    for count = 1 to length
    	change = close[count] - close[count - 1]
    	absChange = math.abs(change)
    	cosPart = math.cos(PIx2 * count / (length + 1))

    	if change < 0
    		cu := cu + (1 - cosPart) * absChange
    	else if change > 0
    		cd := cd + (1 - cosPart) * absChange

    result = nz((cu - cd) / (cu + cd))

signal = rsih(lengthInput)
plotColor = signal > 0.0 ? #00FF00   : #FF0080
areaColor = signal > 0.0 ? #00FF0055 : #FF008055
plot(signal, "Area", areaColor, 1, plot.style_area)
plot(signal, "RSIH", plotColor, 2)
hline(0, "Zero", color.gray)
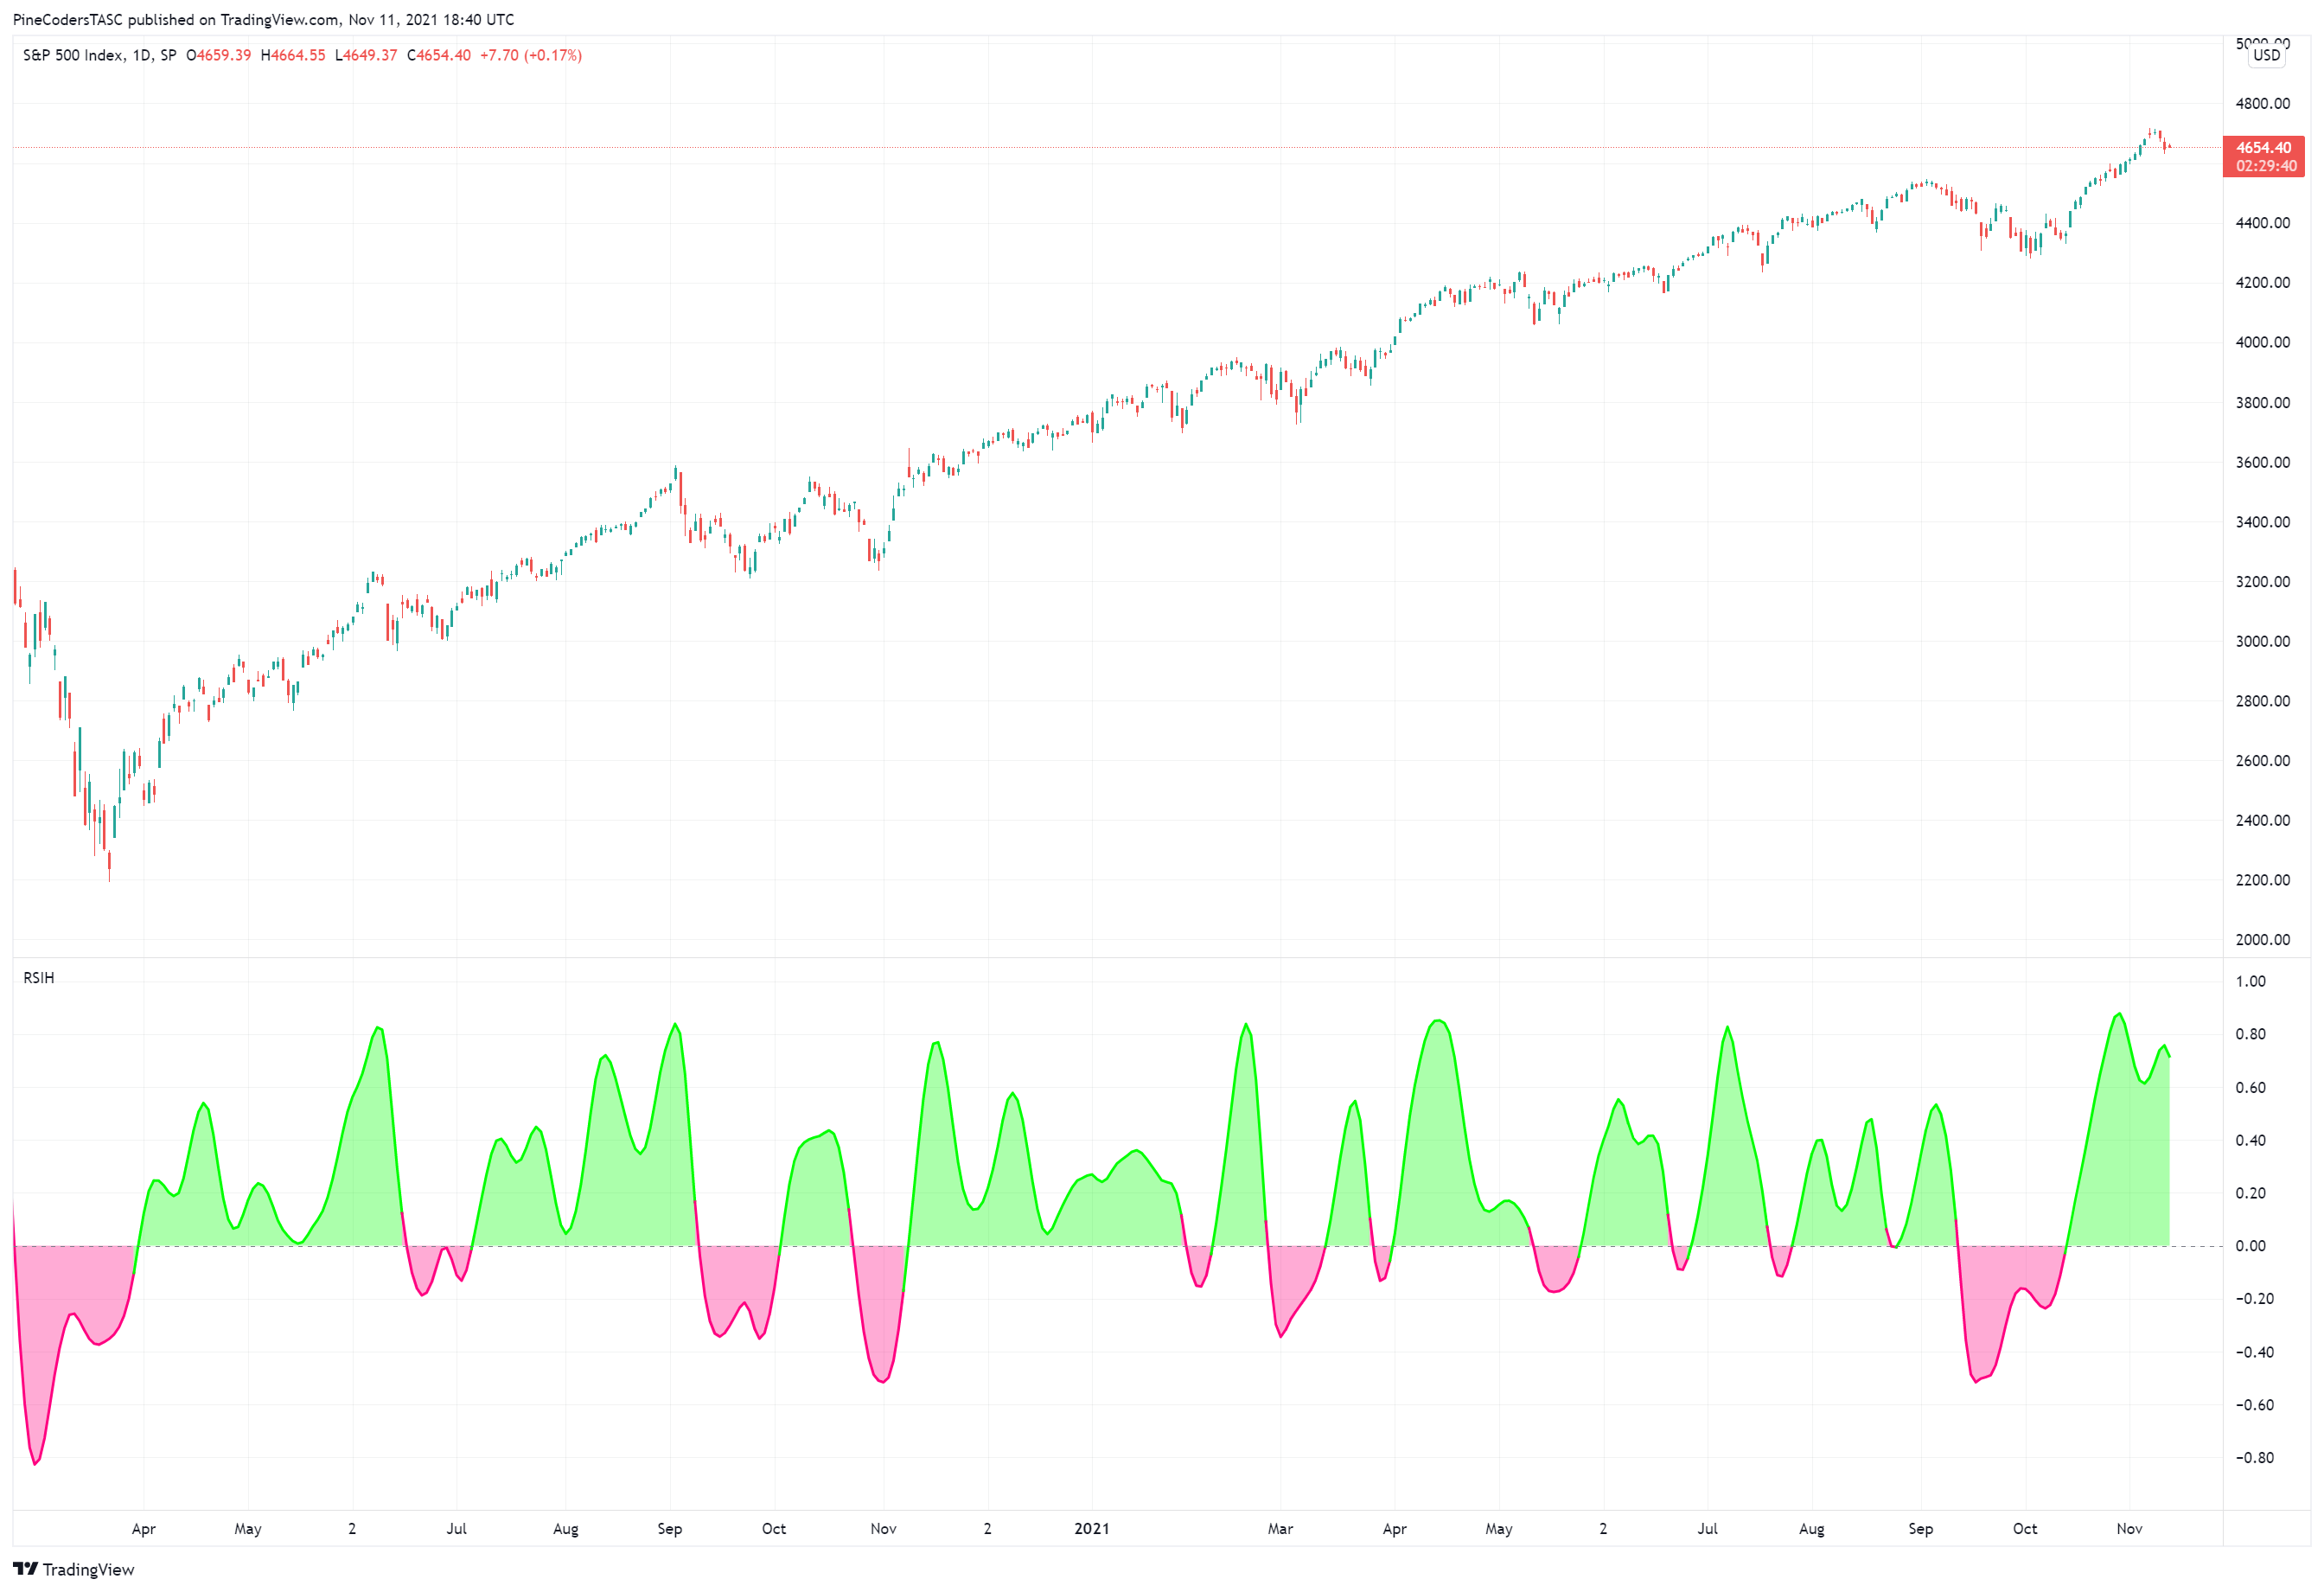
FIGURE 2: TRADINGVIEW. The RSIH (an improved RSI using Hann windowing coefficients) is shown on a chart of continuous emini S&P 500 futures. The resulting oscillator has a zero centerline.
The indicator is available on TradingView from the PineCodersTASC account at the following link: https://www.tradingview.com/u/PineCodersTASC/#published-scripts.
—Pinecoders, for TradingView
https://www.tradingview.com
BACK TO LIST

eSIGNAL: January 2022
For this month’s Traders’ Tip, we’ve provided the study “RSI with Hann Windowing.efs” based on the article in this issue by John Ehlers titled “(Yet Another) Improved RSI.” This study offers an improvement over the classic RSI oscillator by applying a finite impulse response (FIR) filter using Hann window coefficients.
The study contains formula parameters that may be configured through the edit chart window (right-click on the chart and select “edit chart”). A sample chart is shown in Figure 3.

FIGURE 3: eSIGNAL. Here is an example of the study plotted on a daily chart of SPY.
To discuss this study or download a complete copy of the formula code, please visit the EFS library discussion board forum under the forums link from the support menu at www.esignal.com or visit our EFS KnowledgeBase at www.esignal.com/support/kb/efs. The eSignal formula script (EFS) is also available for copying & pasting below.
/**********************************
Provided By:
Copyright 2019 Intercontinental Exchange, Inc. All Rights Reserved.
eSignal is a service mark and/or a registered service mark of Intercontinental Exchange, Inc.
in the United States and/or other countries. This sample eSignal Formula Script (EFS)
is for educational purposes only.
Intercontinental Exchange, Inc. reserves the right to modify and overwrite this EFS file with each new release.

Description:
    (Yet Another) Improved RSI
    by John F. Ehlers


Version:            1.00  11/11/2021

Formula Parameters:                    Default:
RSILength                              14


Notes:
The related article is copyrighted material. If you are not a subscriber
of Stocks & Commodities, please visit www.traders.com.

**********************************/
var fpArray = new Array();
var bInit = false;

function preMain() {
    setStudyTitle("RSI with Hann Windowing");
    setCursorLabelName("RSIH", 0);
    setPriceStudy(false);
    setDefaultBarFgColor(Color.RGB(0x00,0x94,0xFF), 0);
    setPlotType( PLOTTYPE_LINE , 0 );


    var x=0;
    fpArray[x] = new FunctionParameter("RSILength", FunctionParameter.NUMBER);
	with(fpArray[x++]){
        setLowerLimit(1);
        setDefault(14);
    }
}

var bVersion = null;
var xClose = null;
var xRSIH = null;
var RSILength = null;
var CU = null;
var CD = null;


function main(RSILength) {
    if (bVersion == null) bVersion = verify();
    if (bVersion == false) return;

    if ( bInit == false ) {
        xClose = close();
        addBand(0, PS_DASH, 1, Color.grey, 1);
        xRSIH = efsInternal('Calc_RSIH', xClose, RSILength);

        bInit = true;
    }

    if (getCurrentBarCount() < RSILength) return;
    return xRSIH.getValue(0);
}

function Calc_RSIH(xClose, RSILength){
    ret = 0;
    CU = 0;
    CD = 0;
    for (var i = 1; i <= RSILength; i++){
        if ((xClose.getValue(-i+1) - xClose.getValue(-i)) > 0) {
           CU = CU + (1 - Math.cos(2 * Math.PI * i / (RSILength + 1))) * (xClose.getValue(-i+1) - xClose.getValue(-i))
        }
        if ((xClose.getValue(-i) - xClose.getValue(-i+1)) > 0) {
            CD = CD + (1 - Math.cos(2 * Math.PI * i / (RSILength + 1))) * (xClose.getValue(-i) - xClose.getValue(-i+1))
        }
    }
    if (CU + CD != 0) ret = (CU - CD) / (CU + CD);
    return ret;
}

function verify(){
    var b = false;
    if (getBuildNumber() < 779){

        drawTextAbsolute(5, 35, "This study requires version 10.6 or later.",
            Color.white, Color.blue, Text.RELATIVETOBOTTOM|Text.RELATIVETOLEFT|Text.BOLD|Text.LEFT,
            null, 13, "error");
        drawTextAbsolute(5, 20, "Click HERE to upgrade.@URL=https://www.esignal.com/download/default.asp",
            Color.white, Color.blue, Text.RELATIVETOBOTTOM|Text.RELATIVETOLEFT|Text.BOLD|Text.LEFT,
            null, 13, "upgrade");
        return b;
    }
    else
        b = true;

    return b;
}
—Eric Lippert
eSignal, an Interactive Data company
800 779-6555, www.eSignal.com
BACK TO LIST

Wealth-Lab.com: January 2022
The RSIH indicator is ready for use in Wealth-Lab 7. You can apply it equally easy in its various tools like Building Blocks (to create no-code trading strategies), Indicator Profiler (which tells how much of an edge an indicator provides) and of course Optimization.
According to Ehlers, the default period 14 may not be the optimal period and a better period is half the dominant cycle period in the data. We mocked up a quick optimization of the lookback period value in an SPY trading system and arrived at 16 being the best-performing choice (Figure 4).
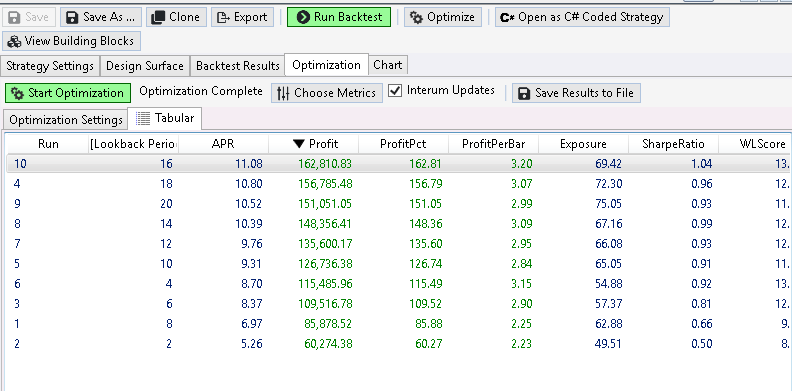
FIGURE 4: WEALTH-LAB. This demonstrates finding an optimization of RSIH period in a trading system.
Prototyping a trading system using Wealth-Lab’s building blocks doesn’t take much effort. Figure 5 shows a countertrend system in action, designed in under a minute. Its two simplest rules tell the program to buy when the 16-period RSIH crosses under -0.3 (oversold) and sell when it crosses above 0.7 (overbought).
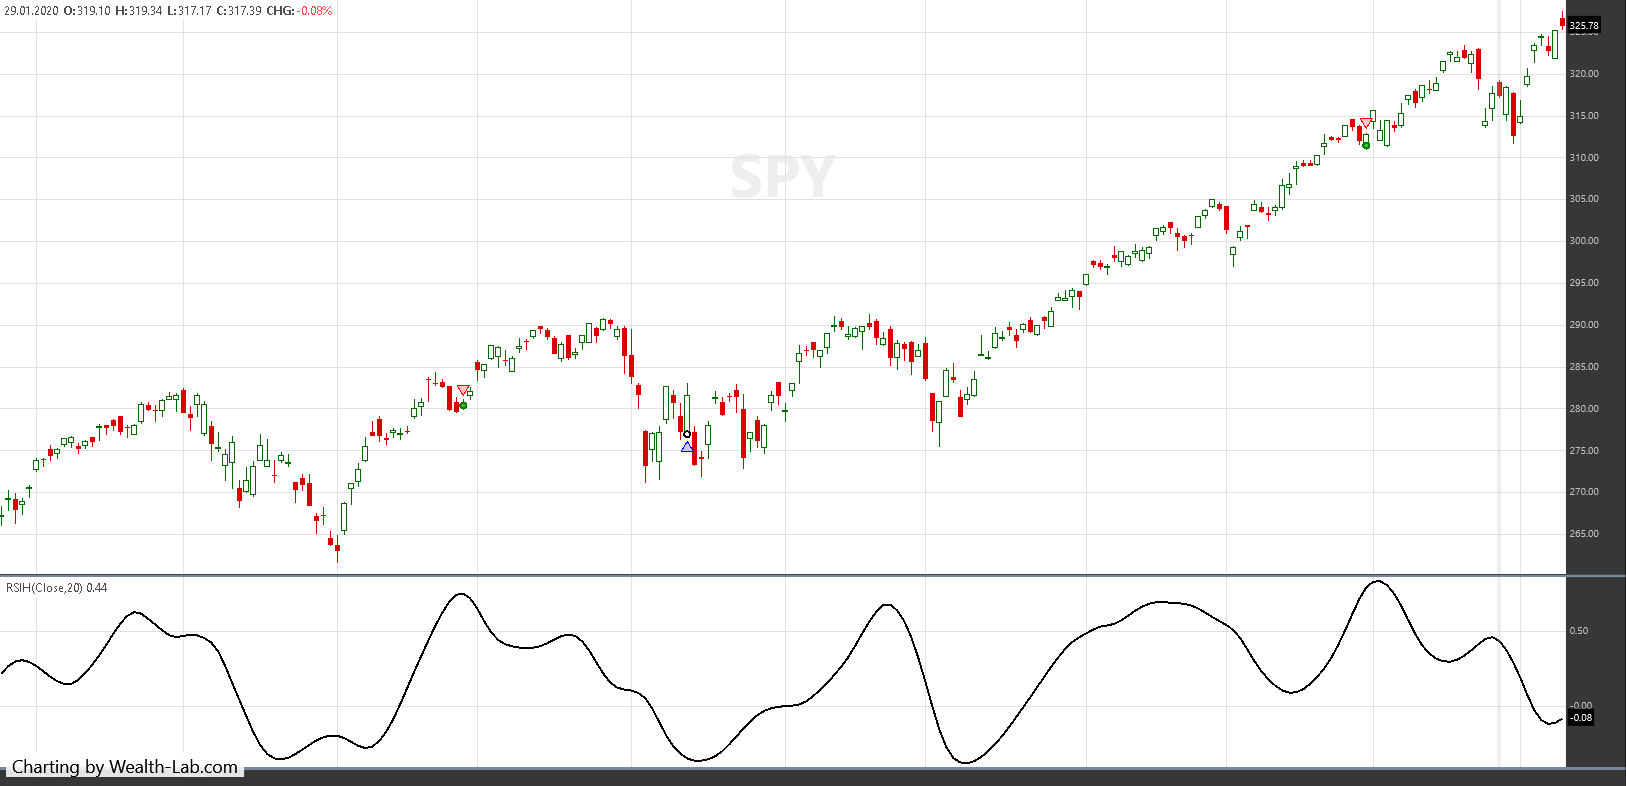
FIGURE 5: WEALTH-LAB. This shows sample trades taken by the system if applied to a daily chart of SPY.
—Gene Geren (Eugene)
Wealth-Lab team
www.wealth-lab.com
BACK TO LIST

NinjaTrader: January 2022
The RSIH, which is the classic RSI with Hann Windowing indicator, is discussed in John Ehlers’ article in this issue, “(Yet Another) Improved RSI.” This indicator is available for download at the following links for NinjaTrader 8 and for NinjaTrader 7:
Once the file is downloaded, you can import the indicator into NinjaTrader 8 from within the control center by selecting Tools → Import → NinjaScript Add-On and then selecting the downloaded file for NinjaTrader 8. To import into NinjaTrader 7, from within the control center window, select the menu File → Utilities → Import NinjaScript and select the downloaded file.
You can review the source code for this indicator in NinjaTrader 8 by selecting the menu New → NinjaScript Editor → Indicators from within the control center window and selecting the RSIH file. You can review the indicator’s source code in NinjaTrader 7 by selecting the menu Tools → Edit NinjaScript → Indicator from within the control center window and selecting the RSIH file.
NinjaScript uses compiled DLLs that run native, not interpreted, which provides you with the highest performance possible.
A sample chart displaying the indicator is shown in Figure 6.

FIGURE 6: NINJATRADER. This daily chart shows the emini S&P 500 futures Dec 2021 contract with the RSIH indicator from 11/1/2019 through 7/5/2021.
—Kate Windheuser
NinjaTrader, LLC
www.ninjatrader.com
BACK TO LIST

Neuroshell Trader: January 2022
John Ehlers’ RSIH indicator, as described in his article in this issue, can be easily implemented in NeuroShell Trader using NeuroShell Trader’s ability to call external dynamic linked libraries. Dynamic linked libraries can be written in C, C++, and Power Basic.
After moving the code given in the article to your preferred compiler and creating a DLL, you can insert the resulting indicator as follows:
- Select “New indicator …” from the insert menu.
- Choose the external program & library calls category.
- Select the appropriate external DLL call indicator.
- Set up the parameters to match your DLL.
- Select the finished button.

FIGURE 7: NEUROSHELL TRADER. This NeuroShell Trader chart shows the standard RSI and RSIH indicators applied to SPY.
NeuroShell Trader users can go to the Stocks & Commodities section of the NeuroShell Trader free technical support website to download a copy of this or any previous Traders’ Tips.
—Ward Systems Group, Inc.
sales@wardsystems.com
www.neuroshell.com
BACK TO LIST

Optuma: January 2022
In his article in this issue, “(Yet Another) Improved RSI,” John Ehlers introduces a new version of the classic RSI oscillator by applying Hann window coefficients to come up with his RSIH.
At www.optuma.com/ehlers we offer to all Optuma users a collection of tools designed by John Ehlers. There, users will find the Ehlers MyRSI tool. Users will also find the Hann window technique in the finite impulse response (FIR) tool. Using these tools, the user can apply the Hann window to the MyRSI indicator.
Alternatively, below, we are providing a script that can also be used to create the RSIH tool:
//Set Length;
#$Length = 14;
//Calculate Ehlers MyRSI;
R1 = MYRSI(BARS=$Length);
//Use the Hann Finite Impulse Response Filter of the MyRSI;
FIR(R1, BARS=$Length, SMOOTHSTYLE=Hann)
An example application of the RSIH oscillator is shown in the chart in Figure 8.
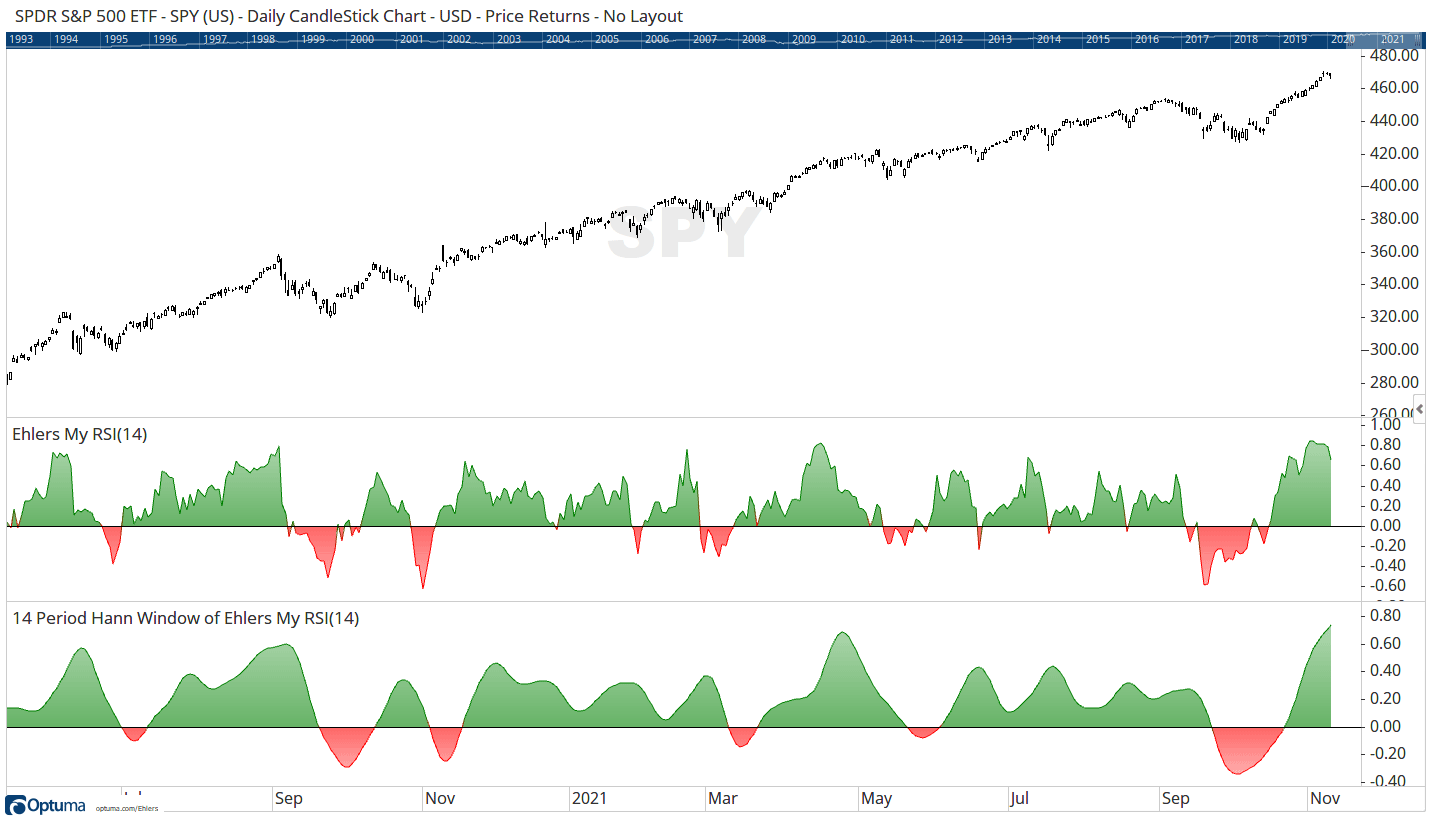
FIGURE 8: OPTUMA. This sample chart displays the RSIH.
—support@optuma.com
BACK TO LIST

TradersStudio: January 2022
The importable TradersStudio files based on John Ehlers’ article in this issue, “(Yet Another) Improved RSI,” can be obtained on request via email to info@TradersEdgeSystems.com. The code is also shown here:
'(Yet Another) Improved RSI
'Author: John F. Ehlers, TASC Jan 2022
'Coded by: Richard Denning, 11/05/2021

'RSIH - RSI with Hann Windowing
'(C) 2005-2021  John F. Ehlers

Function EHLERS_RSIH(RSILength)
    Dim count
    Dim CU As BarArray
    Dim CD As BarArray
    Dim MyRSI As BarArray

    If BarNumber=FirstBar Then
        'RSILength = 14
        count = 0
        CU = 0
        CD = 0
        MyRSI = 0
    End If

    CU = 0
    CD = 0
    For count = 1 To RSILength
        If Close[count - 1] - Close[count] > 0 Then
            CU = CU + (1 - TStation_Cosine(360*count/(RSILength+1)))*(Close[count-1]-Close[count])
        End If
        If Close[count] - Close[count - 1] > 0 Then
            CD = CD + (1 - TStation_Cosine(360*count/(RSILength+1)))*(Close[count]-Close[count-1])
        End If
    Next

    If CU + CD <> 0 Then
        MyRSI = (CU - CD)/(CU + CD)
    End If

    EHLERS_RSIH = MyRSI
End Function
'-----------------------------------
'INDICATOR PLOT
Sub EHLERS_RSIH_IND(RSIHLength)
Dim myRSIH As BarArray
myRSIH = EHLERS_RSIH(RSIHLength)
plot1(myRSIH)
plot2(0)
End Sub
'-----------------------------------
Code for the author’s indicator is provided in the following files:
Function EHLERS_RSIH: Computes RSIH indicator
Indicator plot EHLERS_RSIH_IND: Plots the RSIH indicator on a chart
Figure 9 shows the indicator on a chart of Microsoft Inc. (MSFT) during 2012 and 2013.

FIGURE 9: TRADERSSTUDIO. The RSIH indicator is shown on a chart of Microsoft Inc (MSFT) during 2012 & 2013.
—Richard Denning
info@TradersEdgeSystems.com
for TradersStudio
BACK TO LIST

The Zorro Project: January 2022
In this issue, John Ehlers introduces a new version of the classic RSI oscillator that he feels is improved by applying Hann windowing.
The RSIH is an RSI with the Hann window applied to the price differences. The code in C for Zorro is as follows:
var RSIH(vars Data, int Length) {
   var CU = 0, CD = 0;
  int i;
  for(i=1; i<Length; i++) {
    var D = priceClose(i-1)-priceClose(i);
    var Hann = 1-cos(2*PI*i/(Length+1));
    if(D > 0) CU += Hann*D;
    else if(D < 0) CD -= Hann*D;
  }
  if(CU+CD != 0)
    return (CU-CD) / (CU+CD);
  else return 0;
}
According to Ehlers, the optimal length parameter is the dominant cycle of the price series. For recreating his SPY chart, we use this following code:
void run() {
  StartDate = 20190901;
  EndDate = 20210701;
  BarPeriod = 1440;

  asset("SPY");
  plot("RSI",RSI(seriesC(),14),NEW|LINE,BLUE);
  plot("RSIH",RSIH(seriesC(),14),NEW|LINE,RED);
}
The resulting chart (Figure 10) matches Ehlers’ example chart given in his article. The curve by the RSIH is smoother than the original RSI curve.
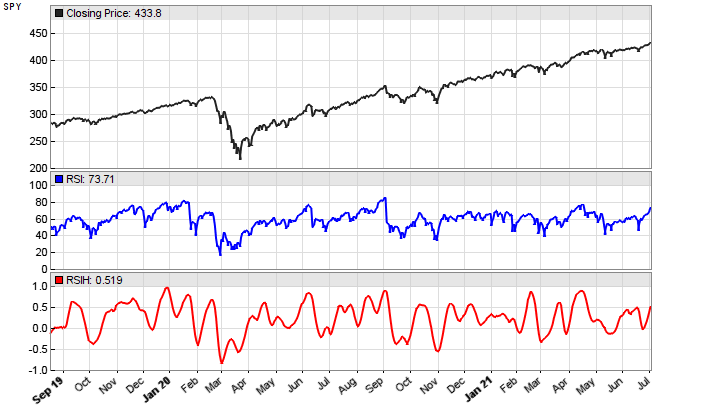
FIGURE 10: ZORRO PROJECT. This shows an example of the RSIH indicator applied to SPY data.
In my experimentation with it, you cannot simply substitute the RSI with the RSIH in an existing trading strategy (and adapt the scale accordingly).
The RSIH indicator and test script can be downloaded from the 2022 script repository on https://financial-hacker.com. The Zorro platform can be downloaded from https://zorro-project.com.
—Petra Volkova
The Zorro Project by oP group Germany
https://zorro-project.com
BACK TO LIST

thinkorswim: January 2022
We put together a study based on the article by John Ehlers titled “(Yet Another) Improved RSI.” We built the strategy referenced by using our proprietary scripting language, thinkscript. To ease the loading process, simply open the link: https://tos.mx/sveoBDR or enter this address into setup → open shared item from within thinkorswim, then choose view thinkScript study and name it “RSIH” or whatever name you like and can identify. You can then add the strategy to your charts from the edit studies menu from within the charts tab and then selecting studies.
The chart in Figure 11 shows the study added to a two-year daily chart of SPY, along with the classic RSI for comparison. Please see John Ehlers’ article in this issue for more information on how to utilize the study.

FIGURE 11: THINKORSWIM. This shows the study added to a two year daily chart of SPY along with a RSI for comparison.
—thinkorswim
A division of TD Ameritrade, Inc.
www.thinkorswim.com
BACK TO LIST
Microsoft Excel: January 2022
In his article in this issue, “(Yet Another) Improved RSI,” John Ehlers presents a modification to the classic RSI indicator by using Hann window coefficients.
Figure 12 shows an example of the RSIH on a chart. We can see that the RSIH definitely takes a lot of kinks out of the classic RSI.

FIGURE 12: EXCEL. The RSIH is much smoother than the traditional RSI.
The traditional RSI is typically used with overbought and oversold threshold values. Historically, values below 30 are considered to be oversold and values above 70 are considered overbought (Figure 13). Therefore, Ehlers’ discussion of RSIH in his article in this issue has left me wondering: What RSIH threshold values will best represent oversold and overbought conditions?

FIGURE 13: EXCEL. Shown here is the traditional RSI with overbought and oversold thresholds.
My first estimate is as follows:
With traditional RSI, we have 30% in the oversold and 30% in the overbought areas. This leaves 40% as the mid-ground.
With RSIH centered about zero, we have a working range min and max of −1 to +1, or a span of 2.
40% of 2 equates to a mid-ground span of 0.8.
Centering this mid-ground span implies a range of −0.4 to +0.4, as shown in Figure 14.

FIGURE 14: EXCEL. This shows estimated RSIH oversold and overbought thresholds compared to traditional RSI values.
Feel free to adjust cells B22 and C22 to explore other values.
To download this spreadsheet: The spreadsheet file for this Traders’ Tip can be downloaded here. To successfully download it, follow these steps:
- Right-click on the Excel file link, then
- Select “save as” (or “save target as”) to place a copy of the spreadsheet file on your hard drive.
—Ron McAllister
Excel and VBA programmer
rpmac_xltt@sprynet.com
BACK TO LIST
Originally published in the January 2022 issue of
Technical Analysis of STOCKS & COMMODITIES magazine.
All rights reserved. © Copyright 2021, Technical Analysis, Inc.


