TRADERS’ TIPS
February 2022

For this month’s Traders’ Tips, the focus is John F. Ehlers’ article in this issue, “An Elegant Oscillator: Inverse Fisher Transform Redux.” Here, we present the February 2022 Traders’ Tips code with possible implementations in various software.
You can right-click on any chart to open it in a new tab or window and view it at it’s originally supplied size, often much larger than the version printed in the magazine.
The Traders’ Tips section is provided to help the reader implement a selected technique from an article in this issue or another recent issue. The entries here are contributed by software developers or programmers for software that is capable of customization.

TradeStation: February 2022
In his article in this issue, “An Elegant Oscillator: Inverse Fisher Transform Redux,” author John Ehlers explains how he uses the inverse Fisher transform to create an indicator he calls the elegant oscillator. First, he describes the Fisher transform before explaining the inverse Fisher transform, which provides normalization by dividing the root mean square (RMS) value into the waveform. The elegant oscillator can be used to spot reversion-to-the-mean opportunities with improved timing capabilities.
Indicator:  TASC FEB 2022 Elegant Oscillator
{
	TASC FEB 2022
	The Elegant Oscillator
	(c) 2021 John F. Ehlers
}

inputs:
	BandEdge(20);

variables:
	Deriv(0), RMS(0), count(0), NDeriv(0), IFish(0),
	a1(0), b1(0), c1(0), c2(0), c3(0), SS(0);

//Take the derivative of prices
Deriv = Close - Close[2];
//Normalize to standard deviation
RMS = 0;

for count = 0 to 49
begin
	RMS = RMS + Deriv[count]*Deriv[count];
end;

if RMS <> 0 then
	RMS = SquareRoot(RMS / 50);

NDeriv = Deriv / RMS;

//Compute the Inverse Fisher Transform
IFish = (ExpValue(2*NDeriv) - 1) / (ExpValue(2*NDeriv) + 1);

//Integrate with SuperSmoother
a1 = expvalue(-1.414*3.14159 / BandEdge);
b1 = 2*a1*Cosine(1.414*180 / BandEdge);
c2 = b1;
c3 = -a1*a1;
c1 = 1 - c2 - c3;
SS = c1*(IFish + IFish[1]) / 2 + c2*SS[1] + c3*SS[2];
if Currentbar < 3
	then SS = 0;

//Plot the indicator
Plot1(SS,"SS", red);
Plot2(0,"ref", black)


Indicator:  TASC FEB 2022 Elegant Oscillator

{
	TASC FEB 2022
	Soft And Hard Limiter Comparison
	2021 John F. Ehlers
}

variables:
	Deriv(0),
	RMS(0),
	count(0),
	NDeriv(0),
	IFish(0),
	Integ(0),
	Clip(0),
	IntegClip(0);
	Deriv = Close - Close[2];
	RMS = 0;

for count = 0 to 49
begin
	RMS = RMS + Deriv[count]*Deriv[count];
end;

if RMS <> 0
	then RMS = SquareRoot(RMS / 50);

NDeriv = Deriv / RMS;
IFish = (ExpValue(2*NDeriv) - 1) / (ExpValue(2*NDeriv) + 1);
Integ = (IFish + 2*IFish[1] + 3*IFish[2] + 3*IFish[3]
 + 2*IFish[4] + IFish[5]) / 12;
Clip = Deriv;

if Clip > 1
	then Clip = 1;
if Clip < -1
	then Clip = -1;

IntegClip = (Clip + 2*Clip[1] + 3*Clip[2] + 3*Clip[3]
 + 2*Clip[4] + Clip[5]) / 12;

Plot1(Integ,"IFish", red);
Plot2(0,"ref", black, 1, 1);
Plot3(IntegClip,"Clip", blue);
A sample chart is shown in Figure 1.

FIGURE 1: TRADESTATION. This example TradeStation daily chart shows the S&P 500 index with the indicators applied.
This article is for informational purposes. No type of trading or investment recommendation, advice, or strategy is being made, given, or in any manner provided by TradeStation Securities or its affiliates.
—John Robinson
TradeStation Securities, Inc.
www.TradeStation.com
BACK TO LIST

thinkorswim: February 2022
We have put together a pair of studies based on the article by John Ehlers in this issue titled “An Elegant Oscillator: Inverse Fisher Transform Redux.” We built these studies using our proprietary scripting language, thinkscript. To ease the loading process, simply open the link https://tos.mx/fSP0RBi or enter the address into Setup→Open shared item from within thinkorswim. Choose view thinkscript study and name it ElegantOscillator or something you can easily remember. Do the same for https://tos.mx/JYxrECm and name it SoftAndHardLimiterComparison.
The two studies can be seen on the one-year daily aggregation chart of SPY in Figure 2. Please see John Ehlers’ article on how to interpret these studies.

FIGURE 2: THINKORSWIM. The ElegantOscillator study and SoftAndHardLimiterComparisons study can be seen on a one-year daily aggregation chart of SPY. Please see John Ehlers’ article on how to interpret these studies.
—thinkorswim
A division of TD Ameritrade, Inc.
www.thinkorswim.com
BACK TO LIST

MetaStock: February 2022
John Ehlers’ article in this issue, “Inverse Fisher Transform Redux,” introduces his elegant oscillator indicator. Here is the formula to add that indicator to MetaStock.
pds:= 20;  {BandEdge}
deriv:= C-Ref(C, -2);
RMS:= Sum(deriv * deriv, 50);
rms2:= Sqrt(rms/50);
denom:= If(rms2=0, -1, rms2);
nderiv:= If(denom= -1, 1, deriv/denom);
ifish:= (Exp(2*nderiv)-1) / (Exp(2*nderiv)+1);
a1:= Exp(-1.414*3.14159 / pds);
b1:= 2*a1*Cos(1.414*180 / pds);
c3:= -a1*a1;
c1:= 1 - b1 - c3;
ss:= c1 * (ifish + Ref(ifish, -1))/2 +
b1*PREV + c3*Ref(PREV, -1);
ss
—William Golson
MetaStock Technical Support
www.MetaStock.com
BACK TO LIST

TradingView: February 2022
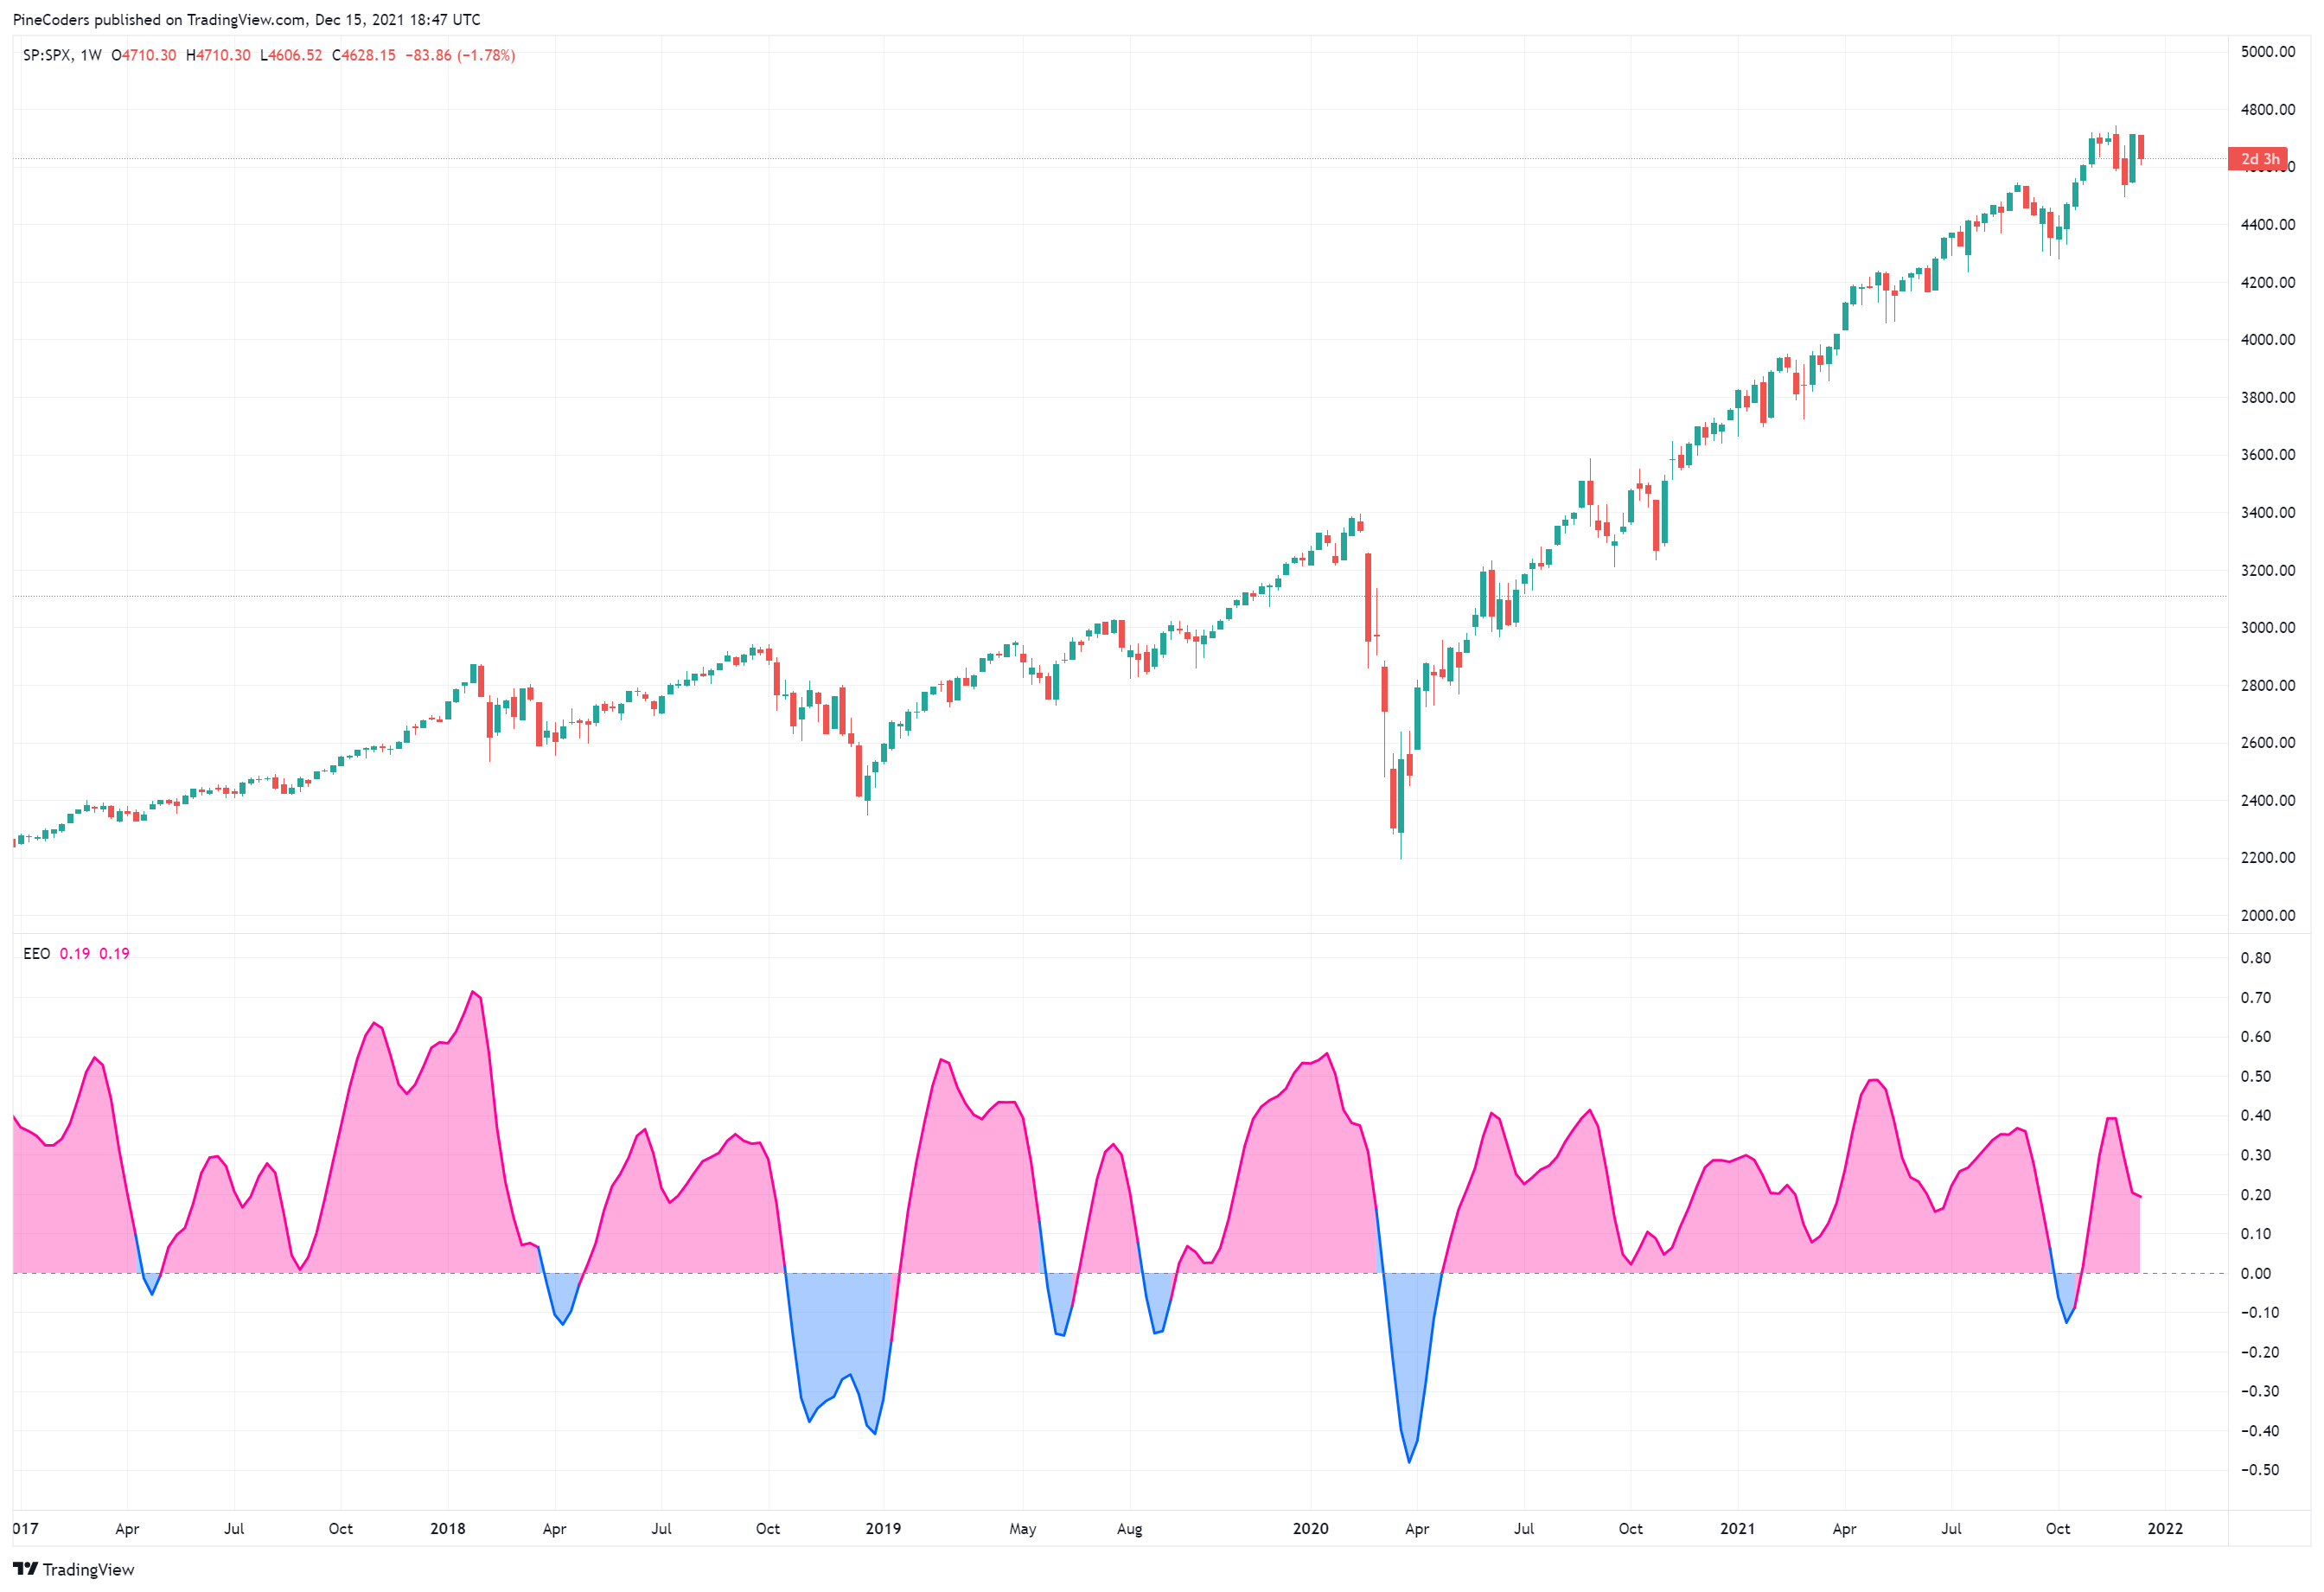
Here is the TradingView Pine Script code implementing the elegant oscillator described in this issue’s article by John Ehlers, “An Elegant Oscillator: Inverse Fisher Transform Redux.”
The calculation’s steps are:
- Compute the two-bar difference of closing prices.
- Calculate the root mean square (RMS) of the differences and scale it.
- Apply the inverse Fisher transform to the scaled values.
- Smooth the result using the SuperSmoother filter.
The result is a promising indicator that can be used for mean-reversion trading.
//  TASC Issue: February 2022 - Vol. 40, Issue 2
//     Article: Inverse Fisher Transform Redux -
//                   An Elegant Oscillator
//  Article By: John F. Ehlers
//    Language: TradingView's Pine Script v5
// Provided By: PineCoders, for tradingview.com

//@version=5
indicator("TASC 2022.02 Ehlers' Elegant Oscillator", "EEO")

sourceInput = input.source(close, "Source:")
bandEdgeInput = input.float(20.0, "Post Smooth:", minval = 2)
lengthRMSInput = input.int(50, "Length RMS:", minval = 2)

eeo(float src, float band_edge, int lengthRMS = 50) =>
    var float ANG_FREQ = math.pi * math.sqrt(2) / band_edge
    float deriv  = src - nz(src[2], nz(src[1], src))
    float rms    = math.sum(math.pow(deriv, 2), lengthRMS)
    rms         := math.sqrt(nz(rms / lengthRMS))
    float ift    = math.exp(2.0 * deriv / rms)
    ift         := (ift - 1.0) / (ift + 1.0)
    float alpha  =  math.exp(-ANG_FREQ)
    float coef2  = -math.pow(alpha, 2)
    float coef1  =  math.cos(ANG_FREQ) * 2.0 * alpha
    float coef0  = 1.0 - coef1 - coef2
    float sma2   = 0.5 * (ift + nz(ift[1], ift))
    float result = na
    result := nz(coef0 *     sma2      +
                 coef1 * nz(result[1]) +
                 coef2 * nz(result[2]))

signal    = eeo(sourceInput, bandEdgeInput, lengthRMSInput)
plotColor = signal > 0.0 ? #FF0099   : #0066FF
areaColor = signal > 0.0 ? #FF009955 : #0066FF55

plot(signal, "Area", areaColor, 1, plot.style_area)
plot(signal,   "EO", plotColor, 2)
hline(  0.0, "Zero", color.gray)
The indicator is available on TradingView from the PineCodersTASC account:
https://tradingview.com/u/PineCodersTASC/#published-scripts

FIGURE 3: TRADINGVIEW. The elegant oscillator, which uses the inverse Fisher transform, can be used for mean-reversion trading.
—Pinecoders, for TradingView
https://tradingview.com
BACK TO LIST

WealthLab.com: February 2022
The elegant oscillator (EO) is included with a recent build of Wealth-Lab 7. Because no thresholds for buy and sell decisions are provided in the article by the author, we resort to a favorite approach, which originates from a February 2006 article in this magazine by David Sepiashvili, “Self-adjusting RSI.” Dynamic thresholds expand and contract with the instrument’s volatility, rising in uptrends and declining in downtrends.
The elegant oscillator’s thresholds can then be determined by applying long-term bands like 100-day Bollinger Bands with 1.5 standard deviations onto it. What’s great, the approach is universally suitable to many oscillators out there.
Since Ehlers highlights the elegant oscillator’s application to swing trading, let’s prototype a swing trading system with the following logic:
- Buy when the EO crosses above its dynamic lower Bollinger Band
- Sell when the EO crosses above its dynamic upper Bollinger Band
- Sell at -5% stop-loss
The idea for entry is to buy on a dip when it reverses, sell into strength, get out early and not take big losses. Figure 4 shows the swing trading system in action. In 2021, the dynamically determined thresholds for SPY oscillate around 0.45 (upper band) and -0.2 (lower band).
using WealthLab.Backtest;
using System;
using WealthLab.Core;
using WealthLab.Indicators;
using WealthLab.TASC;
using System.Drawing;
using System.Collections.Generic;

namespace WealthScript1
{
	public class TASCFeb2022 : UserStrategyBase
	{
		/* create indicators and other objects here, this is executed prior to the main trading loop */
		public override void Initialize(BarHistory bars)
		{
			eo = ElegantOscillator.Series(bars.Close, 20);
			bbLower = BBLower.Series(eo, 100, 1.5);
			bbUpper = BBUpper.Series(eo, 100, 1.5);
			StartIndex = 100;

			PlotIndicatorLine(eo);
			PlotIndicatorLine(bbLower);
			PlotIndicatorLine(bbUpper);
		}

		/* execute the strategy rules here, this is executed once for each bar in the backtest history */
		public override void Execute(BarHistory bars, int idx)
		{
			if (!HasOpenPosition(bars, PositionType.Long))
			{
				/* code your buy conditions here */
				if(eo.CrossesOver(bbLower, idx))
					PlaceTrade(bars, TransactionType.Buy, OrderType.Market);
			}
			else
			{
				/* code your sell conditions here */
				if(eo.CrossesOver(bbUpper, idx))
					PlaceTrade(bars, TransactionType.Sell, OrderType.Market);
				else
					if(LastPosition.ProfitPctAsOf(idx) < -5)
					PlaceTrade(bars, TransactionType.Sell, OrderType.Market, default, "Stop");
			}
		}

		/* declare private variables below */
		ElegantOscillator eo;
		BBLower bbLower;
		BBUpper bbUpper;
	}
}

FIGURE 4: WEALTH-LAB. This shows sample trades taken by the system applied to a daily chart of SPY.
—Gene Geren (Eugene)
Wealth-Lab team
www.wealth-lab.com
BACK TO LIST

NinjaTrader: February 2022
The EllegantOscillator and HardAndSoftLimiter indicators as presented in John Ehlers’ article in this issue, “An Elegant Oscillator: Inverse Fisher Transform Redux,” is available for download at the following links for NinjaTrader 8 and for NinjaTrader 7:
Once the file is downloaded, you can import the indicator into NinjaTader 8 from within the control center by selecting Tools → Import → NinjaScript Add-On and then selecting the downloaded file for NinjaTrader 8. To import in NinjaTrader 7 from within the control center window, select the menu File → Utilities → Import NinjaScript and select the downloaded file.
You can review the indicator source code in NinjaTrader 8 by selecting the menu New → NinjaScript Editor → Indicators folder from within the control center window and selecting the EllegantOscillator and HardAndSoftLimiter files. You can review the indicator’s source code in NinjaTrader 7 by selecting the menu Tools → Edit NinjaScript → Strategy from within the control center window and selecting the EllegantOscillator and HardAndSoftLimiter files.
NinjaScript uses compiled DLLs that run native, not interpreted, to provide you with the highest performance possible.
A sample chart displaying the indicator is shown in Figure 5.

FIGURE 5: NINJATRADER. The EllegantOscillator and HardAndSoftLimiter are displayed on a daily SPY chart from May 2020 to May 2021.
—Chris Lauber
NinjaTrader, LLC
www.ninjatrader.com
BACK TO LIST

Neuroshell Trader: February 2022
John Ehlers’ elegant oscillator indicator, introduced in his article in this issue, “An Elegant Oscillator: Inverse Fisher Transform Redux,” can be easily implemented in NeuroShell Trader using NeuroShell Trader’s ability to call external dynamic linked libraries. Dynamic linked libraries can be written in C, C++, and Power Basic.
After moving the code given in the article to your preferred compiler and creating a DLL, you can insert the resulting indicator as follows:
- Select new indicator from the insert menu
- Choose the external program & library calls category.
- Select the appropriate external DLL call indicator.
- Set up the parameters to match your DLL.
- Select the finished button.

FIGURE 6: NEUROSHELL TRADER. This NeuroShell Trader chart shows the Elegant Oscillator applied to SPY.
NeuroShell Trader users can go to the Stocks & Commodities section of the NeuroShell Trader free technical support website to download a copy of this or any previous Traders’ Tips.
—Ward Systems Group, Inc.
sales@wardsystems.com
www.neuroshell.com
BACK TO LIST

The Zorro Project: February 2022
The Fisher transform, which converts data to or from a Gaussian distribution, was first used in algorithmic trading in a book by John Ehlers, and it has become a common component of indicators since then.
In his article in this issue, “An Elegant Oscillator: Inverse Fisher Transform Redux,” Ehlers describes a new indicator, the Elegant Oscillator, based on the inverse Fisher transform. He uses the transform for converting the normalized derivative of a price series to the +/-1 range, as opposed to simply clipping the data. The result is smoothed by his SuperSmoother, a low-pass filter. The code in C for Zorro is as follows:
var EO(vars Data,int Length)
{
  vars Derivs = series(priceClose(0)-priceClose(2));
  var RMS = sqrt(SumSq(Derivs,Length)/Length);
  var NDeriv = Derivs[0]/RMS;
  vars IFishs = series(FisherInv(&NDeriv));
  return Smooth(IFishs,20);
}
SumSq() is a helper function for summing up the squares of a data series, and Smooth() is Ehlers’ SuperSmoother that was already in the Zorro library. For comparison, here’s the code for hard clipping the data:
var HardClip(vars Data,int Length)
{
  vars Derivs = series(priceClose(0)-priceClose(2));
  var RMS = sqrt(SumSq(Derivs,Length)/Length);
  vars Clips = series(clamp(Derivs[0],-1,1));
  return FIR6(Clips);
}
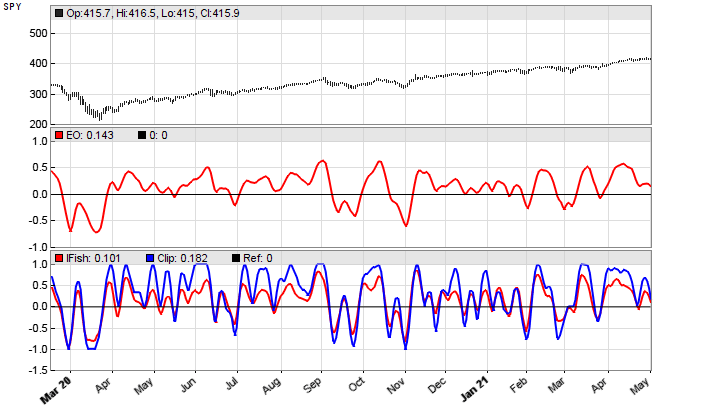
The clipped data is this time smoothed with a finite response filter (FIR6). In Figure 7, an SPY chart is shown with the elegant oscillator (upper red line), the inverse Fisher transform smoothed with a finite response filter (lower red line), and the hard-clipped variant (blue line).

FIGURE 7: ZORRO PROJECT. An SPY chart is shown with the elegant oscillator (upper red line), the inverse Fisher transform smoothed with a finite response filter (lower red line), and the hard-clipped variant (blue line).
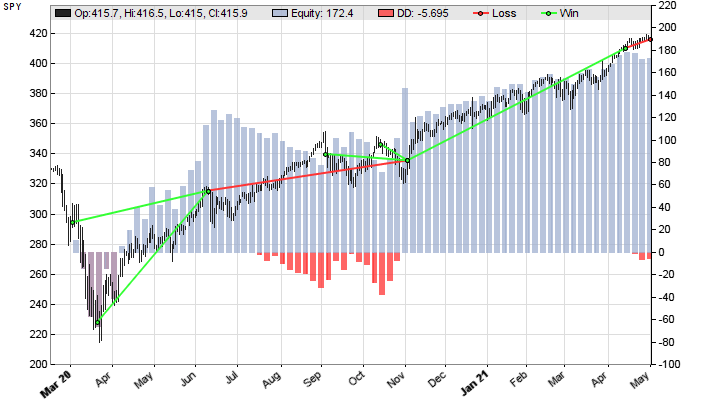
The supersmoothed elegant oscillator makes the best impression. According to Ehlers, its peaks and valleys that exceed a threshold can be used for mean-reversion trading. Let’s put that to the test. The code is as follows and the resulting chart is shown in Figure 8.

FIGURE 8: ZORRO PROJECT. Peaks and valleys of the supersmoothed elegant oscillator that exceed a threshold can be used for mean-reversion trading. This shows an example strategy using the elegant oscillator.
void run()
{
  StartDate = 20200301;
  EndDate = 20210501;
  BarPeriod = 1440;

  assetAdd("SPY","STOOQ:*");
  asset("SPY");

  vars Signals = series(EO(seriesC(),50));
  var Threshold = 0.5;

  if(Signals[0] > Threshold && peak(Signals))
    enterShort();
  else if(Signals[0] < -Threshold && valley(Signals))
    enterLong();
}
Indeed, 5 of 7 trades in that time period were winning, producing an overall positive result with a profit factor close to 7. Of course, more tests with different instruments and different time periods are needed for determining the real value of the EO oscillator for mean-reversion trading.
The oscillator and example trading strategy can be downloaded from the 2021 script repository on https://financial-hacker.com. The Zorro platform can be downloaded from https://zorro-project.com.
—Petra Volkova
The Zorro Project by oP group Germany
htpps://zorro-project.com
BACK TO LIST
Microsoft Excel: February 2022
In his article in this issue, “An Elegant Oscillator: Inverse Fisher Transform Redux,” John Ehlers demonstrates two oscillators both are built by scaling price data, applying the inverse Fisher transform, and then smoothing them by using his SuperSmoother on one (Elegant), and an FIR filter on the other (IntegFish).
Then he compares these to an oscillator built by first clipping the price and smoothing this result with the same FIR filter (IntegClip).
The smoother peaks and valleys of the elegant oscillator (Figure 9) correspond closely with the localized peaks and valleys of the price data.

FIGURE 9: EXCEL: ELEGANT OSCILLATOR.
The two not so smooth also rans are show stronger swings with a few more peaks and valleys as seen in Figure 10.

FIGURE 10: EXCEL Hard Limiter (Clipping) Compared with Soft Limiter (Inverse Fisher).
To download this spreadsheet: The spreadsheet file for this Traders’ Tip can be downloaded from traders.com in the Traders’ Tips area. To successfully download it, follow these steps:
- Right-click on the Excel file link, then
- Select “save as” (or “save target as”) to place a copy of the spreadsheet file on your hard drive.
—Ron McAllister
Excel and VBA programmer
rpmac_xltt@sprynet.com
BACK TO LIST

TradersStudio: February 2022
The importable TradersStudio file for John Ehlers’ article, “Inverse Fisher Transform Redux (an Elegant Oscillator)”, can be obtained on request via email to info@TradersEdgeSystems.com. The code is also available below.
Code for the author’s indicator is provided in following files:
- Function EHLERS_ELEGANT_OSC: computes Elegant Oscillator indicator
- Indicator plot EHLERS_ELEGANT_OSC_IND: plots the Elegant Oscillator indicator on a chart
'The Elegant Oscillator
'Author: John F. Ehlers, TASC Feb 2022
'Coded by: Richard Denning, 12/20/2021

'Take the derivative of prices
Function EHLERS_ELEGANT_OSC(BandEdge)

    Dim Deriv As BarArray
    Dim RMS As BarArray
    Dim count
    Dim NDeriv As BarArray
    Dim IFish As BarArray
    Dim a1 As BarArray
    Dim b1 As BarArray
    Dim c1 As BarArray
    Dim c2 As BarArray
    Dim c3 As BarArray
    Dim SS As BarArray

    If BarNumber=FirstBar Then
        'BandEdge = 20
        Deriv = 0
        RMS = 0
        count = 0
        NDeriv = 0
        IFish = 0
        a1 = 0
        b1 = 0
        c1 = 0
        c2 = 0
        c3 = 0
        SS = 0
    End If

    Deriv = Close - Close[2]
'Normalize to standard deviation
    RMS = 0
    For count = 0 To 49
        RMS = RMS + Deriv[count]*Deriv[count]
    Next
    If RMS <> 0 Then
        RMS = Sqr(RMS / 50)
    End If
    NDeriv = Deriv / RMS
'Compute the Inverse Fisher Transform
    IFish = (TStation_ExpValue(2*NDeriv) - 1) / (TStation_ExpValue(2*NDeriv) + 1)
'Integrate with SuperSmoother
    a1 = TStation_ExpValue(-1.414*3.14159 / BandEdge)
    b1 = 2*a1*TStation_Cosine(1.414*180 / BandEdge)
    c2 = b1
    c3 = -a1*a1
    c1 = 1 - c2 - c3
    SS = c1*(IFish + IFish[1]) / 2 + c2*SS[1] + c3*SS[2]
EHLERS_ELEGANT_OSC = SS
End Function
'-------------------------------------------------------------
'INDICATOR PLOT
Sub EHLERS_ELEGANT_OSC_IND(BandEdge)
Dim SS As BarArray
SS = EHLERS_ELEGANT_OSC(BandEdge)
plot1(SS)
plot2(0)
End Sub
Figure 11 shows the indicator on a chart of Cisco Systems (CSCO) during 2011.

FIGURE 11: TRADERSSTUDIO. This shows an example of John Ehlers' elegant oscillator on a chart of Cisco Systems (CSCO) during 2011.
—Richard Denning
info@TradersEdgeSystems.com
for TradersStudio
BACK TO LIST
Originally published in the February 2022 issue of
Technical Analysis of STOCKS & COMMODITIES magazine.
All rights reserved. © Copyright 2022, Technical Analysis, Inc.


