TRADERS’ TIPS
March 2022

For this month’s Traders’ Tips, the focus is Vitali Apirine’s article in this issue, “Relative Strength Moving Averages, Part 3.” Here, we present the March 2022 Traders’ Tips code with possible implementations in various software.
You can right-click on any chart to open it in a new tab or window and view it at it’s originally supplied size, often much larger than the version printed in the magazine.
The Traders’ Tips section is provided to help the reader implement a selected technique from an article in this issue or another recent issue. The entries here are contributed by software developers or programmers for software that is capable of customization.

TradeStation: March 2022
The current article series “Relative Strength Moving Averages” by Vitali Apirine focuses on differences between traditional exponential moving averages (EMAs) and relative strength-based EMA indicators. In this issue's article, Apirine describes the relative strength volatility-adjusted exponential moving average (RS VolatAdj EMA).
The indicator is designed to account for relative strength of volatility, and it requires a second, corresponding volatility index. For example, if charting the S&P 500 ETF (SPY), one can use the CBOE Volatility Index ($VIX.X). The indicator compared to itself of varying lengths, or the indicator compared to a traditional EMA with the same length, can be used to help to identify trends and turning points. During an uptrend, RS VolatAdj EMA crossovers can be used to help identify entry points for long trades.
Indicator: TASC MAR 2022 RS VolatAdj EMA
// TASC MAR 2022
// Relative StrengthMoving Averages
// Part 3: The Relative Strength Volatility-Adjusted
// Exponential Moving Average (RS VolatAdj EMA)
//
// Vitali Apirine 2022

inputs:
	int Periods( 10 ),
	int Pds( 10 ),
	int Mltp( 10 );

variables:
	Mltp1( 0 ),
	VolatC( 0, Data2 ),
	VolatUpDay( 0 ),
	VolatDwnDay( 0 ),
	Rate( 0 ),
	RS( 0 ),
	PlotValue( 0 );

Mltp1 = 2 / (Periods + 1);
VolatC = Close of Data2;
VolatUpDay = IFF(Close > Close[1], VolatC, 0);
VolatDwnDay = IFF(C < Close[1], VolatC, 0);
RS = AbsValue(XAverage(VolatUpDay, Pds) -
 XAverage(VolatDwnDay, Pds)) / (XAverage(VolatUpDay, Pds) +
 XAverage(VolatDwnDay, Pds) + 0.00001);
RS = RS * Mltp;
Rate = Mltp1 * (1 + RS);

If CurrentBar = Periods + 1 then
	PlotValue = Close
else
	PlotValue = PlotValue[1] + Rate * (Close - PlotValue[1]);

if CurrentBar >= Periods + 1 then
	Plot1( PlotValue, "RS VolatAdj" );
A sample chart is shown in Figure 1.

FIGURE 1: TRADESTATION. Shown is a TradeStation daily chart of the S&P 500 ETF (SPY) and the CBOE Volatility Index ($VIX.X) with the indicator applied. Indicator inputs have been set to 50, 50 and 10. A traditional 50-period EMA is also plotted (shown in red).
This article is for informational purposes. No type of trading or investment recommendation, advice, or strategy is being made, given, or in any manner provided by TradeStation Securities or its affiliates.
—John Robinson
TradeStation Securities, Inc.
www.TradeStation.com
BACK TO LIST

eSIGNAL: March 2022
For this month’s Traders’ Tip, we’ve provided the study RS VolatAdj.efs based on the article by Vitali Apirine in this issue, “Relative Strength Moving Averages, Part 3: The Relative Strength Volatility-Adjusted Exponential Moving Average (RS VolatAdj EMA).” This study displays the relative strength of volatility as an exponential moving average.
The study contains formula parameters that may be configured through the edit chart window (right-click on the chart and select “edit chart”). A sample chart is shown in Figure 2.

FIGURE 2: eSIGNAL. Here is an example of the study plotted on a daily chart of $SPX. This study displays the relative strength of volatility as an exponential moving average.
To discuss this study or download a complete copy of the formula code, please visit the EFS library discussion board forum under the forums link from the support menu at www.esignal.com or visit our EFS KnowledgeBase at www.esignal.com/support/kb/efs. The eSignal formula script (EFS) is also available for copying & pasting here:
/**********************************
Provided By:
Copyright 2019 Intercontinental Exchange, Inc. All Rights Reserved.
eSignal is a service mark and/or a registered service mark of Intercontinental Exchange, Inc.
in the United States and/or other countries. This sample eSignal Formula Script (EFS)
is for educational purposes only.
Intercontinental Exchange, Inc. reserves the right to modify and overwrite this EFS file with each new release.

Description:
    Relative Strength Moving Averages
    by Vitali Apirine


Version:            1.00  12/01/2022

Formula Parameters:                     Default:
Periods                                 10
VolInd                                  $VIX

Notes:
The related article is copyrighted material. If you are not a subscriber
of Stocks & Commodities, please visit www.traders.com.

**********************************/
var fpArray = new Array();
var bInit = false;

function preMain() {
    setStudyTitle("RS VolatAdj EMA");
    setCursorLabelName("RS VolatAdj EMA", 0);
    setPriceStudy(true);
    setDefaultBarFgColor(Color.RGB(0x00,0x94,0xFF), 0);
    setPlotType( PLOTTYPE_LINE , 0 );
    setDefaultBarThickness(2, 0);
    setIntervalsBackfill(true);

    var x=0;
    fpArray[x] = new FunctionParameter("Periods", FunctionParameter.NUMBER);
	with(fpArray[x++]){
        setLowerLimit(1);
        setDefault(10);
    }
    fpArray[x] = new FunctionParameter("VolInd", FunctionParameter.STRING);
	with(fpArray[x++]){
        setDefault('$VIX');
        setName("Corresponding Volatility Index")

    }
}

var bVersion = null;
var xClose = null;
var RS = null;
var RS_1  = null;


function main(Periods, VolInd) {
    if (bVersion == null) bVersion = verify();
    if (bVersion == false) return;

    if ( bInit == false ) {
        xClose = close();
        xCloseVIX = close(VolInd);
        Pds = 10;
        Mltp = 10;
        Mltp1 = 2 / (Periods+1);

        VolatUpDay = efsInternal('Calc_UD', xClose, xCloseVIX);
        VolatDwnDay = efsInternal('Calc_DD', xClose, xCloseVIX);
        xRS = efsInternal('Calc_RS', VolatUpDay, VolatDwnDay, Pds, Mltp);

        RS = 0;
        RS_1 = 0;


        bInit = true;
    }
    if (getCurrentBarCount() <= Periods) return;
    if (getBarState() == BARSTATE_NEWBAR) {
        RS_1 = RS;
        RS = 0;
    }

    Rate = Mltp1 * (1+xRS.getValue(0));
    if (getCurrentBarCount() == Periods + 1) ret = xClose.getValue(0);
    else ret = RS_1 + Rate * (xClose.getValue(0) - RS_1);
    RS = ret;

    return RS;
}

function Calc_RS(VolatUpDay, VolatDwnDay, Pds, Mltp){
    ret = Math.abs(ema(Pds, VolatUpDay) - ema(Pds, VolatDwnDay)) / (ema(Pds, VolatUpDay) + ema(Pds, VolatDwnDay) + 0.00001);
    ret = ret * Mltp;

    return ret;
}
var ret = 0;
function Calc_DD(xClose, xCloseVIX){
    var ret = 0;
    if (xClose.getValue(1) < xClose.getValue(0)){
        ret = xCloseVIX.getValue(0);
    }
    else ret = 0;

    return ret;
}
var ret = 0;
function Calc_UD(xClose, xCloseVIX){
    var ret = 0;
    if (xClose.getValue(1) > xClose.getValue(0)){
        ret = xCloseVIX.getValue(0);
    }
    else ret = 0;

    return ret;
}

function verify(){
    var b = false;
    if (getBuildNumber() < 779){

        drawTextAbsolute(5, 35, "This study requires version 10.6 or later.",
            Color.white, Color.blue, Text.RELATIVETOBOTTOM|Text.RELATIVETOLEFT|Text.BOLD|Text.LEFT,
            null, 13, "error");
        drawTextAbsolute(5, 20, "Click HERE to upgrade.@URL=https://www.esignal.com/download/default.asp",
            Color.white, Color.blue, Text.RELATIVETOBOTTOM|Text.RELATIVETOLEFT|Text.BOLD|Text.LEFT,
            null, 13, "upgrade");
        return b;
    }
    else
        b = true;

    return b;
}
—Eric Lippert
eSignal, an Intercontinental Exchange, Inc. company
770-999-4511, www.eSignal.com
BACK TO LIST

Wealth-lab.com: March 2022
The relative strength volatility-adjusted exponential moving average (RSVolatAdjEMA), an indicator introduced in Vitali Apirine’s article in this issue, “Relative Strength Moving Averages, Part 3: The Relative Strength Volatility-Adjusted Exponential Moving Average (RS VolatAdj EMA),” has been added to Wealth-Lab 7. It opens up for including it in your research without any programming. For example, the indicator could be used as a basis for building and training a backpropagation neural network or tested in the Indicator Profiler extension to see how much of an edge it provides compared to other indicators.
And of course it’s a snap to build a trading system from within Building Blocks. Figure 3 illustrates one such system derived from an idea mentioned in the article. The blocks use the RSVolatAdjEMA crossovers as entry points for trades during a long-term uptrend. We entered the symbol ^VIX to get the VIX data from Yahoo! Finance but you can take any other supported data source.
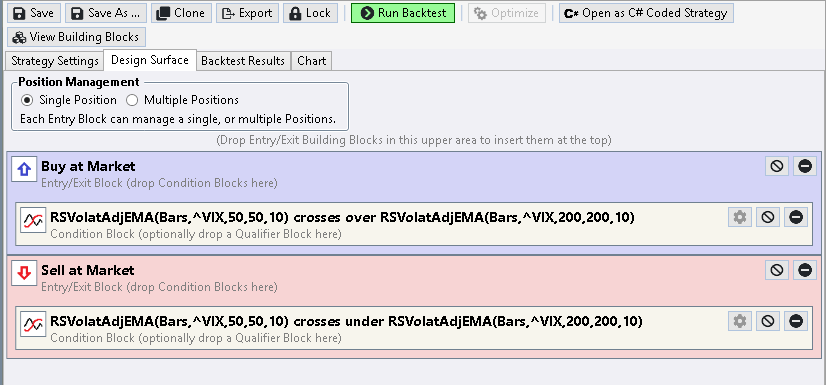
FIGURE 3: WEALTH-LAB. This example trading system using crossovers of the relative strength volatility-adjusted exponential moving average (RSVolatAdjEMA) was created in under a minute by using Wealth-Lab’s Building Blocks feature to set up the strategy.
The rules of the sample system are:
- Buy when RSVolatAdjEMA(50,50,10) crosses above RSVolatAdjEMA(200,200,10)
- Sell when RSVolatAdjEMA(50,50,10) crosses below RSVolatAdjEMA(200,200,10)
Alternatively, the same rules can be applied as a trend direction filter in a custom trading system. (See Figure 4.)
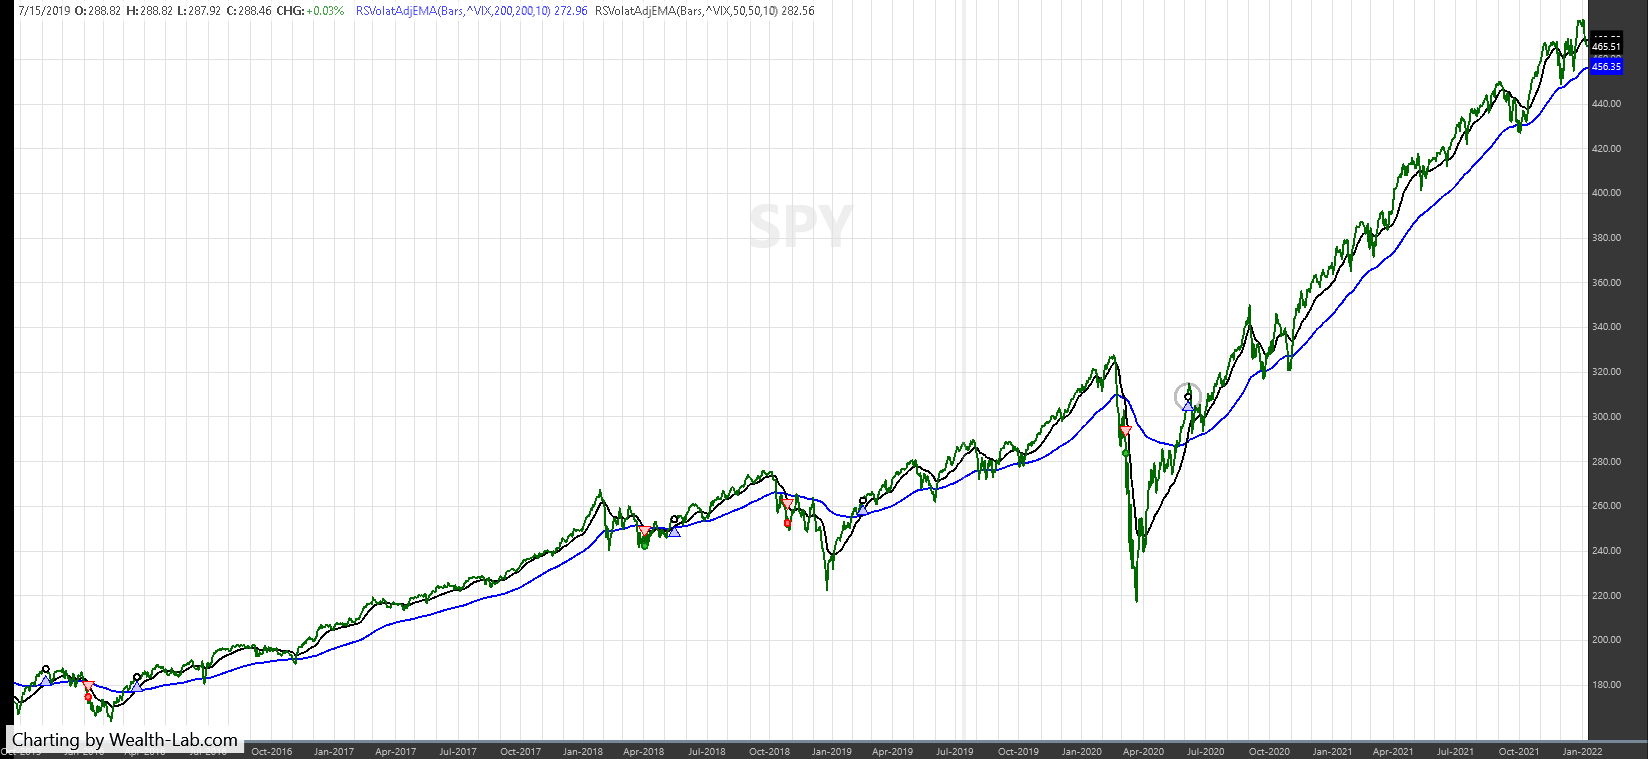
FIGURE 4: WEALTH-LAB. This chart shows sample trades taken by the system applied to a daily chart of SPY.
using WealthLab.Backtest;
using WealthLab.Core;
using WealthLab.Indicators;
using System.Drawing;
using WealthLab.TASC;

namespace WealthScript1
{
    public class S_C_2022_03__RelativeStrengthMovingAveragesPart3 : UserStrategyBase
    {
        public override void Initialize( BarHistory bars)
        {
		rsv1 = new RSVolatAdjEMA(bars,"^VIX",50,50,10);
		rsv2 = new RSVolatAdjEMA(bars,"^VIX",200,200,10);

		PlotIndicator( rsv1,Color.FromArgb(255,0,0,0));
		PlotIndicator( rsv2,Color.FromArgb(255,0,0,255));

		StartIndex = 200;
        }

        public override void Execute( BarHistory bars, int idx)
        {
		if (LastPosition == null)
		{
			if (rsv1.CrossesOver(rsv2, idx))
				PlaceTrade( bars, TransactionType.Buy, OrderType.Market, 0, 0, "Crossover");
		}
		else
		{
			if (rsv1.CrossesUnder(rsv2, idx))
				ClosePosition( LastPosition, OrderType.Market, 0, "Crossunder");
		}
        }

	private IndicatorBase rsv1, rsv2;
    }
}
—Gene Geren (Eugene)
Wealth-Lab team
www.wealth-lab.com
BACK TO LIST

NinjaTrader: March 2022
The RS VolatAdj EMA indicator, which is presented in Vitali Apirine’s article in this issue, “Relative Strength Moving Averages, Part 3: The Relative Strength Volatility-Adjusted Exponential Moving Average (RS VolatAdj EMA),” is available for download at the following links for NinjaTrader 8 and for NinjaTrader 7:
Once the file is downloaded, you can import the indicator into NinjaTader 8 from within the control center by selecting Tools → Import → NinjaScript Add-On and then selecting the downloaded file for NinjaTrader 8. To import into NinjaTrader 7, from within the control center window, select the menu File → Utilities → Import NinjaScript and select the downloaded file.
You can review the indicator source code in NinjaTrader 8 by selecting the menu New → NinjaScript Editor → Indicators folder from within the control center window and selecting the RSVolatAdjEMA file. You can review the indicator’s source code in NinjaTrader 7 by selecting the menu Tools → Edit NinjaScript → Strategy from within the control center window and selecting the RSVolatAdjEMA file.
A sample chart displaying the RSVolatAdjEMA indicator is shown in Figure 5.

FIGURE 5: NINJATRADER. The RSVolatAdjEMA indicator is displayed here on a daily S&P 500 index chart from August 2020 to December 2020.
NinjaScript uses compiled DLLs that run native, not interpreted, to provide you with the highest performance possible.
—Chris Lauber
NinjaTrader, LLC
www.ninjatrader.com
BACK TO LIST

TradingView: March 2022
Here is the TradingView Pine Script code implementing the relative strength volatility-adjusted exponential moving average (RS VolatAdj EMA). This indicator is presented in the article in this issue by Vitali Apirine.
//  TASC Issue: March 2022 - Vol. 40, Issue 3
//     Article: Relative Strength Moving Averages -
//               Part 3: The Relative Strength
//                        Volatility-Adjusted
//                     Exponential Moving Average
//                         (RS VolatAdj EMA)
//  Article By: Vitali Apirine
//    Language: TradingView's Pine Script v5
// Provided By: PineCoders, for tradingview.com

//@version=5
indicator("TASC 2022.03 RS VolatAdj EMA", "RSVAEMA", true)

selVIX = input.symbol("TVC:VIX",              "VIX Selection")
source = input.source(    close,                     "Source")
perEMA = input.int   (       20,                 "EMA Period")
perVS  = input.int   (       20, "Volatility Strength Period")
multVS = input.float (     10.0,                 "Multiplier")

// Relative Strength Volatility-Adjusted EMA Function
rsvae(source, srcVIX, periodEMA, periodVolatS, multVolatS) =>
    var MULT = 2.0 / (math.max(1.0, periodEMA) + 1.0)
    var ALPH = 2.0 / (math.max(1.0, periodVolatS) + 1.0)
    var BETA = 1.0 - ALPH
    volatUp   = source > nz(source[1], source) ? srcVIX : 0.0
    volatDown = source < nz(source[1], source) ? srcVIX : 0.0
    volatUpEMA  = float(na)
    volatUpEMA :=        volatUp  * ALPH +
     nz(volatUpEMA[1],   volatUp) * BETA
    volatDnEMA  = float(na)
    volatDnEMA :=      volatDown  * ALPH +
     nz(volatDnEMA[1], volatDown) * BETA
    VolatS =  nz(math.abs(volatUpEMA - volatDnEMA) /
                         (volatUpEMA + volatDnEMA))
    rsVolatAdjEMA  = source
    lastRSVAE      = nz(rsVolatAdjEMA[1], rsVolatAdjEMA)
    rsVolatAdjEMA := lastRSVAE + (source - lastRSVAE) * MULT *
                   (1.0 +  VolatS * math.max(0.0, multVolatS))
    rsVolatAdjEMA

VIXvalue = request.security(selVIX, timeframe.period, close)

RSvolatAdjEMA = rsvae(source, VIXvalue, perEMA, perVS, multVS)
EMA           = ta.ema(source, perEMA)
fillColor     = RSvolatAdjEMA > EMA ? #FF8C0033 : #2096F233

plotEMA   = plot(EMA)
plotRSVAE = plot(RSvolatAdjEMA, "", #ff8c00, 2)
fill(plotEMA, plotRSVAE, color=fillColor)
The indicator is available on TradingView from the PineCodersTASC account:
https://www.tradingview.com/u/PineCodersTASC/#published-scripts
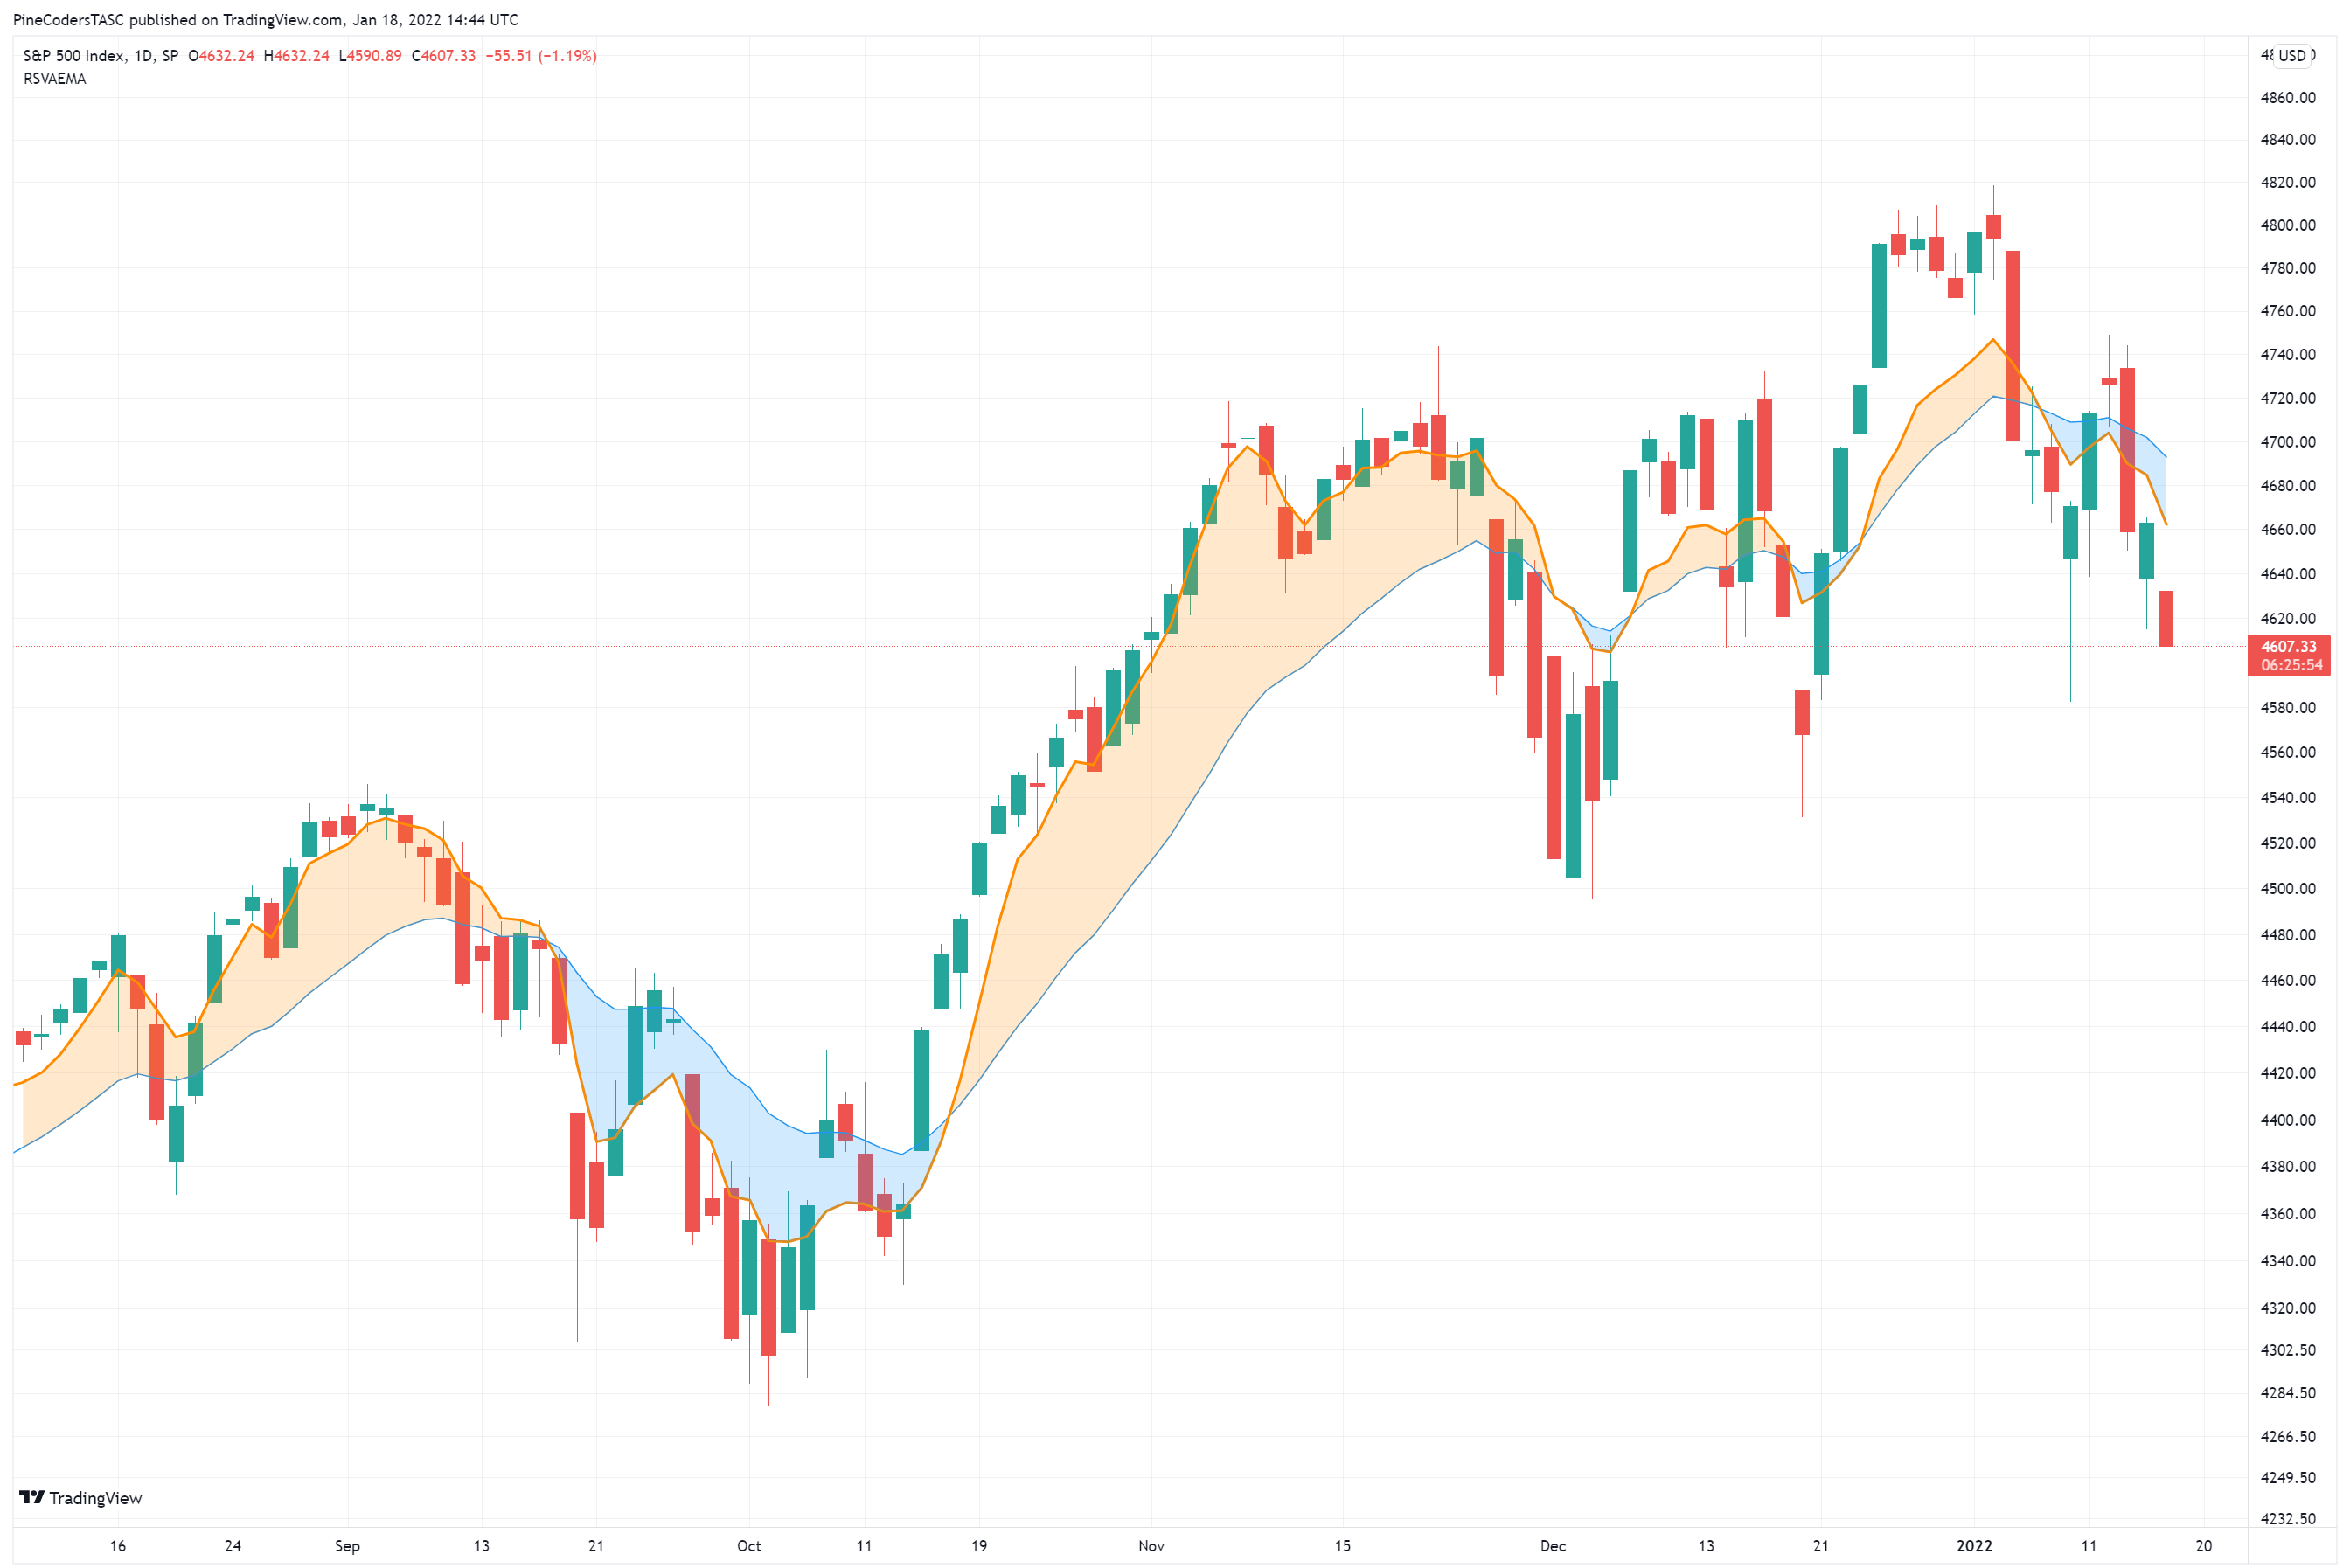
FIGURE 6: TRADINGVIEW. Shown here is the RS VolatAdj EMA on a chart of the S&P 500 index.
—PineCoders, for TradingView
www.TradingView.com
BACK TO LIST

Neuroshell Trader: March 2022
The relative strength volatility-adjusted exponential moving average (RS VolatAdj EMA), which is introduced in Vitali Apirine’s article in this issue, can be easily implemented in NeuroShell Trader by combining some of NeuroShell Trader’s 800+ indicators.
To implement the indicators, select new indicator from the insert menu and use the indicator wizard to create the following indicators:
UVEMA:		ExpAvg( IfThenElse( A>B( Momentum(Close, 1), 0 ), VIX, 0 ), 10)
DVEMA:		ExpAvg( IfThenElse( A<B( Momentum(Close, 1), 0 ), VIX, 0 ), 10)
RS:		Divide( Abs( Subtract(UVEMA , DVEMA ) ), Add2(UVEMA , DVEMA) )
RATE:		Multiply2( Add2(1, Multiply(RS, 10) ), Divide( 2, Add2(10, 1) ) )
RSVolatAdjEMA:	DynamicExpAvg (Close, RATE )

FIGURE 7: NEUROSHELL TRADER. This NeuroShell Trader chart shows the SPX relative strength volatility-adjusted exponential moving average (RS VolatAdj EMA).
NeuroShell Trader users can go to the Stocks & Commodities section of the NeuroShell Trader free technical support website to download a copy of this or any previous Traders’ Tips.
The DynamicExpAvg is a dynamic rate exponential moving average custom indicator that is also available for download at our free technical support website at www.neuroshell.com.
—Ward Systems Group, Inc.
sales@wardsystems.com
www.neuroshell.com
BACK TO LIST

Optuma: March 2022
In his article in this issue, Vitali Apirine presents the relative strength volatility-adjusted exponential moving average (RS VolatAdj EMA). Following is a formula to use in Optuma for EMA(10,10,10):
VolatC = GETDATA(CODE=VIX:CBOEI);
$PDS = 10;
Periods = 10;
Mltp = 10;
Mltp1 = 2/(Periods + 1);
//MA(BARS=$PDS, STYLE=Exponential, CALC=Close)

VolatUpDay = IF(Close() IsUp, VolatC,0);
VolatDwnDay = IF(Close() IsDown, VolatC,0);

RS=ABS(MA(VolatUpDay, BARS=$PDS, STYLE=Exponential) - MA(VolatDwnDay, BARS=$PDS, STYLE=Exponential)) / (MA(VolatUpDay, BARS=$PDS, STYLE=Exponential) + MA(VolatDwnDay, BARS=$PDS, STYLE=Exponential) + 0.0001);
RS1 = RS*Mltp;
Rate = Mltp1*(1+RS1);
CLOSE()[1]+Rate*(CLOSE()-CLOSE()[1])
Figure 8 shows a weekly chart of the S&P 500 showing the crossovers automatically.
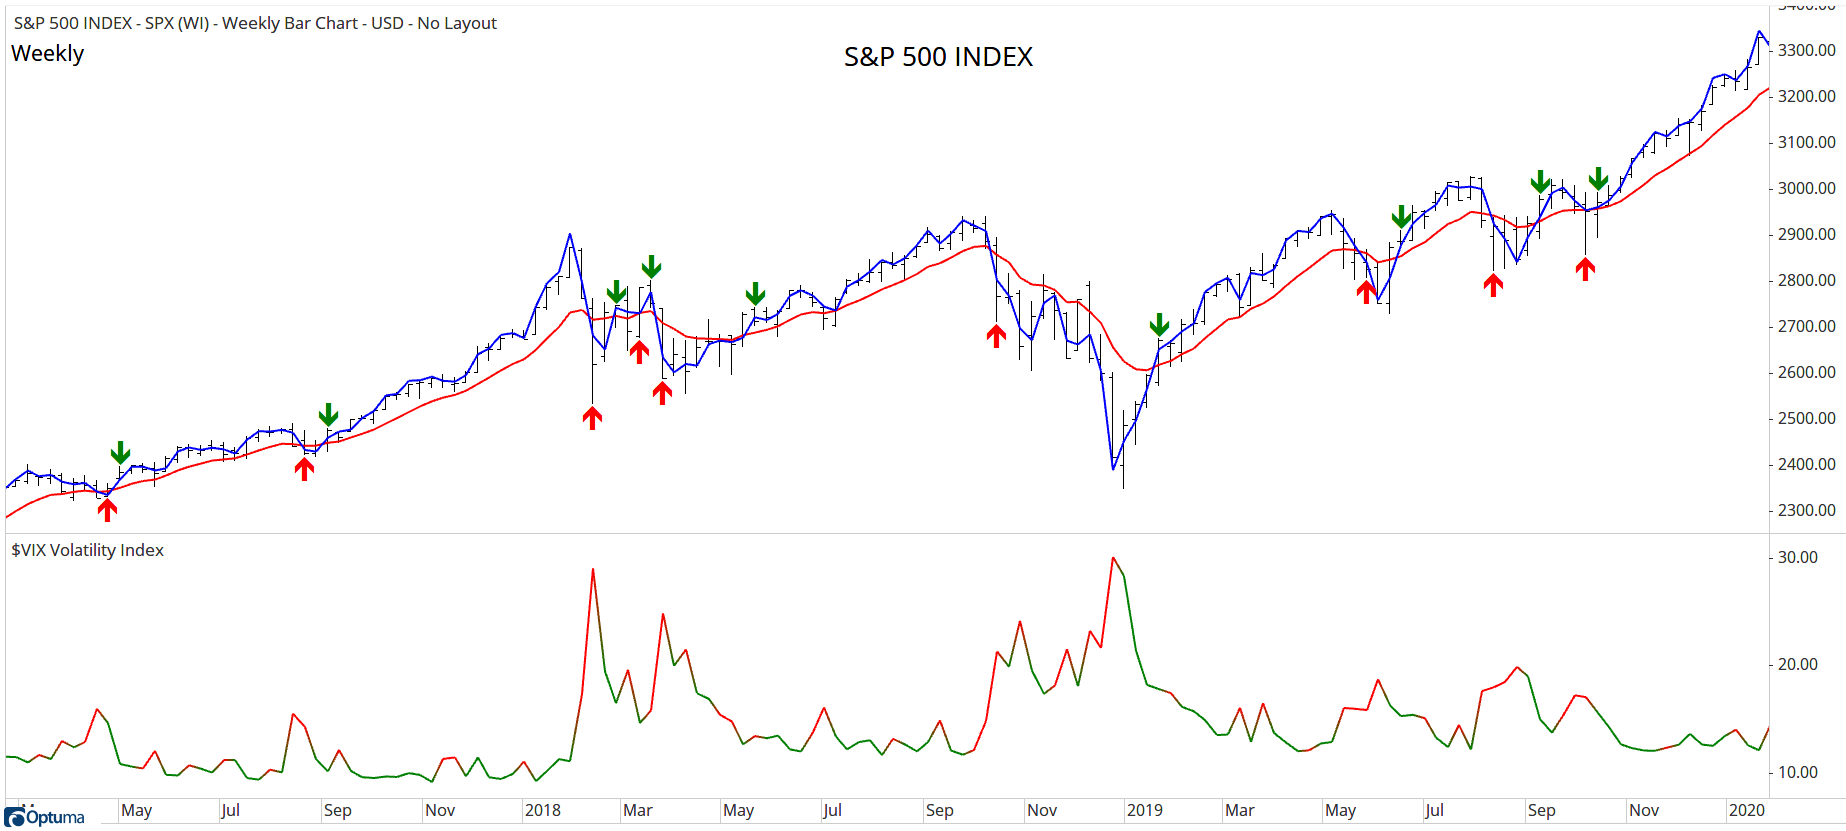
FIGURE 8: OPTUMA. This weekly chart of the S&P 500 shows crossovers of the RS VolatAdj EMA.
—support@optuma.com
BACK TO LIST

TradersStudio: March 2022
The importable TradersStudio file based on Vitali Apirine’s article in this issue, “Relative Strength Moving Averages, Part 3: The Relative Strength Volatility-Adjusted Exponential Moving Average (RS VolatAdj EMA),” can be obtained on request via email to info@TradersEdgeSystems.com. The code is also available below.
Code for the author’s indicators is provided in following files:
- Function RSVEMA: Computes the volatility adjusted relative strength exponential moving average
- Indicator plot RSVEMA_IND: Plots the RSVEMA indicator on a chart
'Relative Strength Moving Average, Volatility Adjusted
'Author: Vitali Apirine, TASC March 2022
'Coded by: Richard Denning, 1/10/2022

'FUNCTION TO COMPUTE INDICATOR VALUES:
Function RSVEMA(Periods, Pds, Mltp)
'Periods = 10, Pds = 10, Mltp = 10
Dim MLTP1
Dim VolatC As BarArray
Dim UV As BarArray
Dim DV As BarArray
Dim RS As BarArray
Dim Rate
Dim RSVe As BarArray
MLTP1 = 2/(Periods + 1)
VolatC = C Of independent1
UV = IIF(C>C[1],VolatC,0)
DV = IIF(C<C[1],VolatC,0)
RS=Abs(XAverage(UV,Pds,0)-XAverage(DV,Pds,0))/(XAverage(UV,Pds,0)+XAverage(DV,Pds,0)+0.00001)
RS=RS*Mltp
Rate=MLTP1*(1+RS)
RSVe = RSVe[1] + Rate*(C-RSVe[1])
RSVEMA = RSVe
End Function
'--------------------------------------------
'INDICATOR PLOT:
Sub RSVEMA_IND(Periods, Pds, Mltp)
Dim RSVe As BarArray
RSVe=RSVEMA(Periods, Pds, Mltp)
plot1(RSVe)
End Sub
'-------------------------------------------
Figure 9 shows the RSVEMA indicators (10- and 50-bar) on a chart of Amgen (AMGN) during part of 2013.

FIGURE 9: Tradersstudio. The RSVEMA indicators (10- and 50-bar) are shown on a chart of Amgen (AMGN) during part of 2013.
—Richard Denning
info@TradersEdgeSystems.com
for TradersStudio
BACK TO LIST

The Zorro Project: March 2022
The exponential moving average (EMA) and the relative strength indicator (RSI) are both very popular indicators. In his article in this issue, “Relative Strength Moving Averages, Part 3: The Relative Strength Volatility-Adjusted Exponential Moving Average (RS VolatAdj EMA),” Vitali Apirine combines them. He measures the relative strength of a volatility index (VIX) and uses the result as an EMA time period.
The algorithm from the article, slightly reformulated for clarity, is as follows:
RSEMA[0] = Alpha * Price + (1-Alpha) * RSEMA[1]
This is a classic EMA, but with a volatility-dependent alpha factor:
Alpha = 2/(TimePeriod+1) * (1 + 10*abs(EMAUp-EMADn)/(EMAUp+EMADn))
EMAUp and EMADn are the VIX EMA of days with positive returns and the VIX EMA of days with negative returns. The separation into positive and negative days resembles the RSI. There is a double EMA in this formula. The factor 10 is inserted to improve the result.
VIX historical data is not available via API from free online sources (as far as I know), but most brokerages offer the data. Thus, Zorro users can most likely download the data from their brokerage using the Zorro download script.
Following is C code as converted from the MetaStock code given in Apirine’s article in this issue:
var RSEMA(int Periods, int PdsEMA, var Mltp)
{
  asset("VIX");
  var VolatC = priceC();
  asset(AssetPrev);
  vars VolatUpDays = series(ifelse(RET(1)>0,VolatC,0)),
    VolatDnDays = series(ifelse(RET(1)<0,VolatC,0));
  var EMAUp = EMA(VolatUpDays,PdsEMA),
    EMADn = EMA(VolatDnDays,PdsEMA);
  var RS = abs(EMAUp-EMADn)/(EMAUp+EMADn+0.00001)*Mltp;
  var Rate = 2./(Periods+1)*(RS+1);
  vars RSEMAs = series(0,2);
  return RSEMAs[0] = Rate*(priceC() + (1-Rate) * RSEMAs[1];
}
AssetPrev is the asset that was selected when the RSEMA function is called. Adding 0.00001 to the divisor prevents a crash from division by zero. In order to support multiple function calls with multiple assets, I am using here a series of length 2 for RSEMA, not a static variable as in the original code.
Figure 10 shows a chart that replicates the chart in the article in this issue, with the RSEMA(10,10,10) applied to a chart of the SPX500.
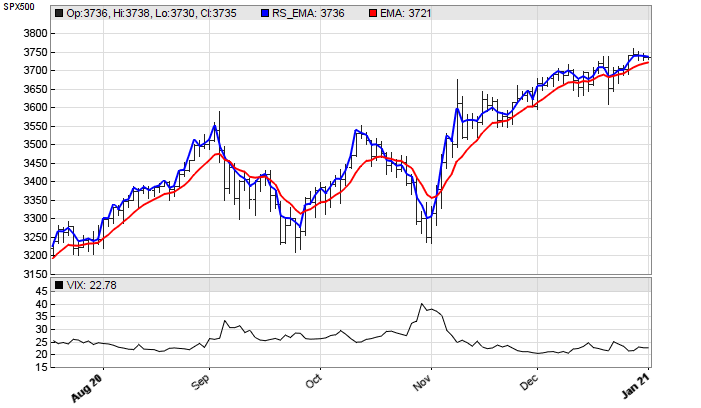
FIGURE 10: ZORRO PROJECT. Here, the RSEMA(10,10,10) is applied to a chart of the SPX500.
Looking at the chart, you can see that the RSEMA (blue) has noticeably less lag than the EMA (red), which is not really surprising because the higher alpha rate is equivalent to a smaller EMA time period. The author states that EMA crossovers of this indicator can be used as potential entry points for long trades, with the caveat that they can produce a lot of whipsaws and should be used in conjunction with price analysis. As you can see in Figure 11, a long-only SPY trading system with crossovers of the RSEMA and EMA at default parameter values produced a positive end result but with large drawdowns. Thus, it should be used only in conjunction with price analysis.
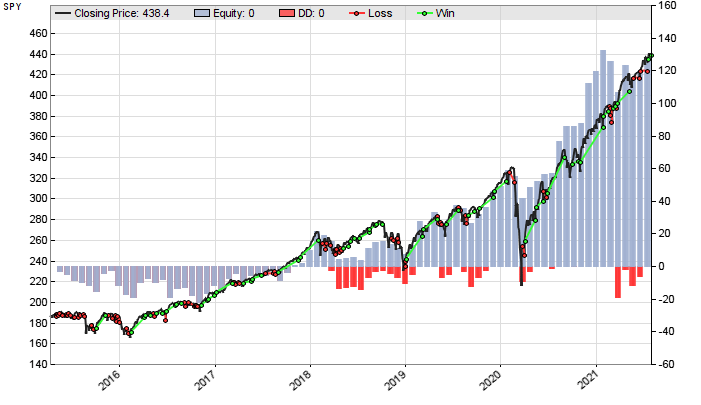
FIGURE 11: ZORRO PROJECT. This example chart shows a long-only SPY trading system with crossovers of the RSEMA and EMA at default parameter values.
The RSEMA indicator and the SPY trading system can be downloaded from the 2022 script repository on https://financial-hacker.com. The Zorro software can be downloaded from https://zorro-project.com.
—Petra Volkova
The Zorro Project by oP group Germany
https://zorro-project.com
BACK TO LIST
Microsoft Excel: March 2022
In his article in this issue, Vitali Apirine uses a volatility relative strength construct to condition an EMA (exponential moving average) of a closing price series.
Simply stated, when using this construct, the higher the volatility RS (relative strength) at any given bar, the more reactive the resulting EMA is to the closing price of that bar.
In terms of the user parameters to this indicator, parameters of a shorter length mean a result that tracks the close price closely (Figure 12) while parameters of a longer length ease the fit (Figure 13).

FIGURE 12: EXCEL. Volatility (^VIX) relative strength adjusted EMAs of the close are shown.

FIGURE 13: EXCEL. Using somewhat longer parameters help to reflect overall trends in the price and may help prevent leaving money on the table by exiting too soon.
The author suggests that when the shorter-spec EMA crosses up over the longer-spec EMA, and the overall trend is up, we have a potential buying opportunity. He cautions that down crosses should be ignored in an overall uptrend. So other exit strategies are necessary. Likewise, a down cross in an overall downtrend can signal a potential shorting opportunity, with similar exit caveats.
To download this spreadsheet: The spreadsheet file for this Traders’ Tip can be downloaded here. To successfully download a working version of the spreadsheet, follow these steps:
- Right-click on the Excel file link, then
- Select “save as” (or “save target as”) to place a copy of the spreadsheet file on your hard drive.
—Ron McAllister
Excel and VBA programmer
rpmac_xltt@sprynet.com
BACK TO LIST
Originally published in the March 2022 issue of
Technical Analysis of STOCKS & COMMODITIES magazine.
All rights reserved. © Copyright 2022, Technical Analysis, Inc.


