TRADERS’ TIPS
May 2022

For this month’s Traders’ Tips, the focus is Vitali Apirine’s article in the January 2022 issue, “Relative Strength Moving Averages, Part 1: The Relative Strength Exponential Moving Average (RS EMA).” Here, we present the May 2022 Traders’ Tips code with possible implementations in various software.
You can right-click on any chart to open it in a new tab or window and view it at it’s originally supplied size, often much larger than the version printed in the magazine.
The Traders’ Tips section is provided to help the reader implement a selected technique from an article in this issue or another recent issue. The entries here are contributed by software developers or programmers for software that is capable of customization.

TradeStation: May 2022
In part 1 of a three-part series focused on differences between traditional EMAs and relative strength-based EMA indicators, author Vitali Apirine introduces the relative strength exponential moving average (RS EMA). The study is designed to account for relative strength of price and is considered a trend-following indicator that can be used in combination with an EMA of the same length to identify the overall trend. RS EMAs with different lengths can define turning points and filter price movements.
inputs:
	Periods( 50 ),
	Pds( 50 ),
	Mltp( 10 );

variables:
	Mltp1( 0 ),
	Cup( 0 ),
	Cdwn( 0 ),
	RS( 0 ),
	Rate( 0 ),
	CalcValue( 0 );

Mltp1 = 2 / ( Periods + 1 );
Cup = Iff( Close > Close[1], Close - Close[1] , 0 );
Cdwn = Iff( Close < Close[1], Close[1]-Close, 0 );
RS = AbsValue( XAverage( CUP, Pds )- XAverage( Cdwn, Pds ) ) /
 ( XAverage( CUP, Pds ) + XAverage( Cdwn, Pds ) + 0.00001 );

RS = RS * Mltp;
Rate = Mltp1 * ( 1 + RS );

CalcValue = Iff( CurrentBar = 1, Close, CalcValue[1] + Rate *( Close - CalcValue[1] ) );

Plot1( CalcValue );
A sample chart is shown in Figure 1.

FIGURE 1: TRADESTATION. A TradeStation daily chart of the S&P 500 index ($SPX.X) with the RS EMA indicator (in blue) and a 50-day exponential moving average (in red) applied. The RS EMA indicator is applied with the inputs 50, 50, and 10.
This article is for informational purposes. No type of trading or investment recommendation, advice, or strategy is being made, given, or in any manner provided by TradeStation Securities or its affiliates.
—John Robinson
TradeStation Securities, Inc.
www.TradeStation.com
BACK TO LIST

TradingView: May 2022
Here is the Pine Script code for use in TradingView that implements the relative strength exponential moving average (RS EMA), which is described in the January 2022 article by Vitali Apirine titled “Relative Strength Moving Averages, Part 1: RSEMA.”
//  TASC Issue: May 2022 - Vol. 40, Issue 5
//     Article: Relative Strength Moving Averages
//              Part 1: The Relative Strength
//              Exponential Moving Average (RS EMA)
//  Article By: Vitali Apirine
//    Language: TradingView's Pine Script v5
// Provided By: PineCoders, for tradingview.com

//@version=5
indicator(title='TASC 2022.05 RS EMA', overlay=true)

int periods = input.int(  title='EMA Length:'   , defval=50)
int     pds = input.int(  title='RS Length:'    , defval=50)
float  mltp = input.float(title='RS Multiplier:', defval=10.0)

rsema (  float       source = close,
         simple int periods = 50,
         simple int     pds = 50,
         float   multiplier = 10.0
         ) =>
    float mltp1 = 2.0 / (periods + 1.0)
    float diff = ta.change(close)
    float cup = diff > 0 ? diff : 0.0
    float cdn = diff < 0 ? math.abs(diff) : 0.0
    float acup = ta.ema(cup, pds)
    float acdn = ta.ema(cdn, pds)
    float rs = math.abs(acup - acdn)
    rs /= (acup + acdn + 0.00001)
    rs *= multiplier
    float rate = mltp1 * (1.0 + rs)
    float rsema = close
    float prev = nz(rsema[1])
    rsema := prev + rate * (close - prev)
    rsema

float rsema = rsema(close, periods, pds, mltp)

plot(series=rsema, title='RS EMA', color=color.green)
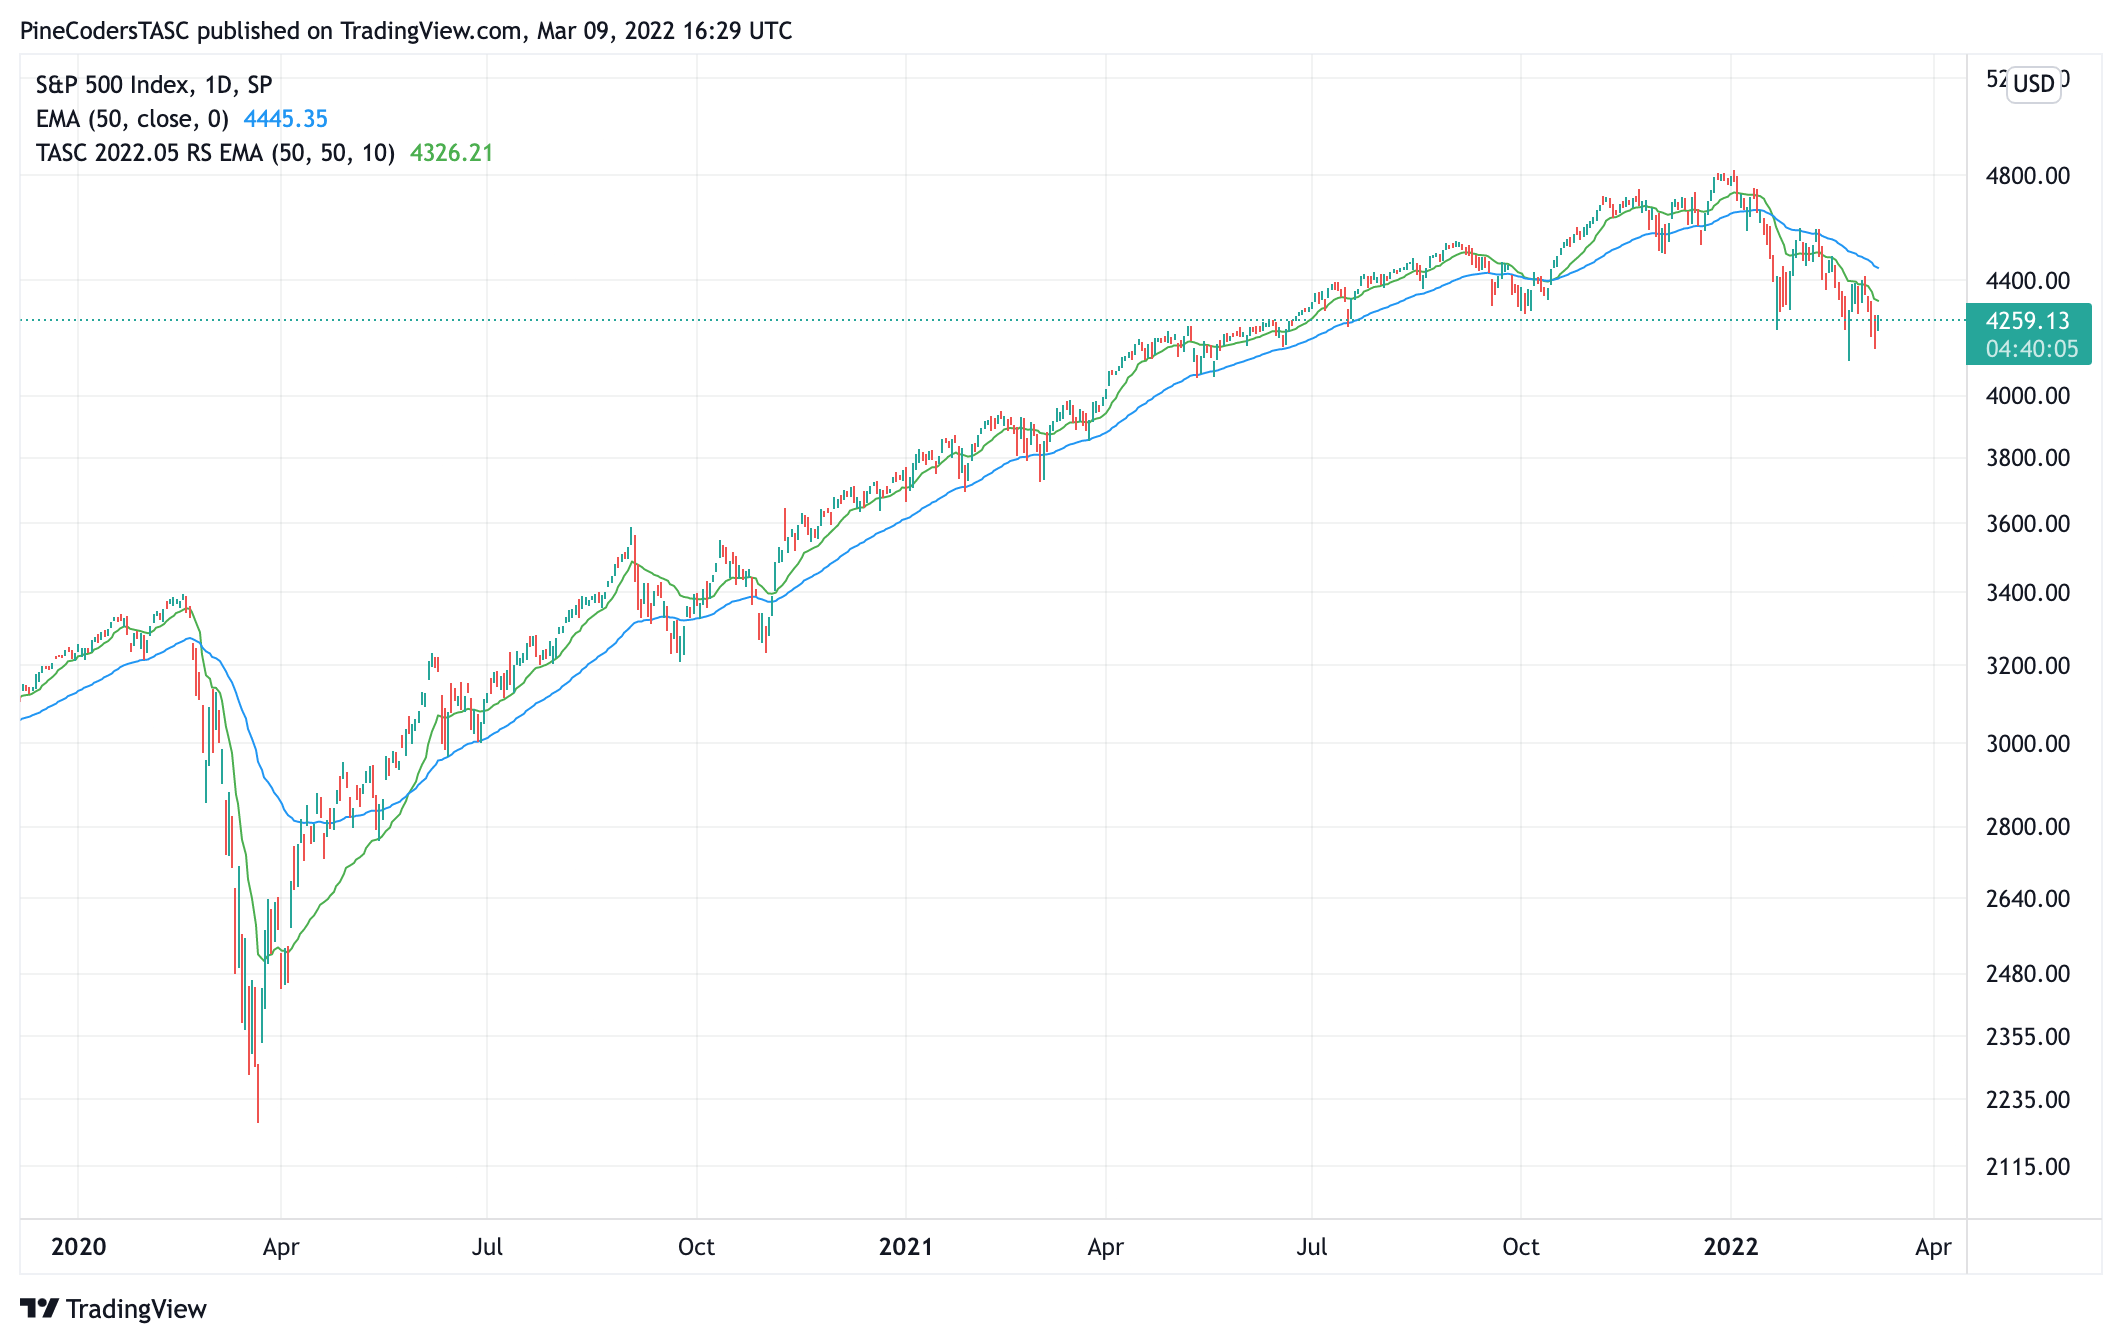
FIGURE 2: TRADINGVIEW. Shown is an example of the relative strength exponential moving average (RS EMA) on a chart of the S&P 500 index.
The indicator is available on TradingView from the PineCodersTASC account:
tradingview.com/u/PineCodersTASC/#published-scripts
—PineCoders, for TradingView
www.TradingView.com
BACK TO LIST

eSignal: May 2022
For this month’s Traders’ Tip, we’re providing the study RS EMA.efs based on the article by Vitali Apirine in the January 2022 issue, “Relative Strength Moving Averages, Part 1: The RS EMA.”
The study contains formula parameters that may be configured through the edit chart window (right-click on the chart and select “edit chart”). A sample chart is shown in Figure 3.

FIGURE 3: eSIGNAL. Here is an example of the study plotted on a daily chart of $RUT.
To discuss this study or download a complete copy of the formula code, please visit the EFS library discussion board forum under the forums link from the support menu at www.esignal.com or visit our EFS KnowledgeBase at www.esignal.com/support/kb/efs. The eSignal formula script (EFS) is also available for copying & pasting below.
/**********************************
Provided By:
Copyright 2019 Intercontinental Exchange, Inc. All Rights Reserved.
eSignal is a service mark and/or a registered service mark of Intercontinental Exchange, Inc.
in the United States and/or other countries. This sample eSignal Formula Script (EFS)
is for educational purposes only.
Intercontinental Exchange, Inc. reserves the right to modify and overwrite this EFS file with each new release.

Description:
    Relative Strength Moving Averages
    by Vitali Apirine


Version:            1.00  09/03/2022

Formula Parameters:                     Default:
Periods                                 50
Mltp                                    10


Notes:
The related article is copyrighted material. If you are not a subscriber
of Stocks & Commodities, please visit www.traders.com.

**********************************/
var fpArray = new Array();
var bInit = false;

function preMain() {
    setStudyTitle("RS EMA");
    setCursorLabelName("RS EMA", 0);
    setPriceStudy(true);
    setDefaultBarFgColor(Color.RGB(0x00,0x94,0xFF), 0);
    setPlotType( PLOTTYPE_LINE , 0 );
    setDefaultBarThickness(2, 0);

    var x=0;
    fpArray[x] = new FunctionParameter("Periods", FunctionParameter.NUMBER);
	with(fpArray[x++]){
        setLowerLimit(1);
        setDefault(50);
    }
    fpArray[x] = new FunctionParameter("Pds", FunctionParameter.NUMBER);
	with(fpArray[x++]){
        setLowerLimit(1);
        setDefault(50);
    }
    fpArray[x] = new FunctionParameter("Mltp", FunctionParameter.NUMBER);
	with(fpArray[x++]){
        setLowerLimit(1);
        setDefault(10);
    }
}

var bVersion = null;
var xClose = null;
var RS = null;
var RS_1 = null;
var Mltp1 = null;


function main(Periods, Pds, Mltp) {
    if (bVersion == null) bVersion = verify();
    if (bVersion == false) return;

    if ( bInit == false ) {
        xClose = close();
        Mltp1 = 2 / (Periods+1);
        RS = 0;
        RS_1 = 0;

        xCup = efsInternal('Calc_Cup', xClose);
        xCdwn = efsInternal('Calc_Cdwn', xClose);
        xRS = efsInternal('Calc_RS', xCup, xCdwn, Pds, Mltp);

        bInit = true;
    }
    if (getCurrentBarCount() <= Periods) return;
    if (getBarState() == BARSTATE_NEWBAR) {
        RS_1 = RS;
        RS = 0;
    }

    Rate = Mltp1 * (1+xRS.getValue(0));
    if (getCurrentBarCount() == Periods + 1) ret = xClose.getValue(0);
    else ret = RS_1 + Rate * (xClose.getValue(0) - RS_1);
    RS = ret;

    return RS;
}

function Calc_RS(xCup, xCdwn, Pds, Mltp){
    x1 = ema(Pds, xCup);
    x2 = ema(Pds, xCdwn);
    ret = Math.abs(x1 - x2);
    ret = ret / (ema(Pds, xCup) + ema(Pds, xCdwn) + 0.00001);
    ret = ret * Mltp;

    return ret;
}
var ret = 0;
function Calc_Cdwn(xClose){
    var ret = 0;
    if (xClose.getValue(0) < xClose.getValue(-1)){
        ret = xClose.getValue(-1) - xClose.getValue(0);
    }
    else ret = 0;

    return ret;
}
var ret = 0;
function Calc_Cup(xClose){
    var ret = 0;
    if (xClose.getValue(0) > xClose.getValue(-1)){
        ret = xClose.getValue(0) - xClose.getValue(-1)
    }
    else ret = 0;

    return ret;
}

function verify(){
    var b = false;
    if (getBuildNumber() < 779){

        drawTextAbsolute(5, 35, "This study requires version 10.6 or later.",
            Color.white, Color.blue, Text.RELATIVETOBOTTOM|Text.RELATIVETOLEFT|Text.BOLD|Text.LEFT,
            null, 13, "error");
        drawTextAbsolute(5, 20, "Click HERE to upgrade.@URL=https://www.esignal.com/download/default.asp",
            Color.white, Color.blue, Text.RELATIVETOBOTTOM|Text.RELATIVETOLEFT|Text.BOLD|Text.LEFT,
            null, 13, "upgrade");
        return b;
    }
    else
        b = true;

    return b;
}
—Eric Lippert
eSignal, an Interactive Data company
800 779-6555, www.eSignal.com
BACK TO LIST

Wealth-Lab.com: May 2022
In his article in January 2022 issue, Vitali Apirine introduces a new EMA-like smoothing indicator that accounts for relative strength of price.
To see how easy is to verify whether a trading idea works or not, we will construct a quick and dirty system using Wealth-Lab’s Building Blocks. Knowing that bullish and bearish crossovers can be used as entry points for trades, we drag and drop just the two crossover rules:
- Entry. Medium-term RSEMA (50,50,10) crosses above a long-term 200-period EMA
- Exit. Medium-term RSEMA (50,50,10) crosses below a long-term 200-period EMA
Without investing much effort, we created a trading system in a few clicks in just a few minutes of time (Figure 4). Figure 5 shows characteristic trades in the times of uptrends, trading ranges, and market corrections. Does the idea has merit? Further backtesting and walk-forward analysis would help shed light on it.
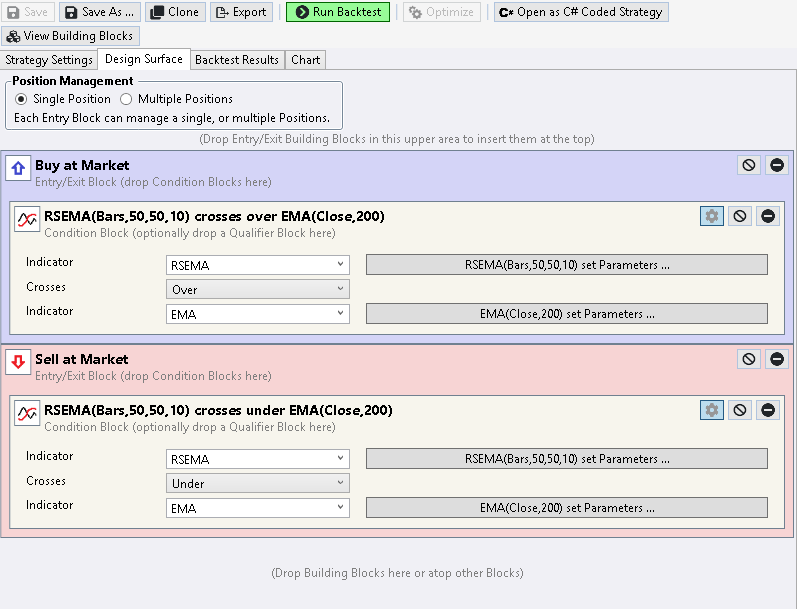
FIGURE 4: WEALTH-LAB. Prototyping a trading system is a simple task for Wealth-Lab 7.
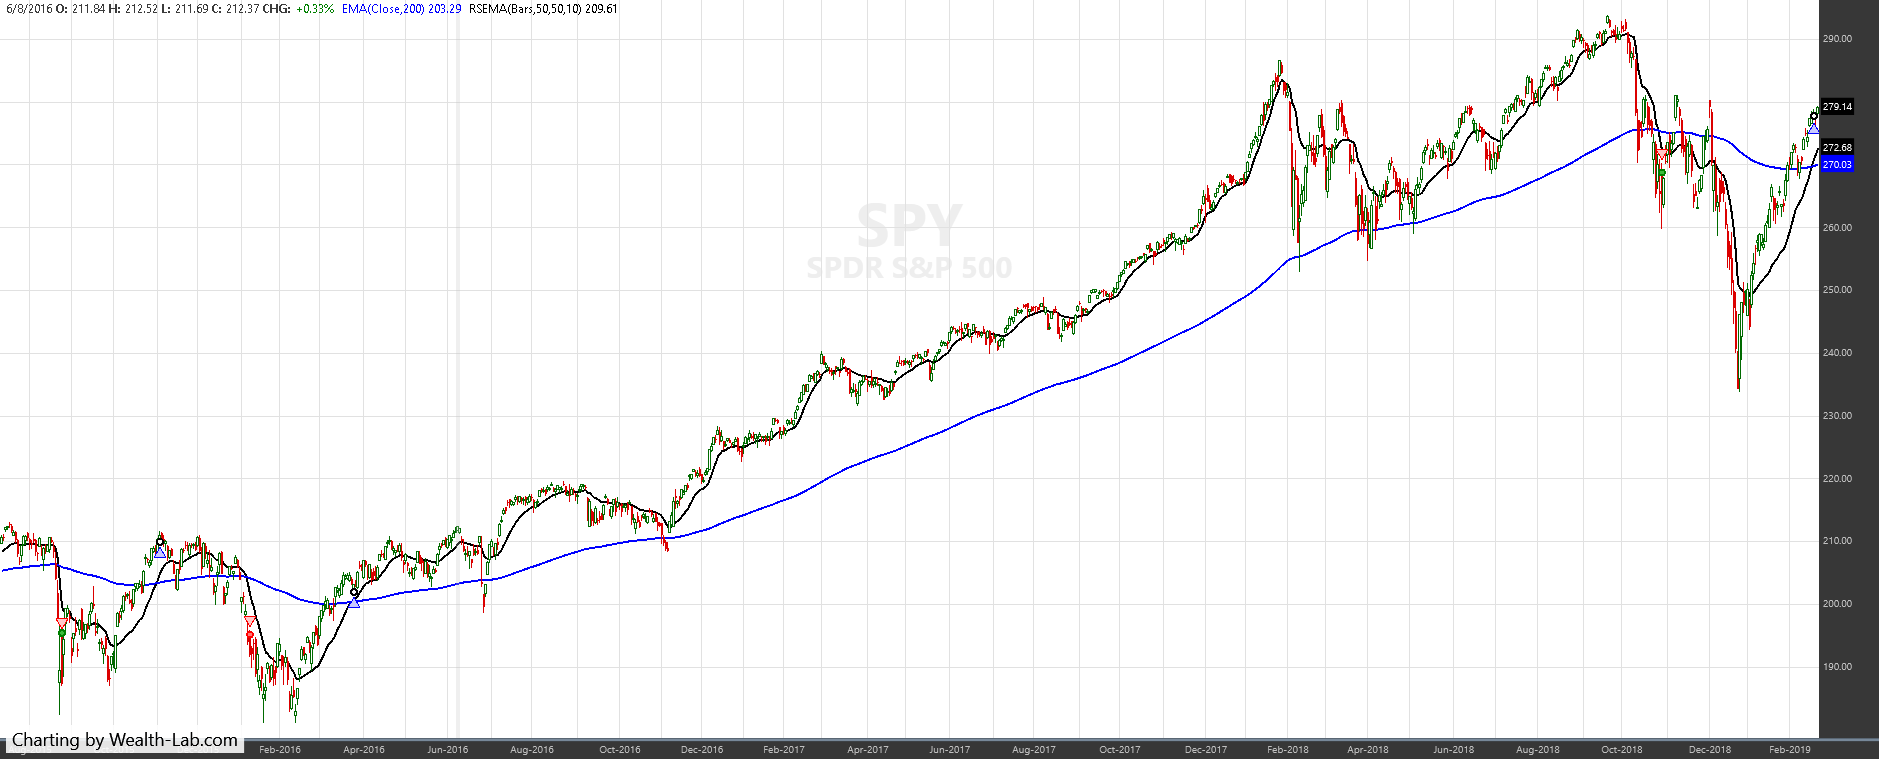
FIGURE 5: WEALTH-LAB. Sample trades taken by the system are applied to a daily chart of SPY.
—Gene Geren (Eugene)
Wealth-Lab team
www.wealth-lab.com
BACK TO LIST

NinjaTrader: May 2022
The RS EMA indicator, as detailed in the January 2022 S&C article titled “Relative Strength Moving Averages” by Vitali Apirine, is available for download at the following links for NinjaTrader 8 and for NinjaTrader 7:
Once the file is downloaded, you can import the indicator into NinjaTrader 8 from within the control center by selecting Tools → Import → NinjaScript Add-On and then selecting the downloaded file for NinjaTrader 8. To import in NinjaTrader 7 from within the control center window, select the menu File → Utilities → Import NinjaScript and select the downloaded file.
You can review the indicator’s source code in NinjaTrader 8 by selecting the menu New → NinjaScript Editor → Indicators from within the control center window and selecting the RSEMA file. You can review the indicator’s source code in NinjaTrader 7 by selecting the menu Tools → Edit NinjaScript → Indicator from within the control center window and selecting the RSEMA file
NinjaScript uses compiled DLLs that run native, not interpreted which provides you with the highest performance possible.
A sample chart displaying the indicator is shown in Figure 6.

FIGURE 6: NINJATRADER. The chart showcases RSEMA(10,50,50) and RSEMA(10,20,20) applied to daily FTSE 100 index futures data from October 2017 to May 2018.
—Brandon Haulk
NinjaTrader, LLC
www.ninjatrader.com
BACK TO LIST

Neuroshell Trader: May 2022
The relative strength exponential moving average can be easily implemented in NeuroShell Trader using NeuroShell Trader’s ability to call external dynamic linked libraries (DLLs). Dynamic linked libraries can be written in C, C++, and Power Basic.
After moving the code given in the article to your preferred compiler and creating a DLL, you can insert the resulting indicator as follows:
- Select “new indicator” from the insert menu.
- Choose the External Program & Library Calls category.
- Select the appropriate External DLL Call indicator.
- Setup the parameters to match your DLL.
- Select the finished button.

FIGURE 7: NEUROSHELL TRADER. This NeuroShell Trader chart shows the standard EMA versus relative strength EMA.
NeuroShell Trader users can go to the Stocks & Commodities section of the NeuroShell Trader free technical support website to download a copy of this or any previous Traders’ Tips.
—Ward Systems Group, Inc.
sales@wardsystems.com
www.neuroshell.com
BACK TO LIST

Optuma: May 2022
Here is the code translation for the January 2022 article “Relative Strength Moving Averages, Part 1: RSEMA” by Vitali Apirine, for use on the Optuma platform.
#$EMABar = 50;
#$RSBar = 50;
#$MLTPBar = 10;
MLTP = 2 / (VarToList(VAL=$MLTPBar) + 1);
MLTPRS = 2 / (VarToList(VAL=$RSBar) + 1);
Gain = IF(Close() IsUp, Close() - Close()[1], 0);
Loss = IF(Close() IsDown, Close()[1] - Close(), 0);
EMAGain = MA(Gain,CALC=Close, STYLE=Exponential, BARS=$EMABar);
EMALoss = MA(Loss,CALC=Close, STYLE=Exponential, BARS=$EMABar);
RS=ABS(EMAGain - EMALoss) / (EMAGain + EMALoss) + 0.00001;
RSEMA = RSEMA[1] + MLTP * (1 + RS * MLTPRS) * (Close() - RSEMA[1]);
RSEMA
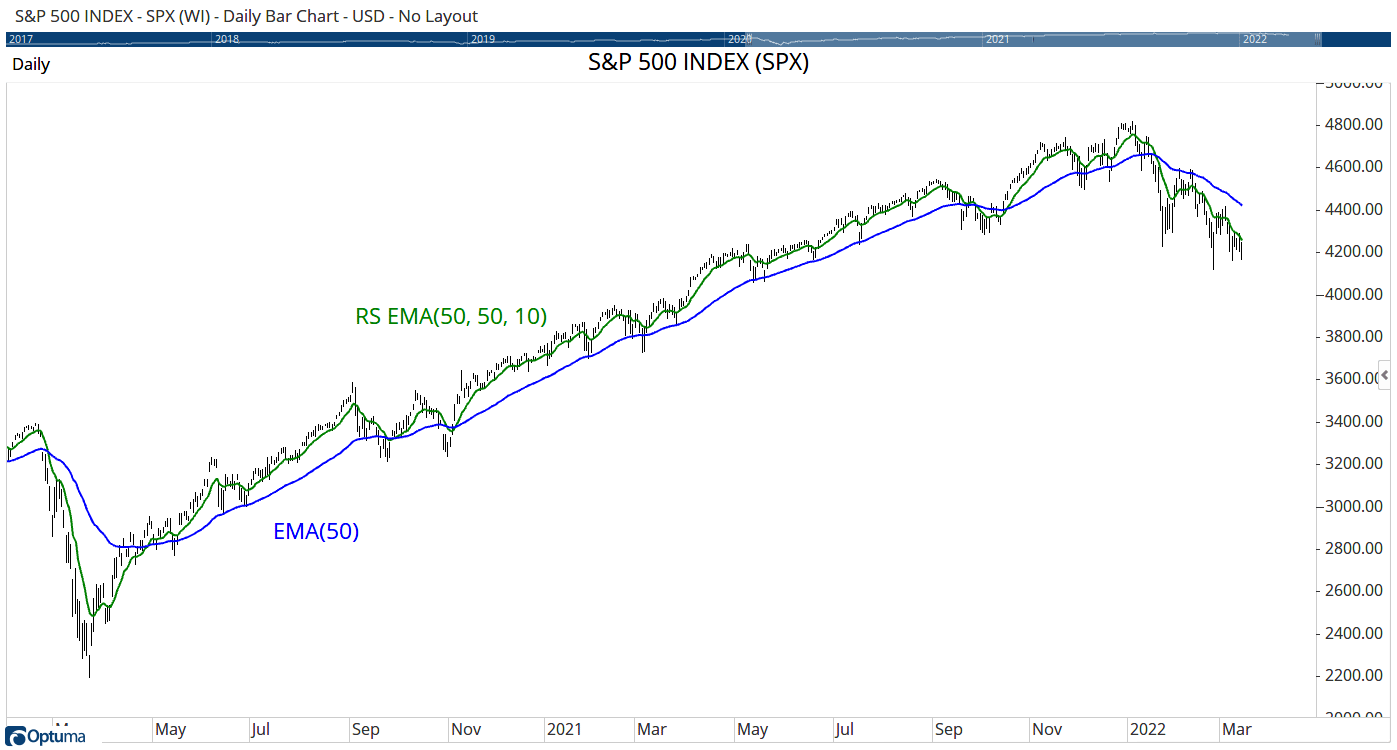
FIGURE 8: OPTUMA. This sample chart displays the RS EMA on a chart of the S&P 500 index.
—support@optuma.com
Optuma.com
BACK TO LIST

TradersStudio: May 2022
The importable TradersStudio files based on Vitali Apirine’s January 2022 article, “Relative Strength Exponential Moving Averages, Part 1: The RS EMA,” can be obtained on request via email to info@TradersEdgeSystems.com. The code is also shown below.
Code for the author’s indicators is provided in following files:
- Function RSEMA: Computes the RSEMA moving average indicator
- Indicator plot RSEMA_IND: Plots the RSEMA indicator on a chart
A sample TradersStudio chart is shown in Figure 9.

FIGURE 9: TRADERSSTUDIO. Shown here is the RSEMA(50,50,10) in red and a EMA(50) in cyan on a chart of Cisco Systems.
'Relative Strength Exponential Moving Average
'Author: Vitali Apirine, TASC Jan 2022
'Coded by: Richard Denning, 3/8/2022

Function RSEMA(Periods, Pds, Mltp)
'Periods = 50, Pds = 50, Mltp = 10
Dim MLTP1
Dim Cup As BarArray
Dim Cdwn As BarArray
Dim RS As BarArray
Dim Rate
Dim RSe As BarArray
MLTP1 = 2/(Periods + 1)
Cup = IIF(C>C[1],C-C[1],0)
Cdwn = IIF(C<C[1],C[1]-C,0)
RS=Abs(XAverage(Cup,Pds,0)-XAverage(Cdwn,Pds,0))/(XAverage(Cup,Pds,0)+XAverage(Cdwn,Pds,0)+0.00001)
RS=RS*Mltp
Rate=MLTP1*(1+RS)
RSe = RSe[1] + Rate*(C-RSe[1])
RSEMA = RSe
End Function
'-----------------------------------------------------
'INDICATOR PLOT
Sub RSEMA_IND(Periods, Pds, Mltp)
Dim RSe As BarArray
RSe = RSEMA(Periods, Pds, Mltp)
plot1(RSe)
End Sub
'------------------------------------------------------
—Richard Denning
info@TradersEdgeSystems.com
for TradersStudio
BACK TO LIST

TradersStudio: April 2022
An importable TradersStudio file based on Markos Katsanos’ article in the April 2022 issue, “Stock Market Seasonality,” can be obtained on request via email to info@TradersEdgeSystems.com. The code is also available below.
Code for the Katsanos’ indicators is provided in following files:
- HSEASONAL_SYS: system code for the seasonal buy/sell signals
- Function VFI2022: computes the VFI indicator
- Function ATR: computes the average true range
- Indicator plot VFI_IND: plots the VFI indicator on a chart
'Stock Market Seasonality
'Author: Markos Katsanos, TASC April 2022
'Coded by: Richard Denning, 2/12/2022

Sub HSEASONAL_sys(SELLMONTH,VIXUPMAX,CRIT,K)
'SELLMONTH is 8.
'VIXUPMAX is 60.
'CRIT is -20. !VFI SELL
'K is 1.5.  !ATR/VIX RATIO
Dim VIX As BarArray
Dim vixDN As BarArray
Dim vixUP As BarArray
Dim atrDN As BarArray
Dim atrUP As BarArray
Dim myATR As BarArray
Dim theVFI As BarArray
Dim VOLCONDITION As BarArray
Dim SELLSEASONAL As BarArray
Dim SELLVOLATILITY As BarArray
Dim SELLMF As BarArray
Dim AvgVFI As BarArray
Dim myVFI As BarArray
Dim theCross As BarArray
Dim AvgVFIdn As BarArray
Dim Period,Coef,VCoef,SmoPeriods,MA

VIX = C Of independent1
vixDN=Round((VIX/(HighestBar(VIX,25,1))-1),0)*100
vixUP=Round((VIX/(LowestBar(VIX,25,1))-1),0)*100
myATR=ATR(H,L,C,15)
atrDN=Round((myATR/(HighestBar(myATR,25,1))-1),0)*100
atrUP=Round((myATR/(LowestBar(myATR,25,1))-1),0)*100

Period=130
Coef=0.2
VCoef=2.5
SmoPeriods=3
MA=30

theVFI=VFI2022(Period, Coef, VCoef,SmoPeriods, MA)
VOLCONDITION=IFF((vixUP<VIXUPMAX Or atrUP<K*VIXUPMAX ) And theVFI>CRIT,1,0)

If(Month(Date)>=10 Or Month(Date)<SELLMONTH) And (VOLCONDITION[1]=1) Then Buy("LE",1,0,Market,Day)

SELLSEASONAL=IFF(Month(Date)=SELLMONTH,1,0) 'SEASONAL Exit
SELLVOLATILITY=IFF(vixUP>2*VIXUPMAX,1,0) 'VOLATILITY Exit
AvgVFI=Round(Average(theVFI,10),0)
theCross=IFF(CRIT>theVFI And CRIT<=theVFI[1],1,0)
AvgVFIdn=IFF(AvgVFI<AvgVFI[1],1,0)
SELLMF=IFF(CRIT>theVFI And CRIT<=theVFI[1] And AvgVFI<AvgVFI[1],1,0)

If SELLSEASONAL Then ExitLong("LXsea","",1,0,Market,Day)
If SELLVOLATILITY=1 Then ExitLong("LXvola","",1,0,Market,Day)
If SELLMF=1 Then ExitLong("LXmf","",1,0,Market,Day)
End Sub
'---------------------------------------------------------------------------------------------------
Function VFI2022(Period, Coef, VCoef, SmoothingPeriods, theMA)
   'Period = 130
    'Coef = .2
    'VCoef = 2.5
    'SmoothingPeriods = 3
    'MA = 30
    Dim TP As BarArray
    Dim Inter As BarArray
    Dim VInter As BarArray
    Dim CutOff As BarArray
    Dim VAve As BarArray
    Dim VMax As BarArray
    Dim theVC As BarArray
    Dim theMF As BarArray
    Dim DirVol As BarArray
    Dim myVFI As BarArray
    Dim SumDV As BarArray

    TP = (H+L+C)/3
    If TP > 0 And TP[1] > 0 Then
        Inter = Log(TP) - Log(TP[1])
    Else
        Inter = 0
    End If
    VInter = StdDev(Inter,theMA)
    CutOff = Coef * VInter * C
    VAve = Average(V,Period)/1000
    VMax = VAve[1] * VCoef
    theVC = IIF(V/1000 < VMax , V/1000, VMax)
    theMF = TP - TP[1]
    DirVol = IIF(theMF > CutOff, theVC, IIF(theMF < -CutOff, -theVC, 0))

    If VAve[1] <> 0 Then
    Dim PosDV As BarArray
    Dim NegDV As BarArray
    Dim SumDVpos As BarArray
    Dim SumDVneg As BarArray

        PosDV = IIF(DirVol>0,DirVol,0)
        NegDV = IIF(DirVol<0,DirVol,0)
        SumDVpos = summation(PosDV/1000,Period)
        SumDVneg = summation(NegDV/1000,Period)
        SumDV = SumDVpos + SumDVneg
        myVFI =  SumDV / (VAve[1]/1000)
    Else
        myVFI = 0
    End If
    If SmoothingPeriods > 0 Then
        myVFI = XAverage(myVFI, SmoothingPeriods)
    Else
        myVFI = myVFI
    End If
    VFI2022=Round(myVFI,2)
End Function
'-----------------------------------------------------------------------------
' AVERAGE TRUE RANGE
Function ATR(PriceH As BarArray,PriceL As BarArray,PriceC As BarArray,ATRlen)
Dim TR As BarArray
TR  = Max(PriceH - PriceL,Max(Abs(PriceC[1] - PriceL),Abs(PriceC[1]- PriceH)))
ATR = Average(TR,ATRlen)
End Function
'-----------------------------------------------------------------------------
'INDICATOR PLOT
Sub VFI_IND(Period, Coef, VCoef, SmoothingPeriods, MA)
Dim theVFI As BarArray
theVFI = VFI2022(Period, Coef, VCoef, SmoothingPeriods, MA)
Plot1(theVFI)
Plot2(0)
'-------------------------------------------------------------
End Sub
—Richard Denning
info@TradersEdgeSystems.com
for TradersStudio
BACK TO LIST

The Zorro Project: May 2022
In the March 2022 issue, we implemented the volatility-adjusted relative strength moving average, which was part 3 of the article series by Vitali Apirine titled “Relative Strength Moving Averages.” This time, we will implement the RS EMA based on part 1 of his article series, which appeared in the January 2022 issue.
This task is to measure the relative strength of an EMA and use the result for the time period of another EMA. Here is the algorithm from the article, reformulated for clarity:
RSEMA[0] = Alpha * Price + (1-Alpha) * RSEMA[1]
This is a classical EMA, but with an RSI-dependent alpha factor:
Alpha = 2/(TimePeriod+1) * (1 + 10*abs(EMA(Gain)-EMA(Loss))/(EMA(Gain)-EMA(Loss)))
EMA(Loss) is the 10-day EMA of negative returns. The separation into positive and negative returns resembles the RSI. The code converted from MetaStock to C is:
var RSEMA1(int Periods, int Pds, var Mltp)
{
  var Cup = max(RET(1),0), Cdn = max(-RET(1),0);
  var EMAUp = EMA(Cup,Pds), EMADn = EMA(Cdn,Pds);
  var RS = abs(EMAUp-EMADn)/(EMAUp+EMADn+0.00001)*Mltp;
  var Rate = 2./(Periods+1)*(RS+1);
  return EMA(priceC(),Rate);
}
Adding 0.00001 to the divisor prevents a crash by division by zero.
The RSEMA1(10,10,10) applied to an SPX500 chart in Figure 10 replicates the chart in the article.
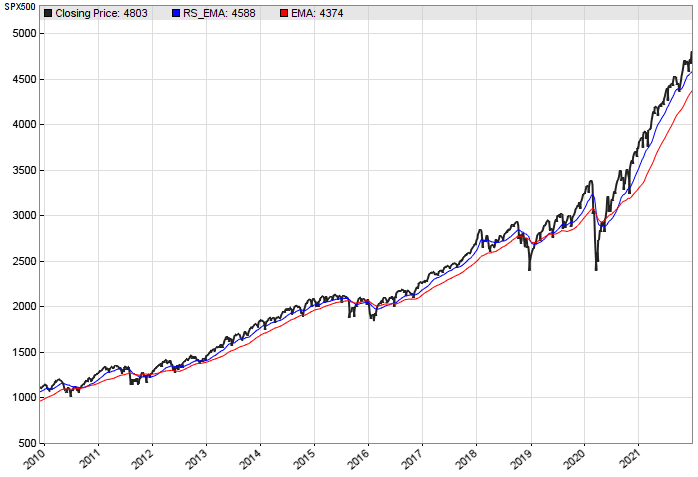
FIGURE 10: the ZORRO PROJECT. This chart replicates the chart given in the article, “Relative Strength Moving Averages, Part 1: The RS EMA,” in the January 2022 issue.
We can see that the 200-day RSEMA (blue) indeed captured the 2015–2016 corrections. This gives us hope that trading the RSEMA-EMA crossovers could produce a better result than buy & hold. Here is the code for the trading system:
function run()
{
  BarPeriod = 1440;
  LookBack = 250;
  StartDate = 2009;
  EndDate = 2021;
  asset("SPY");

  vars RSEMAs = series(RSEMA1(200,200,10));
  vars EMAs = series(EMA(priceC(),200));
  if(crossOver(RSEMAs,EMAs))
    enterLong();
  if(crossUnder(RSEMAs,EMAs))
    exitLong();
  plotBuyHold("SPY",GREY);
}
The result from trading the RSEMA-EMA crossovers with SPY on leverage 2, blue = RSEMA1 crossover equity curve, gray = benchmark equity curve from SPY buy & hold is shown in Figure 11.
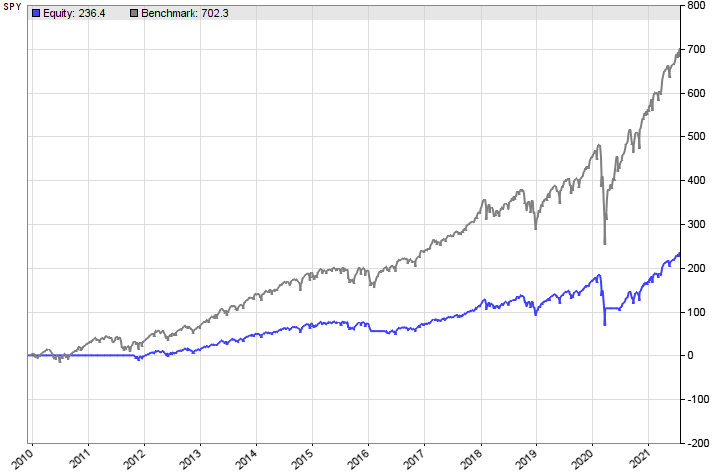
FIGURE 11: the ZORRO PROJECT. This shows the result from trading the RSEMA-EMA crossovers with SPY on leverage 2, blue = RSEMA1 crossover equity curve, gray = benchmark equity curve from SPY buy & hold.
Although the buy & hold benchmark generates higher end profit, the RSEMA1 system appears to have smaller drawdowns.
The RSEMA1 indicator and the SPY trading system can be downloaded from the 2022 script repository on https://financial-hacker.com. The Zorro software can be downloaded from https://zorro-project.com.
—Petra Volkova
The Zorro Project by oP group Germany
https://zorro-project.com
BACK TO LIST
Microsoft Excel: May 2022
In “Relative Strength Moving Averages, Part 1: The RS EMA” in the January 2022 issue, author Vitali Apirine walks us through the construction and features of RsEMA, the first of his three approaches to using various relative strength measures toward improving on the basic EMA indicator.
Apirine notes that RsEMA, like the standard EMA, “...is a trend-following, lagging indicator that responds more quickly to price changes” than a standard EMA of the same length. So it may be used to identify turning points with a bit less delay. He also notes that “in the absence of a strong trend, RsEMA-based strategies can produce lots of whipsaws. So it should be used in conjunction with other indicators to help filter the whipsaw situations.”
Figure 12 replicates the chart in Figure 3 of Apirine’s article using Excel. In the user controls area at the left, you may specify the period lengths for two separate EMA calculations and the parameters for two separate RsEMA calculations.

FIGURE 12: EXCEL. This chart replicates Figure 3 from the article, “Relative Strength Moving Averages, Part 1: The RS EMA,” in the January 2022 issue.
You select the mix and match of how they are to be displayed on the chart by clicking a combination of buttons in the “clutter control” area to the right of the chart. The major decision is 1 or 2 (see Figure 13). You will achieve a price chart and then you choose which mix of indicators to display in your chart arrangement.

FIGURE 13: EXCEL. This chart replicates Figure 5 from the article, “Relative Strength Moving Averages, Part 1: The RS EMA,” in the January 2022 issue.
Figure 13 replicates the chart in Figure 5 of Apirine’s article using Excel.
On the Notes tab of this spreadsheet, I provide directions for replicating the various charts that Apirine uses in his article.
To download this spreadsheet: The spreadsheet file for this Traders’ Tip can be downloaded here. To successfully download it, follow these steps:
- Right-click on the Excel file link, then
- Select “save as” (or “save target as”) to place a copy of the spreadsheet file on your hard drive.
—Ron McAllister
Excel and VBA programmer
rpmac_xltt@sprynet.com
BACK TO LIST
Originally published in the May 2022 issue of
Technical Analysis of STOCKS & COMMODITIES magazine.
All rights reserved. © Copyright 2022, Technical Analysis, Inc.


