TRADERS’ TIPS
September 2022

For this month’s Traders’ Tips, the focus is Vitali Apirine’s article in the August issue, “The Linear Regression-Adjusted Exponential Moving Average.” Here, we present the September 2022 Traders’ Tips code with possible implementations in various software.
You can right-click on any chart to open it in a new tab or window and view it at it’s originally supplied size, often much larger than the version printed in the magazine.
The Traders’ Tips section is provided to help the reader implement a selected technique from an article in this issue or another recent issue. The entries here are contributed by software developers or programmers for software that is capable of customization.

TradeStation: September 2022
In his article in the August 2022 issue, “The Linear Regression-Adjusted Exponential Moving Average,” author Vitali Apirine presents a technique called the linear regression-adjusted exponential moving average (LRAdj EMA) to combine a linear regression indicator with an exponential moving average. The indicator can be used to help define turning points while filtering price movement. The LRAdj EMA can be used in combination with a traditional exponential moving average of the same length to facilitate trend identification. It is important to note that when using the EasyLanguage function code below, it should be configured as a series function in the general tab of the function’s properties window.
Series Function: LRAdjEMA
// TASC SEP 2022
// LRAdjEMA - Linear Regression-adjusted Exponential
// Moving Average Series Function
// 2022 Vitali Apirine

inputs:
	Periods( numericseries),
	Pds( numericseries ),
	Mltp( numericseries );

variables:
	Mltp1( 0 ),
	LR( 0 ),
	Dist( 0 ),
	ST( 0 ),
	Mltp2( 0 ),
	Rate( 0 );

Mltp1 = 2 / (Periods + 1);
LR = LinearRegValue(Close, Pds, 0);
Dist = AbsValue(LR - Close);
ST = (Dist - Lowest(Dist, Pds)) /
 (Highest(Dist, Pds) - Lowest(Dist, Pds));
Mltp2 = ST * Mltp;
Rate = Mltp1 * (1 + Mltp2);

if CurrentBar = 1 then
	LRAdjEMA = Close
else
	LRAdjEMA = LRAdjEMA[1] + Rate *
	 (Close - LRAdjEMA[1]);

Indicator: TASC SEP 2022 LRAdj EMA
// TASC SEP 2022
// LRAdj EMA - Linear Regression-adjusted Exponential
// Moving Average Indicator
// 2022 Vitali Apirine

inputs:
	Periods( 50 ),
	Pds( 50 ),
	Mltp( 3 );

variables:
	LinRegAdjEMA( 0 );

LinRegAdjEMA = LRAdjEMA(Periods, Pds, Mltp);

Plot1(LinRegAdjEMA, "LinRegAdjEMA");
A sample chart is shown in Figure 1.
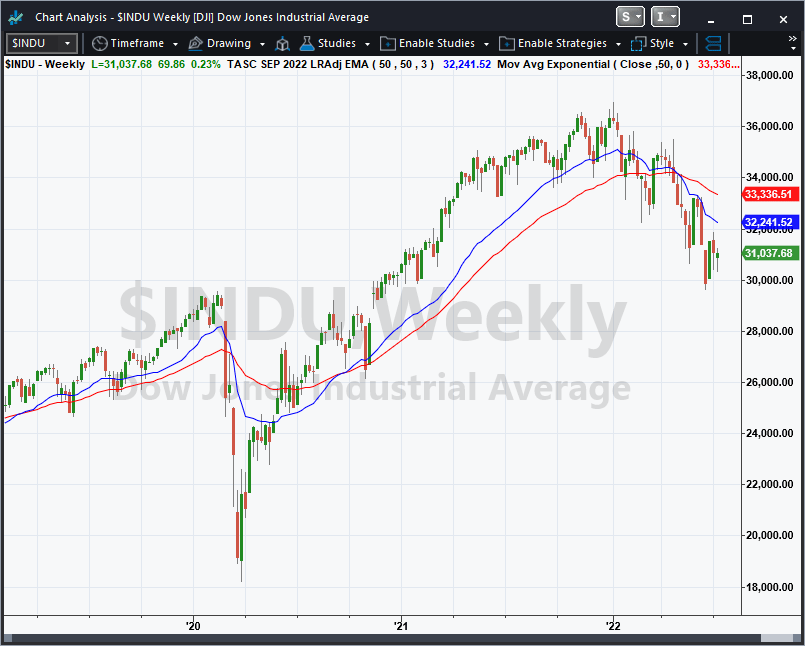
FIGURE 1: TRADESTATION. A TradeStation weekly chart of the Dow Jones Industrial Average ($INDU) is shown with the indicator (blue) applied and an exponential moving average (red). Both indicators have the same period of 50.
This article is for informational purposes. No type of trading or investment recommendation, advice, or strategy is being made, given, or in any manner provided by TradeStation Securities or its affiliates.
—John Robinson
TradeStation Securities, Inc.
www.TradeStation.com
BACK TO LIST

thinkorswim: September 2022
We have put together a study based on the August 2022 S&C article “The Linear Regression-Adjusted Exponential Moving Average” by Vitali Apirine. We built the strategy referenced by using our proprietary scripting language, thinkscript. To ease the loading process, simply click https://tos.mx/95FNU3h or enter it in setup → open shared item from within thinkorswim, then choose view thinkScript study and name it “LinearRegAdjEMA” or whatever you like and can identify. You can then add the strategy to your charts from the edit studies menu from within the charts tab and then selecting studies.
Figure 2 shows the study added to a daily chart of SPX over the period of 7/1/2019 through 11/1/2019. Please see Vitali Apirine’s article in the August 2022 issue for more information on how to utilize the study.
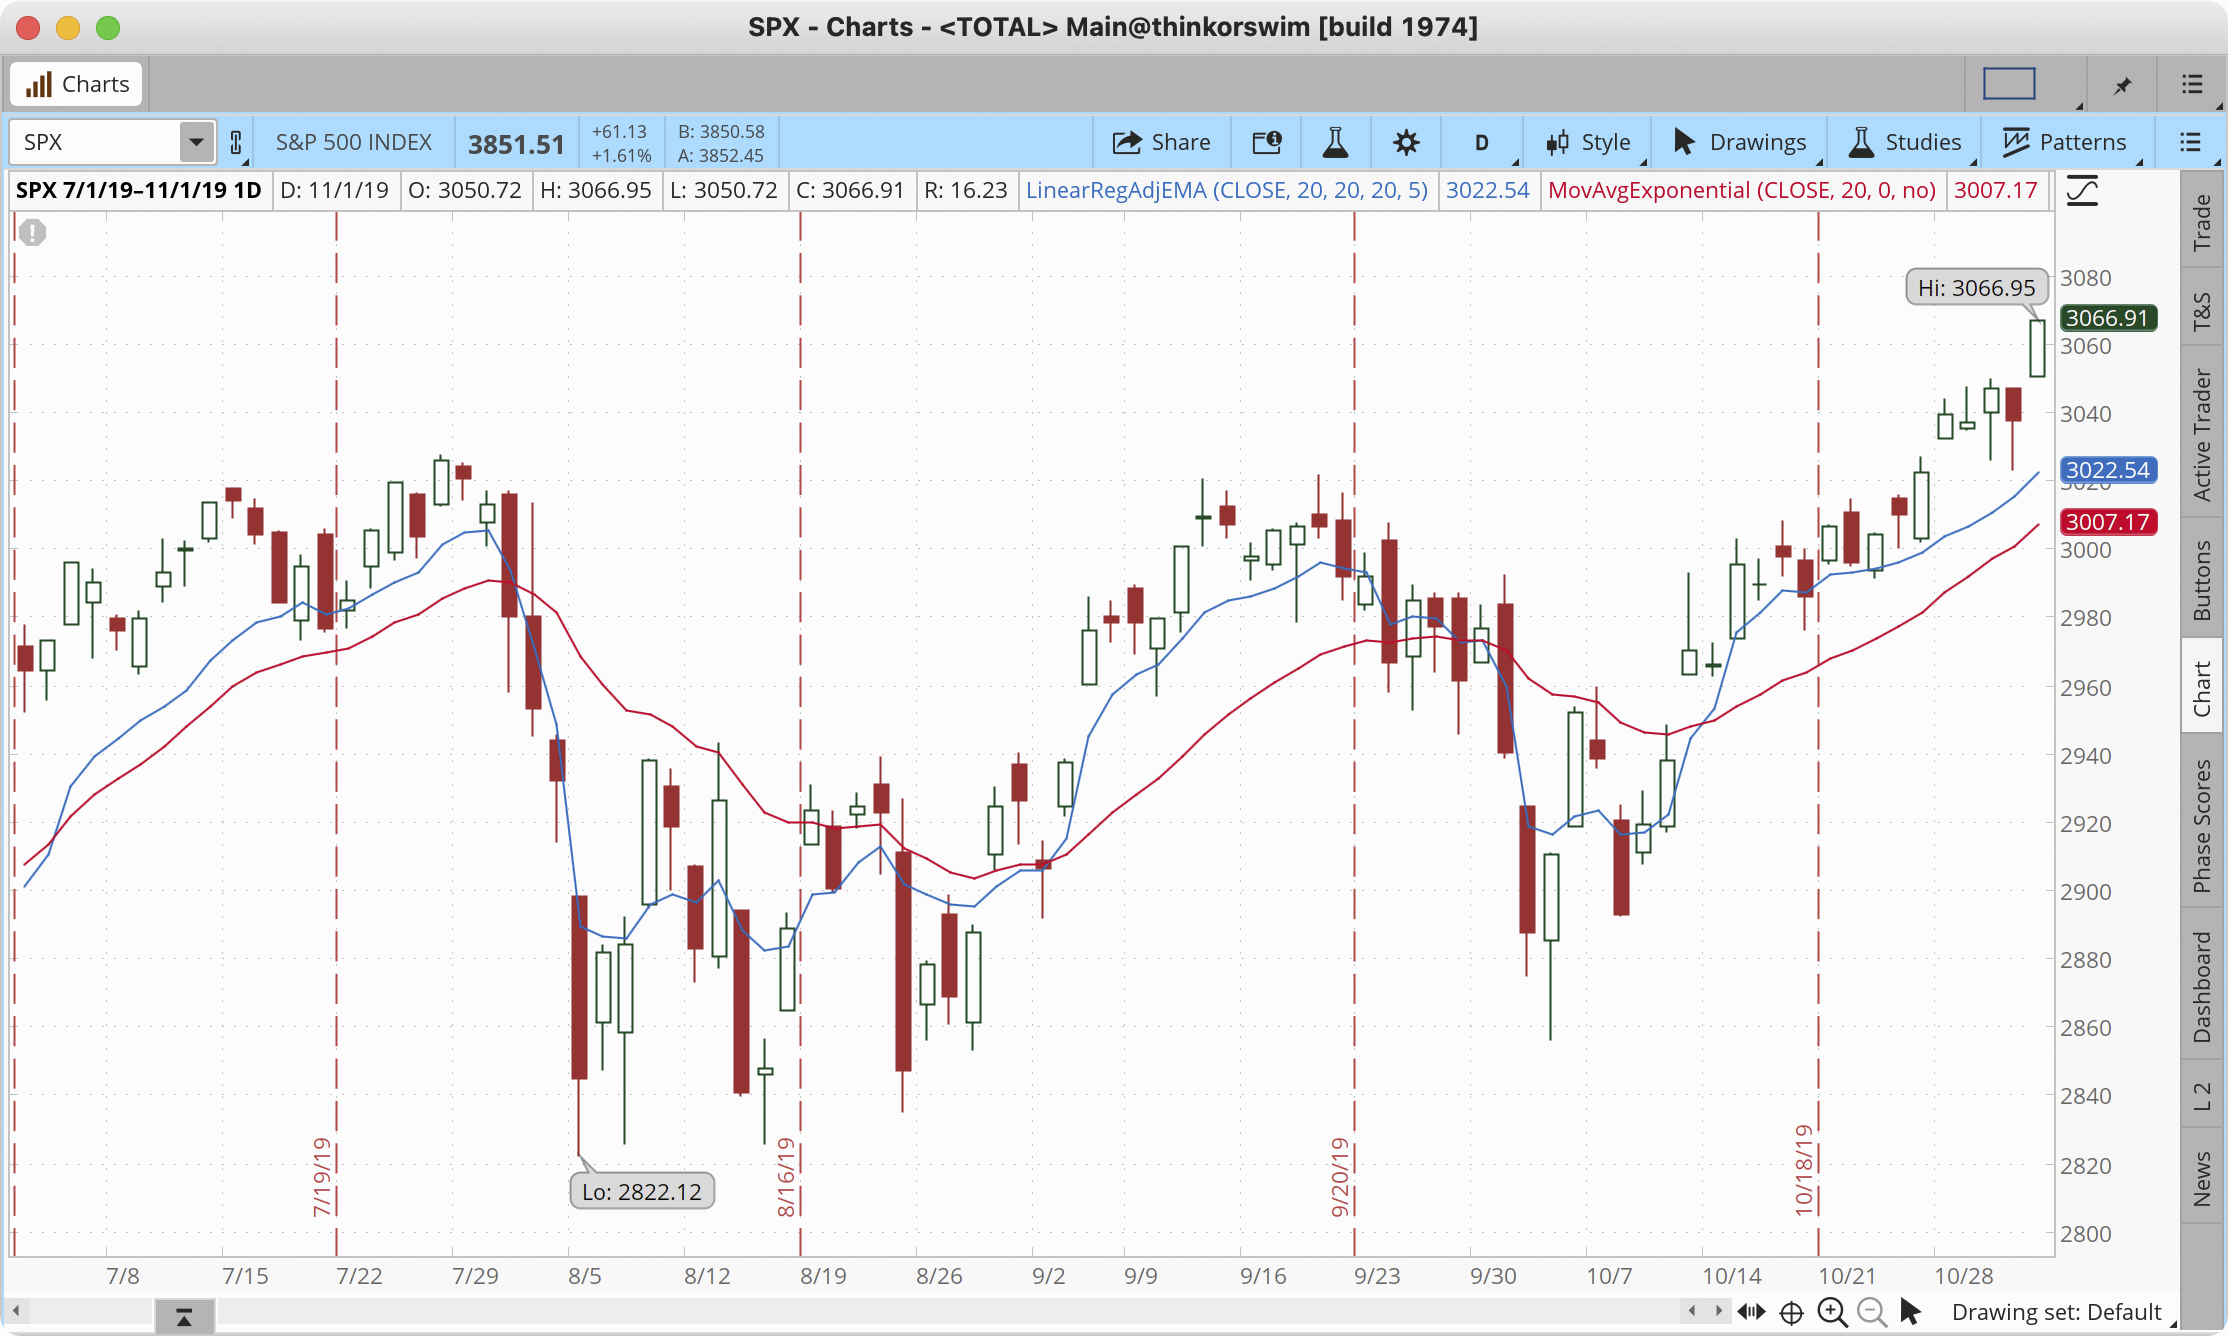
FIGURE 2: THINKORSWIM. This sample chart shows the study added to a daily chart of SPX over the period of 7/1/2019 through 11/1/2019.
—thinkorswim
A division of TD Ameritrade, Inc.
www.thinkorswim.com
BACK TO LIST

Wealth-Lab.com: September 2022
The LRAdjEMA indicator has been added to Wealth-Lab 8 Build 12, which makes it available to any tools and extensions automatically.
Building upon some ideas from Vitali Apirine’s article in the August 2022 issue of Stocks & Commodities, which introduces the indicator, let’s review the interplay of the LRAdjEMA and EMA. It’s a cinch in Wealth-Lab to create a trading system based on crossovers of the two related smoothers with faster and slower reaction speed. As suggested by the author, for trend identification, we’ll use a long-term EMA. For the example provided here in Figures 3 and 4, we will use a 200-period EMA.
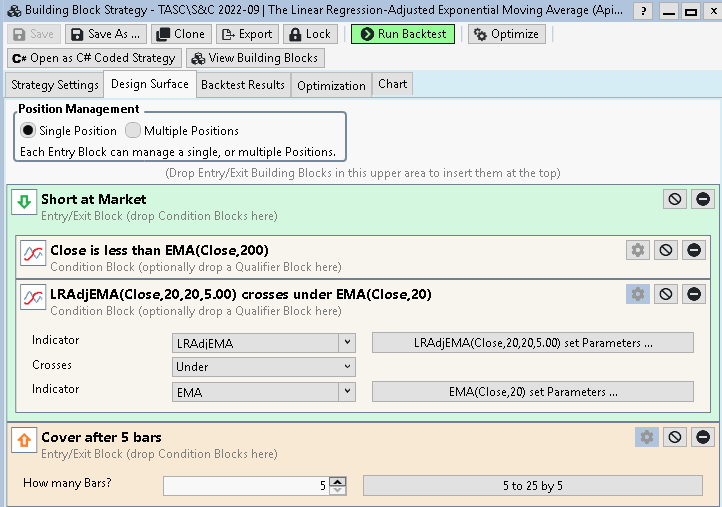
FIGURE 3: WEALTH-LAB. Shown here is an example of laying out the system’s rules by using the building blocks feature in Wealth-Lab 8.
Figure 3 shows an example of laying out the system’s rules in Wealth-Lab 8’s building blocks feature. In Figure 4, we show example signals from this system. This chart points to potential short trades that could take place when the faster LRAdjEMA crossed below the same-period EMA during the bear market that sparked in 2008.
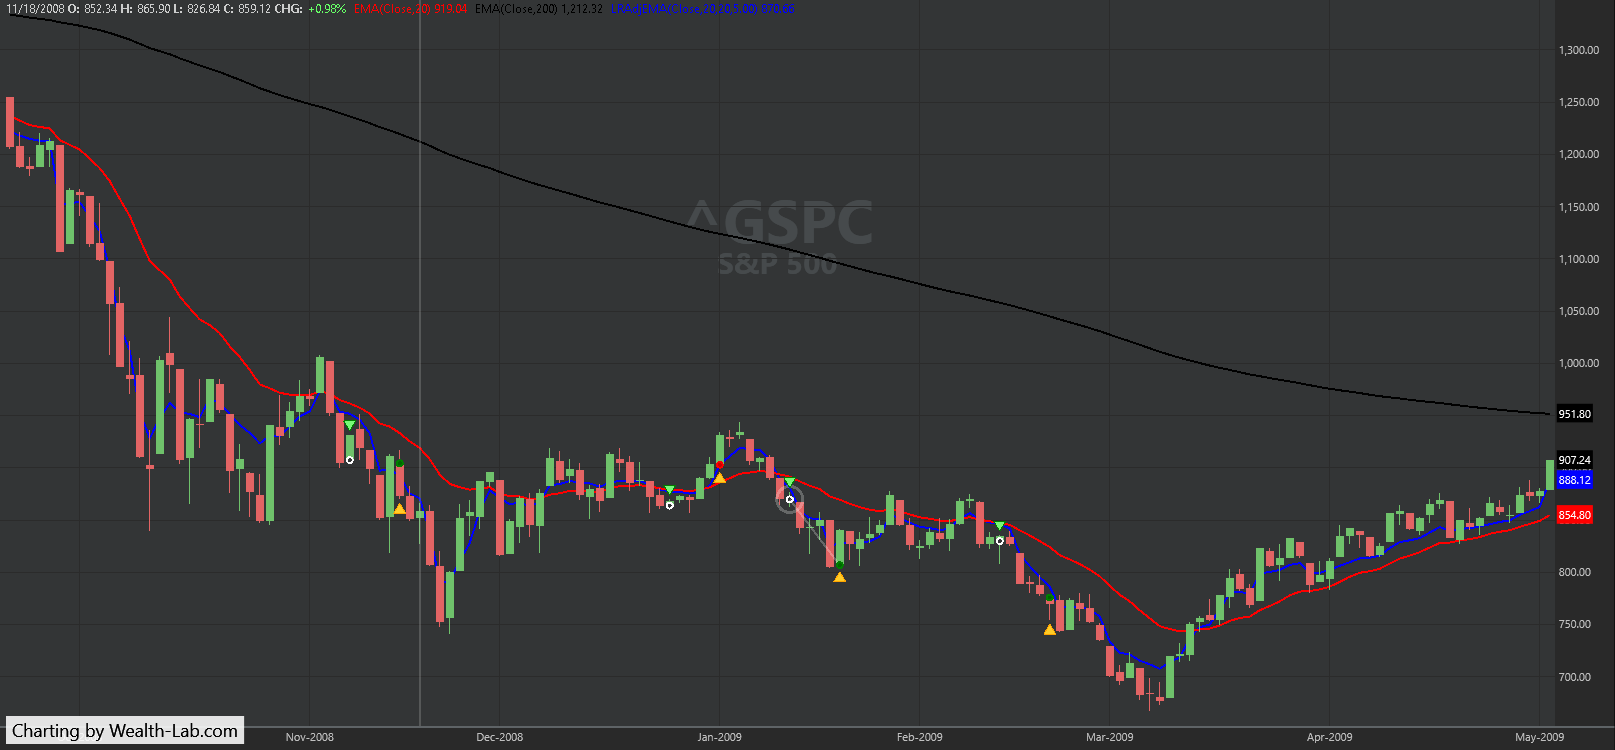
FIGURE 4: WEALTH-LAB. This chart shows example trade signals given by the demonstration system, applied to a chart of the S&P 500 index (^GSPC). In this example, the system’s signals point to potential short trades based on when the faster LRAdjEMA crosses below the same-period EMA during the 2008 bear market.
—Gene Geren (Eugene)
Wealth-Lab team
www.wealth-lab.com
BACK TO LIST

NinjaTrader: September 2022
The LRADJEMA indicator, as detailed in the August 2022 S&C article titled “The Linear Regression-Adjusted Exponential Moving Average” by Vitali Apirine, is available for download at the following links for NinjaTrader 8 and for NinjaTrader 7:
Once the file is downloaded, you can import the indicator into NinjaTader 8 from within the control center by selecting Tools → Import → NinjaScript Add-On and then selecting the downloaded file for NinjaTrader 8. To import into NinjaTrader 7, from within the control center window, select the menu File → Utilities → Import NinjaScript and select the downloaded file.
You can review the indicator’s source code in NinjaTrader 8 by selecting the menu New → NinjaScript Editor → Indicators from within the control center window and selecting the LRADJEMA file. You can review the indicator’s source code in NinjaTrader 7 by selecting the menu Tools → Edit NinjaScript → Indicator from within the control center window and selecting the LRADJEMA file.
A sample chart displaying the indicator is shown in Figure 5.
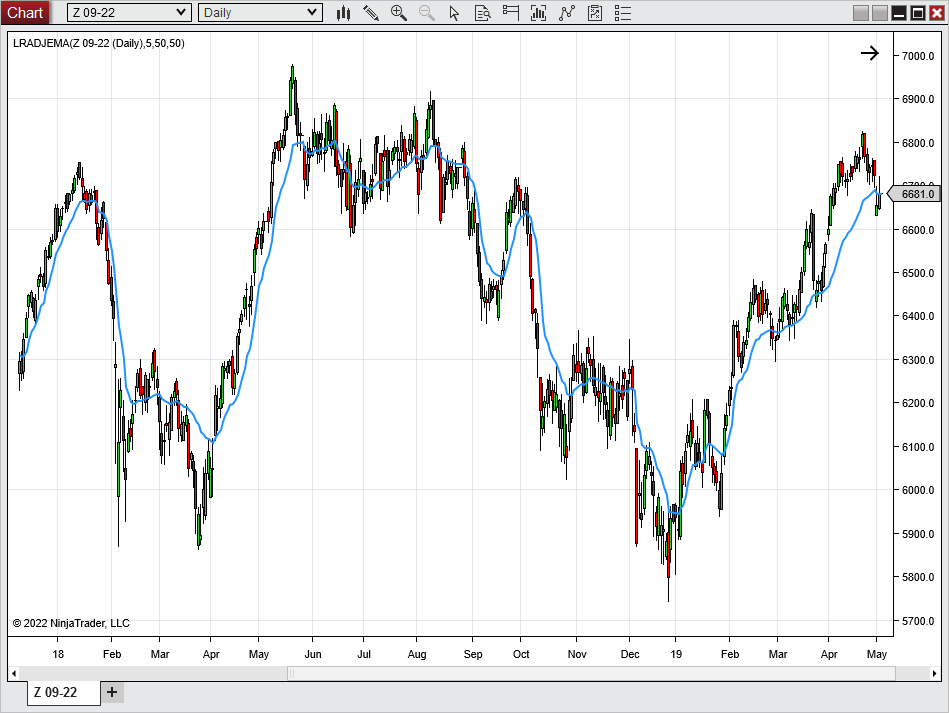
FIGURE 5: NINJATRADER. The LRADJEMA(50,50,5) indicator is applied to the FTSE 100 index futures from December 2017 to May 2019.
NinjaScript uses compiled DLLs that run native, not interpreted, to provide you with the highest performance possible.
—Brandon Haulk
NinjaTrader, LLC
www.ninjatrader.com
BACK TO LIST

Neuroshell Trader: September 2022
The linear regression-adjusted exponential moving average introduced by Vitali Apirine in his article last month in the August 2022 issue can be easily implemented in NeuroShell Trader by combining some of NeuroShell Trader’s 800+ indicators. To implement the indicator, select “new indicator” from the insert menu and use the indicator wizard to create the following indicators:
LR:  Sub(LinTimeReg PredValue(Close,50,0),Close)
MLTP2:  Mul3(3,SimpleStoch%K(LR, 50),0.01)
RATE:  Mul2(Divide(2,Add2(1,51)),Add2(1, MLTP2))
LRAdj EMA:  DynamicExpAvg (Close, RATE )
A sample chart is shown in Figure 6.
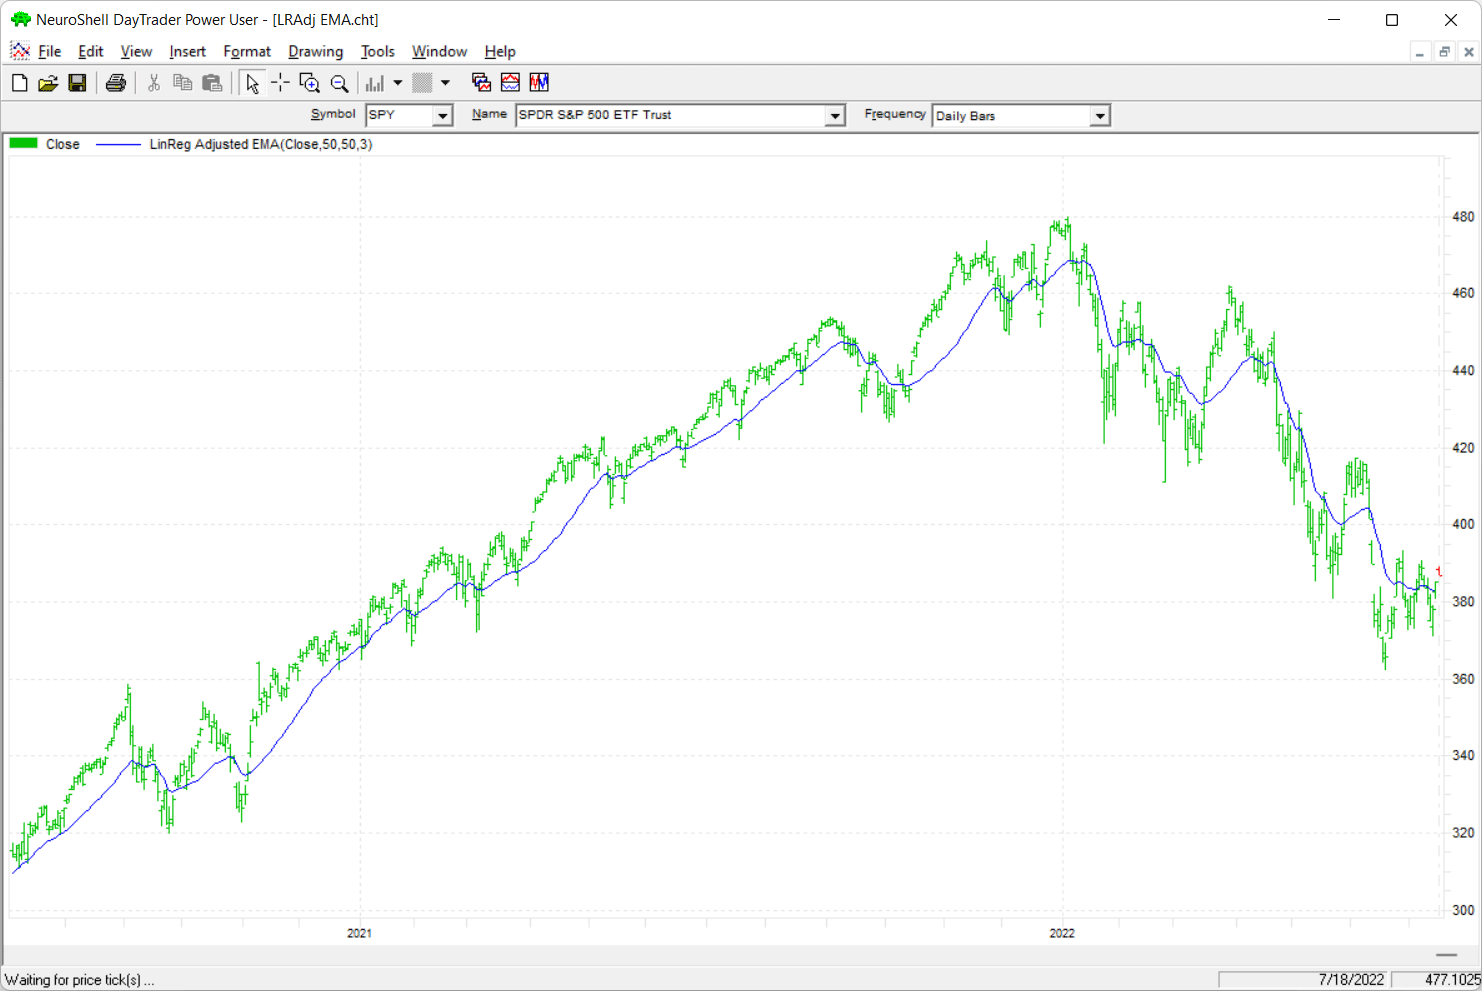
FIGURE 6: NEUROSHELL TRADER. This NeuroShell Trader chart demonstrates the linear regression-adjusted exponential moving average on the SPY.
Users of NeuroShell Trader can go to the Stocks & Commodities section of the NeuroShell Trader free technical support website to download a copy of this or any previous Traders’ Tips. Note that the DynamicExpAvg is a dynamic rate exponential moving average custom indicator available for download on the free technical support website with this Traders’ Tip.
—Ward Systems Group, Inc.
sales@wardsystems.com
www.neuroshell.com
BACK TO LIST

AIQ: September 2022
The importable AIQ EDS file based on Vitali Apirine’s article in the August 2022 issue, “The Linear Regression-Adjusted Exponential Moving Average,” can be obtained on request via email to info@TradersEdgeSystems.com. The code is also shown below.
Code for the author’s indicator is set up in the AIQ EDS code file. Figure 7 shows a comparison of the EMA(50) versus the LRA_EMA on a chart of AAPL.
! Linear Regresssion Adjusted Exponential Moving Average
! Author: Vitali Apirine, TASC September 2022
! Coded by: Richard Denning, 7/19/2022

Periods is 50.
Pds is 50.
Mltp is 3.
C is [close].
Mltp1 is 2/(Periods+1).

NN is Periods.  ! THIS DETERMINES THE END POINT OF THE LR LINE
YY is C.            ! AN INDICATOR OR OTHER UDF CAN BE USED HERE
b is slope2(YY,NN).
intercept is sum(YY,NN)/NN - (b * (NN + 1) / 2).
LR is intercept + (NN*b).                      !LinearReg(C,Pds).
Dist is Abs(LR-C).
ST is (Dist-LOWRESULT(Dist,PDS))/
         (HIGHRESULT(Dist,PDS)-LOWRESULT(Dist,PDS)).
Mltp2 is ST*Mltp.
Rate is Mltp1*(1+Mltp2).

HD if hasdatafor(Periods*2+1) > Periods*2.
DaysInto is ReportDate() - RuleDate().
Stop if DaysInto > 20.
stopesa is iff(stop,C,LRA_EMA).
!myesa is alpha * [close] + beta * valresult( stopesa, 1 ).

LRA_EMA is iff(HD,valresult(stopesa,1)+Rate*(C-valresult(stopesa,1)),C).
!If(Cum(1)=Periods*2,C,PREV+Rate*(C-PREV)).

ListValues if 1.
EMAp is expavg(C,Periods).
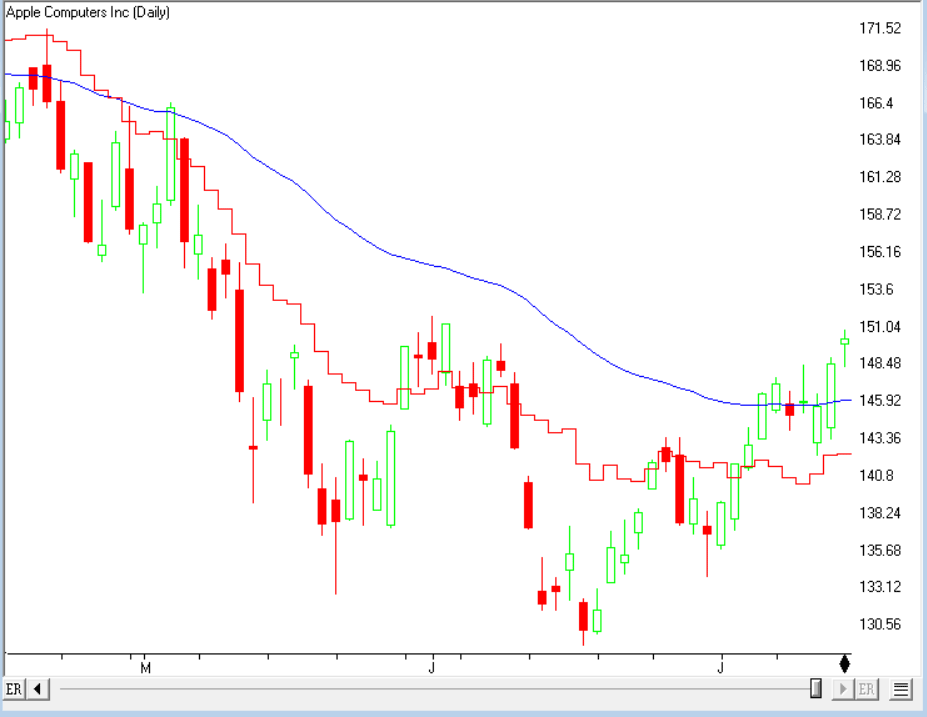
FIGURE 7: AIQ. Shown here is an exponential moving average (EMA) of the close over 50 bars (smooth line) compared to the LRA_EMA(50,50,3) jagged line on a chart of Apple Inc. (AAPL).
—Richard Denning
info@TradersEdgeSystems.com
for AIQ Systems
BACK TO LIST

The Zorro Project: September 2022
In his August 2022 S&C article, “The Linear Regression-Adjusted Exponential Moving Average,” Vitali Apirine introduces an EMA variant. It’s an EMA with a variable period derived from the distance of the current price and a linear regression line. The LR_EMA indicator can be converted from the MetaStock formula given in Apirine’s article to C code, as follows:
var LREMA(int Periods,int Pds,var Mltp)
{
  var Mltp1 = 2./(Periods+1);
  var LR = LinearReg(seriesC(),Pds);
  vars Dists = series(abs(LR-priceC()));
  var ST = (Dists[0]-MinVal(Dists,Pds))/
     max(MaxVal(Dists,Pds)-MinVal(Dists,Pds),0.01);
  var Rate = min(1.,Mltp1*(1+ST*Mltp));
  return EMA(priceC(),Rate);
}
The max and min functions prevent divisions by zero and EMA rates above 1. This can otherwise happen at the beginning of the backtest when price series are still flat.
In Figure 8, we show the LREMA(20,20,5) and EMA(20) applied on a chart of SPY, which replicates the chart in Apirine’s article. In the chart, we can see that the LREMA (blue line) follows the price more closely than the EMA (red line). That is not surprising given that the LREMA period is almost always smaller.
FIGURE 8: ZORRO PROJECT. The LREMA(20,20,5) and EMA(20) is applied on a chart of SPY. This replicates the chart in Vitali Apirine’s August 2022 S&C article. The LREMA (blue line) follows the price more closely than the EMA (red line).
For testing how the LREMA may identify trend changes, we can write a simple system, which we are making available to users as a download. This system will give trade signals concurrently from both the EMA and LREMA. A single position is entered when the faster EMA crosses over a slower EMA, and the position is closed when it crosses back. The LREMA is used likewise. So as not to compare apples with oranges, we optimize all time periods and test with walk-forward analysis. The code of this trading system in C is as follows:
void run()
{
	BarPeriod = 1440;
	LookBack = 200;
	StartDate = 2005;
	EndDate = 2022;
	assetList("AssetsIB");
	asset("SPY");
// walk-forward optimization setup
	set(PARAMETERS,TESTNOW,PLOTNOW);
	NumWFOCycles = 8;
// run a loop over the two algos
	while(algo(loop("LR_EMA","EMA")))
{
		vars Signals1, Signals2;
		int Color;
// optimize time periods
		int Period1 = optimize(20,10,50,10);
		int Period2 = Period1*optimize(2.5,1.5,3,0.5);
		if(Algo == "LR_EMA") {
			Signals1 = series(LREMA(Period1,Period1,5));
			Signals2 = series(LREMA(Period2,Period2,5));
			Color = BLUE;
		} else if(Algo == "EMA") {
			Signals1 = series(EMA(seriesC(),Period1));
			Signals2 = series(EMA(seriesC(),Period2));
			Color = GREY;
		}
// trade on fast/slow crossovers
		if(crossOver(Signals1,Signals2)) enterLong();
		if(crossUnder(Signals1,Signals2)) exitLong();
// plot equity curve
		plot(Algo,ProfitOpen+ProfitClosed,LINE+AXIS2,Color);
	}
}
The fast and slow periods are optimized separately for both algorithms. The slow period is the fast period multiplied by a factor. This guarantees that the slow period is always bigger than the fast period during the optimization. The system is trained by clicking the [train] button on the Zorro panel, then a backtest is automatically started. Training and test take about two seconds. The resulting equity curve is plotted in a blue line for the LR_EMA algo, and in a gray line for the standard EMA algo (Figure 9).
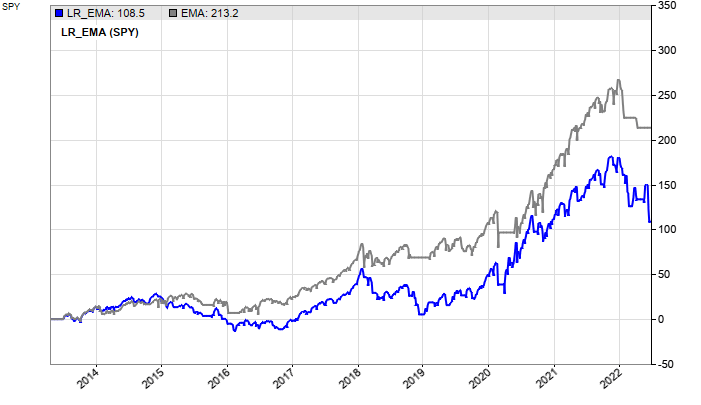
FIGURE 9: ZORRO PROJECT. In Zorro, you can test and train an algorithm quickly by clicking the [train] button on the Zorro panel, and then a backtest is automatically started. A resulting equity curve can then be plotted. Here, example equity curves are shown for the LR_EMA algo (in blue) and in gray for the standard EMA algo.
We can see that both algorithms yield a positive result, with the standard EMA a bit more so than the LR_EMA. A possible reason is the optimization of periods, which is more effective on the fixed-period EMA than on the variable-period LR_EMA. It’s possible the LR_EMA fares better with unoptimized systems or different assets.
The LREMA indicator and the EMA/LREMA trading system can be downloaded from the 2022 script repository on https://financial-hacker.com. The Zorro software for C/C++ algo trading can be downloaded from https://zorro-project.com.
—Petra Volkova
The Zorro Project by oP group Germany
https://zorro-project.com
BACK TO LIST
Microsoft Excel: September 2022
In his article in the August 2022 issue, Vitali Apirine introduces the LRAdjEMA indicator in his article titled “The Linear Regression-Adjusted Exponential Moving Average.”
This use of the linear regression value at each bar to modify the EMA coefficient used at each bar results in an indicator that tracks the price action more closely than either the bare EMA or the bare linear regression values of similar lookback settings (Figure 10).
FIGURE 10: EXCEL. This shows a comparison of EMA(50), LinReg(50), and the LRAdjEMA(50,50,5), similar to the chart in Figure 1 in Vitali Apirine’s August 2022 S&C article.
This is one where you really need to play with the user control value lengths and then mix and contrast the four indicators to get a good feel for the impacts.
To download this spreadsheet: The spreadsheet file for this Traders’ Tip can be downloaded here. To successfully download it, follow these steps:
- Right-click on the Excel file link, then
- Select “save as” (or “save target as”) to place a copy of the spreadsheet file on your hard drive.
—Ron McAllister
Excel and VBA programmer
rpmac_xltt@sprynet.com
BACK TO LIST

TradingView: September 2022
This is the TradingView Pine Script code implementing the LRAdj EMA indicator described in the August issue's article "The Linear Regression-Adjusted Exponential Moving Average" by Vitali Apirine:
//  TASC Issue: September 2022 - Vol. 40, Issue 10
//     Article: The Linear Regression-Adjusted
//              Exponential Moving Average - The LRAdj EMA
//  Article By: Vitali Apirine
//    Language: TradingView's Pine Script™ v5
// Provided By: PineCoders, for tradingview.com

//@version=5
indicator(title='TASC 2022.09 The LRAdj EMA', overlay=true)

LRAdjEMA (
  float source = close,
  int  Periods = 10,
  int      Pds = 10,
  float   Mltp = 3.0
  ) =>
    int     pds = math.max(1, Pds)
    float Mltp1 = 2.0 / math.max(1, Periods + 1.0)
    float    LR = ta.linreg(source, pds, 0)
    float  Dist = math.abs(LR - source)
    float   LLV = ta.lowest(Dist, pds)
    float   HHV = ta.highest(Dist, pds)
    float LRAdj = (Dist - LLV) / nz(HHV - LLV, 1.0e-307)
    float Mltp2 = LRAdj * Mltp
    float  Rate = Mltp1 * (1.0 + Mltp2)

    float LRAdjma = na
    if bar_index > math.max(Periods, pds)
        float prev = nz(LRAdjma[1], source)
        LRAdjma := prev + Rate * (source - prev)
    LRAdjma

int Periods = input.int(50,           'EMA Length:')
int     Pds = input.int(50,   'LR Lookback Period:')
float  Mltp = input.float(5.0,        'Multiplier:')

ma = LRAdjEMA(close, Periods, Pds, Mltp)
plot(ma, color=color.blue)
The indicator is available on TradingView from the PineCodersTASC account:
https://www.tradingview.com/u/PineCodersTASC/#published-scripts.
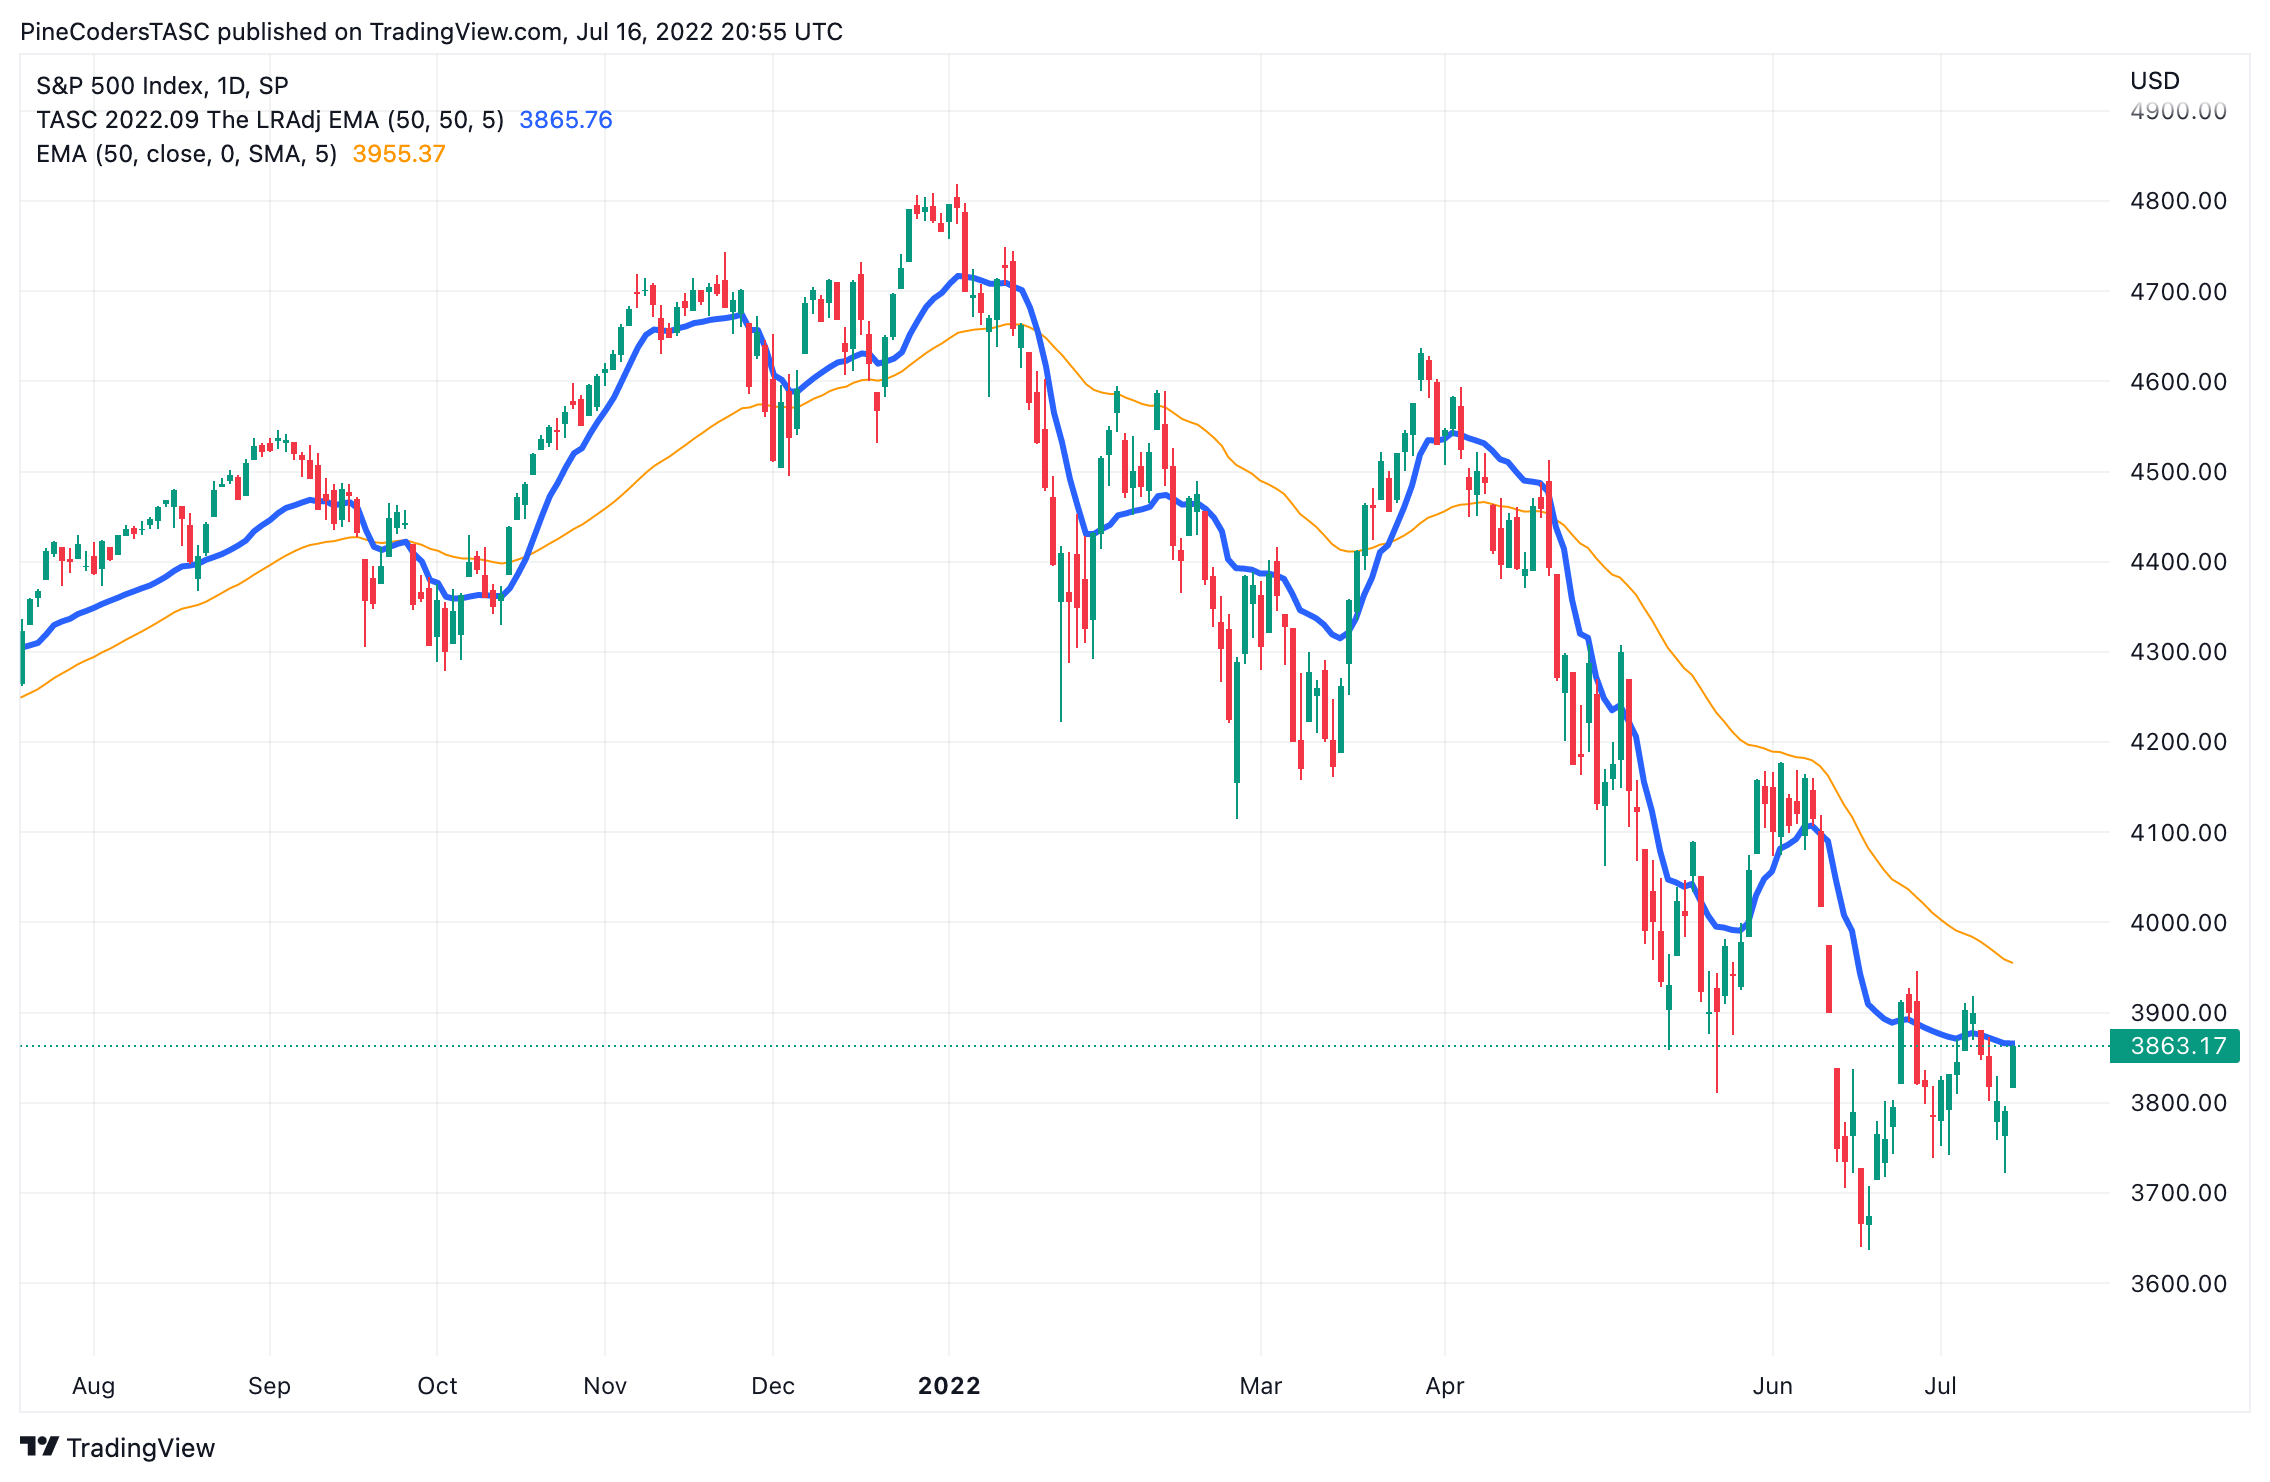
FIGURE 11: TRADINGVIEW
—PineCoders, for TradingView
www.TradingView.com
BACK TO LIST
Originally published in the September 2022 issue of
Technical Analysis of STOCKS & COMMODITIES magazine.
All rights reserved. © Copyright 2022, Technical Analysis, Inc.