TRADERS’ TIPS
October 2022

For this month’s Traders’ Tips, the focus is Vitali Apirine’s article in the February 2022 issue, “Relative Strength Moving Averages, Part 2 (RS VA EMA).” Here, we present the October 2022 Traders’ Tips code with possible implementations in various software.
You can right-click on any chart to open it in a new tab or window and view it at it’s originally supplied size, often much larger than the version printed in the magazine.
The Traders’ Tips section is provided to help the reader implement a selected technique from an article in this issue or another recent issue. The entries here are contributed by software developers or programmers for software that is capable of customization.

TradeStation: October 2022
Vitali Apirine’s 2022 three-part article series examines moving averages based on relative strength. The indicators he presents are designed to reduce the lag of traditional EMAs, making them more responsive. In part 2 of his article series, which appeared in the February 2022 issue of S&C, he explores the relative strength volume-adjusted exponential moving average (RS VA EMA).
The indicator is designed to account for relative strength of volume and as part of the calculation incorporates a measurement between the positive and negative volume flow. Volume is considered positive when the close is above the prior close and considered negative when the close is below the prior close. The indicator can be used to help establish trends and define turning points. It is important to note that when using the EasyLanguage function code given here, it should be configured as a series function in the general tab of the function’s properties window.
Series Function: RSVAEMA
// TASC OCT 2022
// RSVAEMA - Relative Strength Volume-Adjusted
// Exponential Moving Average (RS VA EMA)
// Series Function
// 2022 Vitali Apirine

inputs:
	Periods( NumericSimple ),
	Pds( NumericSimple ),
	Mltp( NumericSimple );

variables:
	Mltp1( 0 ),
	Vup( 0 ),
	Vdwn( 0 ),
	RS( 0 ),
	Rate( 0 ),
	MyVol( 0 );

Mltp1 = 2 / (Periods + 1);

{ Daily, Weekly, or Monthly bars }
if BarType >= 2 and BarType < 5 then
	MyVol = Volume
else
	MyVol = Ticks;

Vup = IFF(Close > Close[1], MyVol, 0);
Vdwn = IFF(Close < Close[1], MyVol, 0);

RS = AbsValue( XAverage(Vup, Pds) -
XAverage(Vdwn, Pds)) / (XAverage(Vup, Pds) +
XAverage(Vdwn, Pds) + 0.00001);

RS = RS * Mltp;
Rate = Mltp1 * (1 + RS);

if CurrentBar = 1 then
	RSVAEMA = Close
else
	RSVAEMA = RSVAEMA[1] + Rate *
	 (Close - RSVAEMA[1]);


Indicator: TASC OCT 2022 RS VA EMA
// TASC OCT 2022
// RSVAEMA - Relative Strength Volume-Adjusted
// Exponential Moving Average (RS VA EMA)
// 2022 Vitali Apirine

inputs:
	Periods( 10 ),
	Pds( 10 ),
	Mltp( 10 );

variables:
	RSVAEMAValue( 0 );

RSVAEMAValue = RSVAEMA( Periods, Pds, Mltp );

Plot1( RSVAEMAValue, "RS VA EMA" );
A sample chart is shown in Figure 1.

FIGURE 1: TRADESTATION. This shows a TradeStation daily chart of the S&P 500 ETF SPY with the indicator (blue) applied and an exponential moving average (red). The RS VA EMA indicator uses inputs 20, 20, 20 and the exponential average uses a length of 20.
This article is for informational purposes. No type of trading or investment recommendation, advice, or strategy is being made, given, or in any manner provided by TradeStation Securities or its affiliates.
—John Robinson
TradeStation Securities, Inc.
www.TradeStation.com
BACK TO LIST

thinkorswim: October 2022
We put together a study based on an article by Vitali Apirine on the relative strength volume-adjusted exponential moving average (the RS VA EMA), which appeared in the February 2022 issue of S&C as part of a series. We built the strategy referenced by using our proprietary scripting language, thinkscript. To ease the loading process, simply click https://tos.mx/ffByDgy or enter it into the address into setup → open shared item from within thinkorswim, then choose view thinkScript study and name it “RS_VA_EMA” or whatever you like and can identify. You can then add the strategy to your charts from the edit studies menu from within the charts tab and then selecting studies.
The chart in Figure 2 shows our version of Figure 3 from the original article. Please see the article by Vitali Apirine for more information on how to utilize the study.

FIGURE 2: THINKORSWIM. This chart replicates the chart in Figure 3 of Apirine’s article.
—thinkorswim
A division of TD Ameritrade, Inc.
www.thinkorswim.com
BACK TO LIST

Wealth-Lab.com: October 2022
The RS VA EMA, introduced by Vitali Apirine in his February 2022 S&C article, is a trend-following indicator interpreted in a similar way to the EMAs, but responds more quickly than other lagging indicators. Its speed of response can cause whipsaws. Here is a simple trick to avoid that undesirable effect when designing trend-following systems.
Rather than rely on a crossover or crossunder, we can require the close price to stay X consecutive closes above or below the RS VA EMA to determine that the trend has changed. In our example system, we break this variable into two for better precision: A long entry is triggered after X consecutive closes above the MA and a long exit is performed after the close price drops below the MA for Y consecutive bars.
In this example, the entry is relaxed by requiring only two consecutive closes above the MA whereas the system will wait for five consecutive closes below the MA for the exit to trigger. It lets profits run but a downside is the delay of an exit if the market starts moving against your position strongly.
Figure 3 shows setting up the rules in Wealth-Lab’s Building Blocks feature and Figure 4 shows the indicator on a chart of SPY.
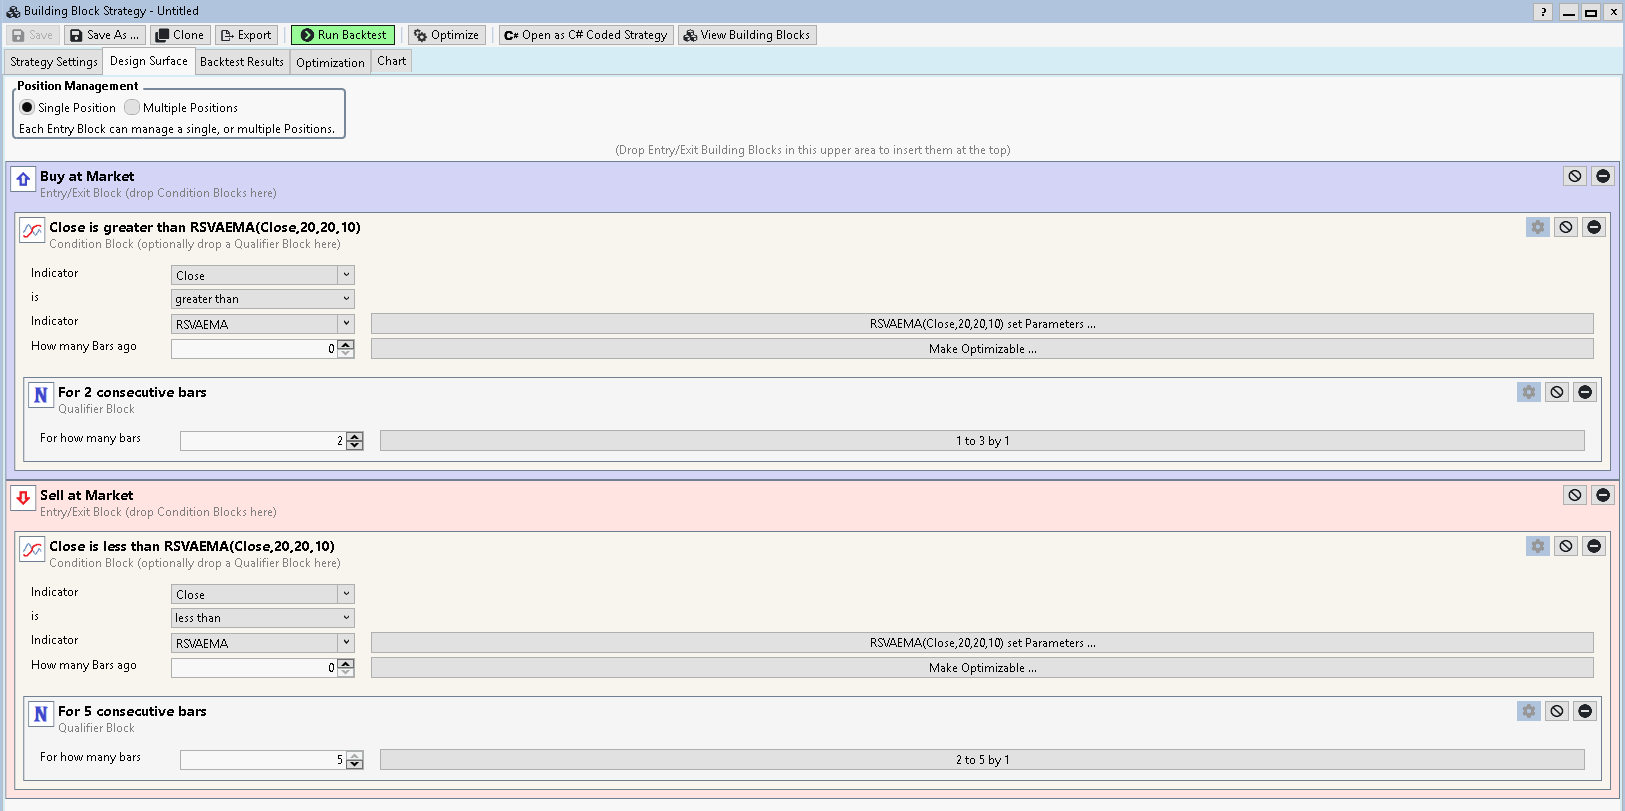
FIGURE 3: WEALTH-LAB. This shows an example of laying out the system’s rules in the Building Blocks feature of Wealth-Lab 8.
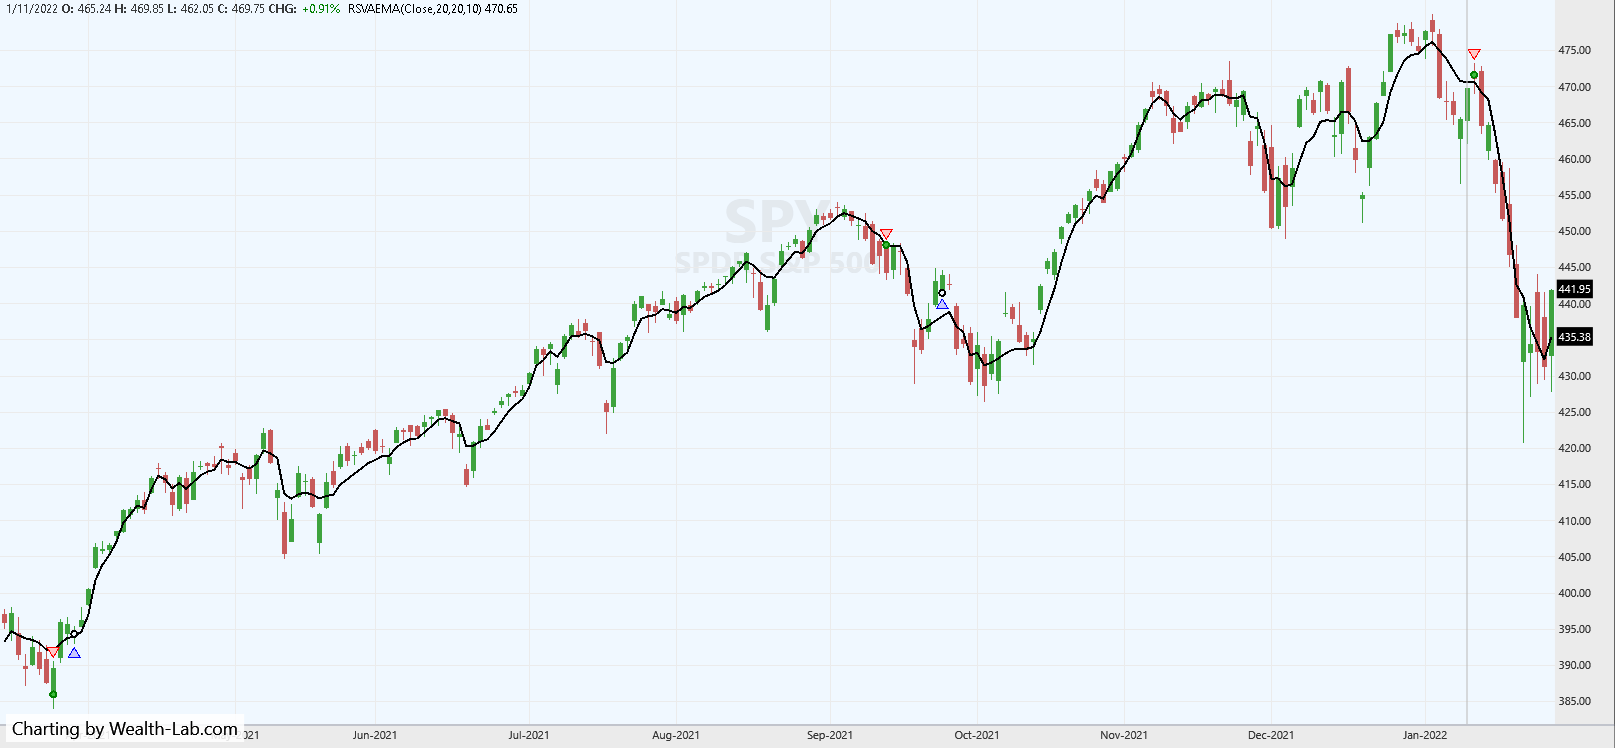
FIGURE 4: WEALTH-LAB. This demonstrates some trades taken by the system applied to a chart of the SPY.
The RSVAEMA has been added to Wealth-Lab 8 which makes it available to any tools and extensions automatically.
—Gene Geren (Eugene)
Wealth-Lab team
www.wealth-lab.com
BACK TO LIST

NinjaTrader: October 2022
The relative strength volume-adjusted exponential moving average (the RS VA EMA), as detailed in a February 2022 S&C article by Vitali Apirine, is available for download at the following links for NinjaTrader 8 and for NinjaTrader 7:
Once the file is downloaded, you can import the indicator into NinjaTrader 8 from within the control center by selecting Tools → Import → NinjaScript Add-On and then selecting the downloaded file for NinjaTrader 8. To import into NinjaTrader 7, from within the control center window, select the menu File → Utilities → Import NinjaScript and select the downloaded file.
You can review the indicator source code in NinjaTrader 8 by selecting the menu New → NinjaScript Editor → Indicators folder from within the control center window and selecting the RSVAEMA file. You can review the indicator’s source code in NinjaTrader 7 by selecting the menu Tools → Edit NinjaScript → Indicator from within the control center window and selecting the RSVAEMA file.
NinjaScript uses compiled DLLs that run native, not interpreted, which provides you with the highest performance possible.
A sample chart displaying the indicator is shown in Figure 5.

FIGURE 5: NINJATRADER. The RSVAEMA (10, 50, 50) indicator (green) and a 20-period EMA (blue) are displayed on a daily chart of the DJIA from September 2018 to April 2019.
—Emily Christoph
NinjaTrader, LLC
www.ninjatrader.com
BACK TO LIST

TradingView: October 2022
Here is the TradingView Pine Script code implementing the relative strength volume-adjusted exponential moving average (RS VA EMA) described by Vitali Apirine in his article in the February 2022 issue of S&C.
//  TASC Issue: October 2022 - Vol. 40, Issue 11
//     Article: Relative Strength Moving Averages
//              Part 2: The Relative Strength Volume-Adjusted
//              Exponential Moving Average (RS VA EMA)
//  Article By: Vitali Apirine
//    Language: TradingView's Pine Script v5
// Provided By: PineCoders, for tradingview.com

//@version=5
indicator('TASC 2022.10 RS VA EMA', overlay=true)

float   src = input.source(close,  'Source:')
int periods = input.int(10,    'EMA Length:', minval=1)
int     pds = input.int(10,     'VS Length:', minval=1)
float  mltp = input.int(10, 'VS Multiplier:', minval=0)

rsvaema(float    source = close,
  simple int  emaPeriod = 50,
  simple int   vsPeriod = 50,
       float multiplier = 10.0
       ) =>
    var float mltp1 = 2.0 / (emaPeriod + 1.0)
    var float coef1 = 2.0 /  (vsPeriod + 1.0)
    var float coef2 = 1.0 - coef1
    float pv   = source > source[1] ? volume : 0.0
    float nv   = source < source[1] ? volume : 0.0
    float apv  = na, apv := coef1 * pv + coef2 * nz(apv[1])
    float anv  = na, anv := coef1 * nv + coef2 * nz(anv[1])
    float vs   = math.abs(apv - anv) / (apv + anv)
    float rate = mltp1 * (1.0 + nz(vs, 0.00001) * multiplier)
    float rsma = na
    rsma := rate * source + (1.0 - rate) * nz(rsma[1],source)
    rsma

float rsvaema = rsvaema(src, periods, pds, mltp)

plot(rsvaema, title='RS VA EMA', color=#B21BD8, linewidth=2)
The indicator is available on TradingView in the PineCodersTASC account: https://www.tradingview.com/u/PineCodersTASC/#published-scripts
An example chart is shown in Figure 6.
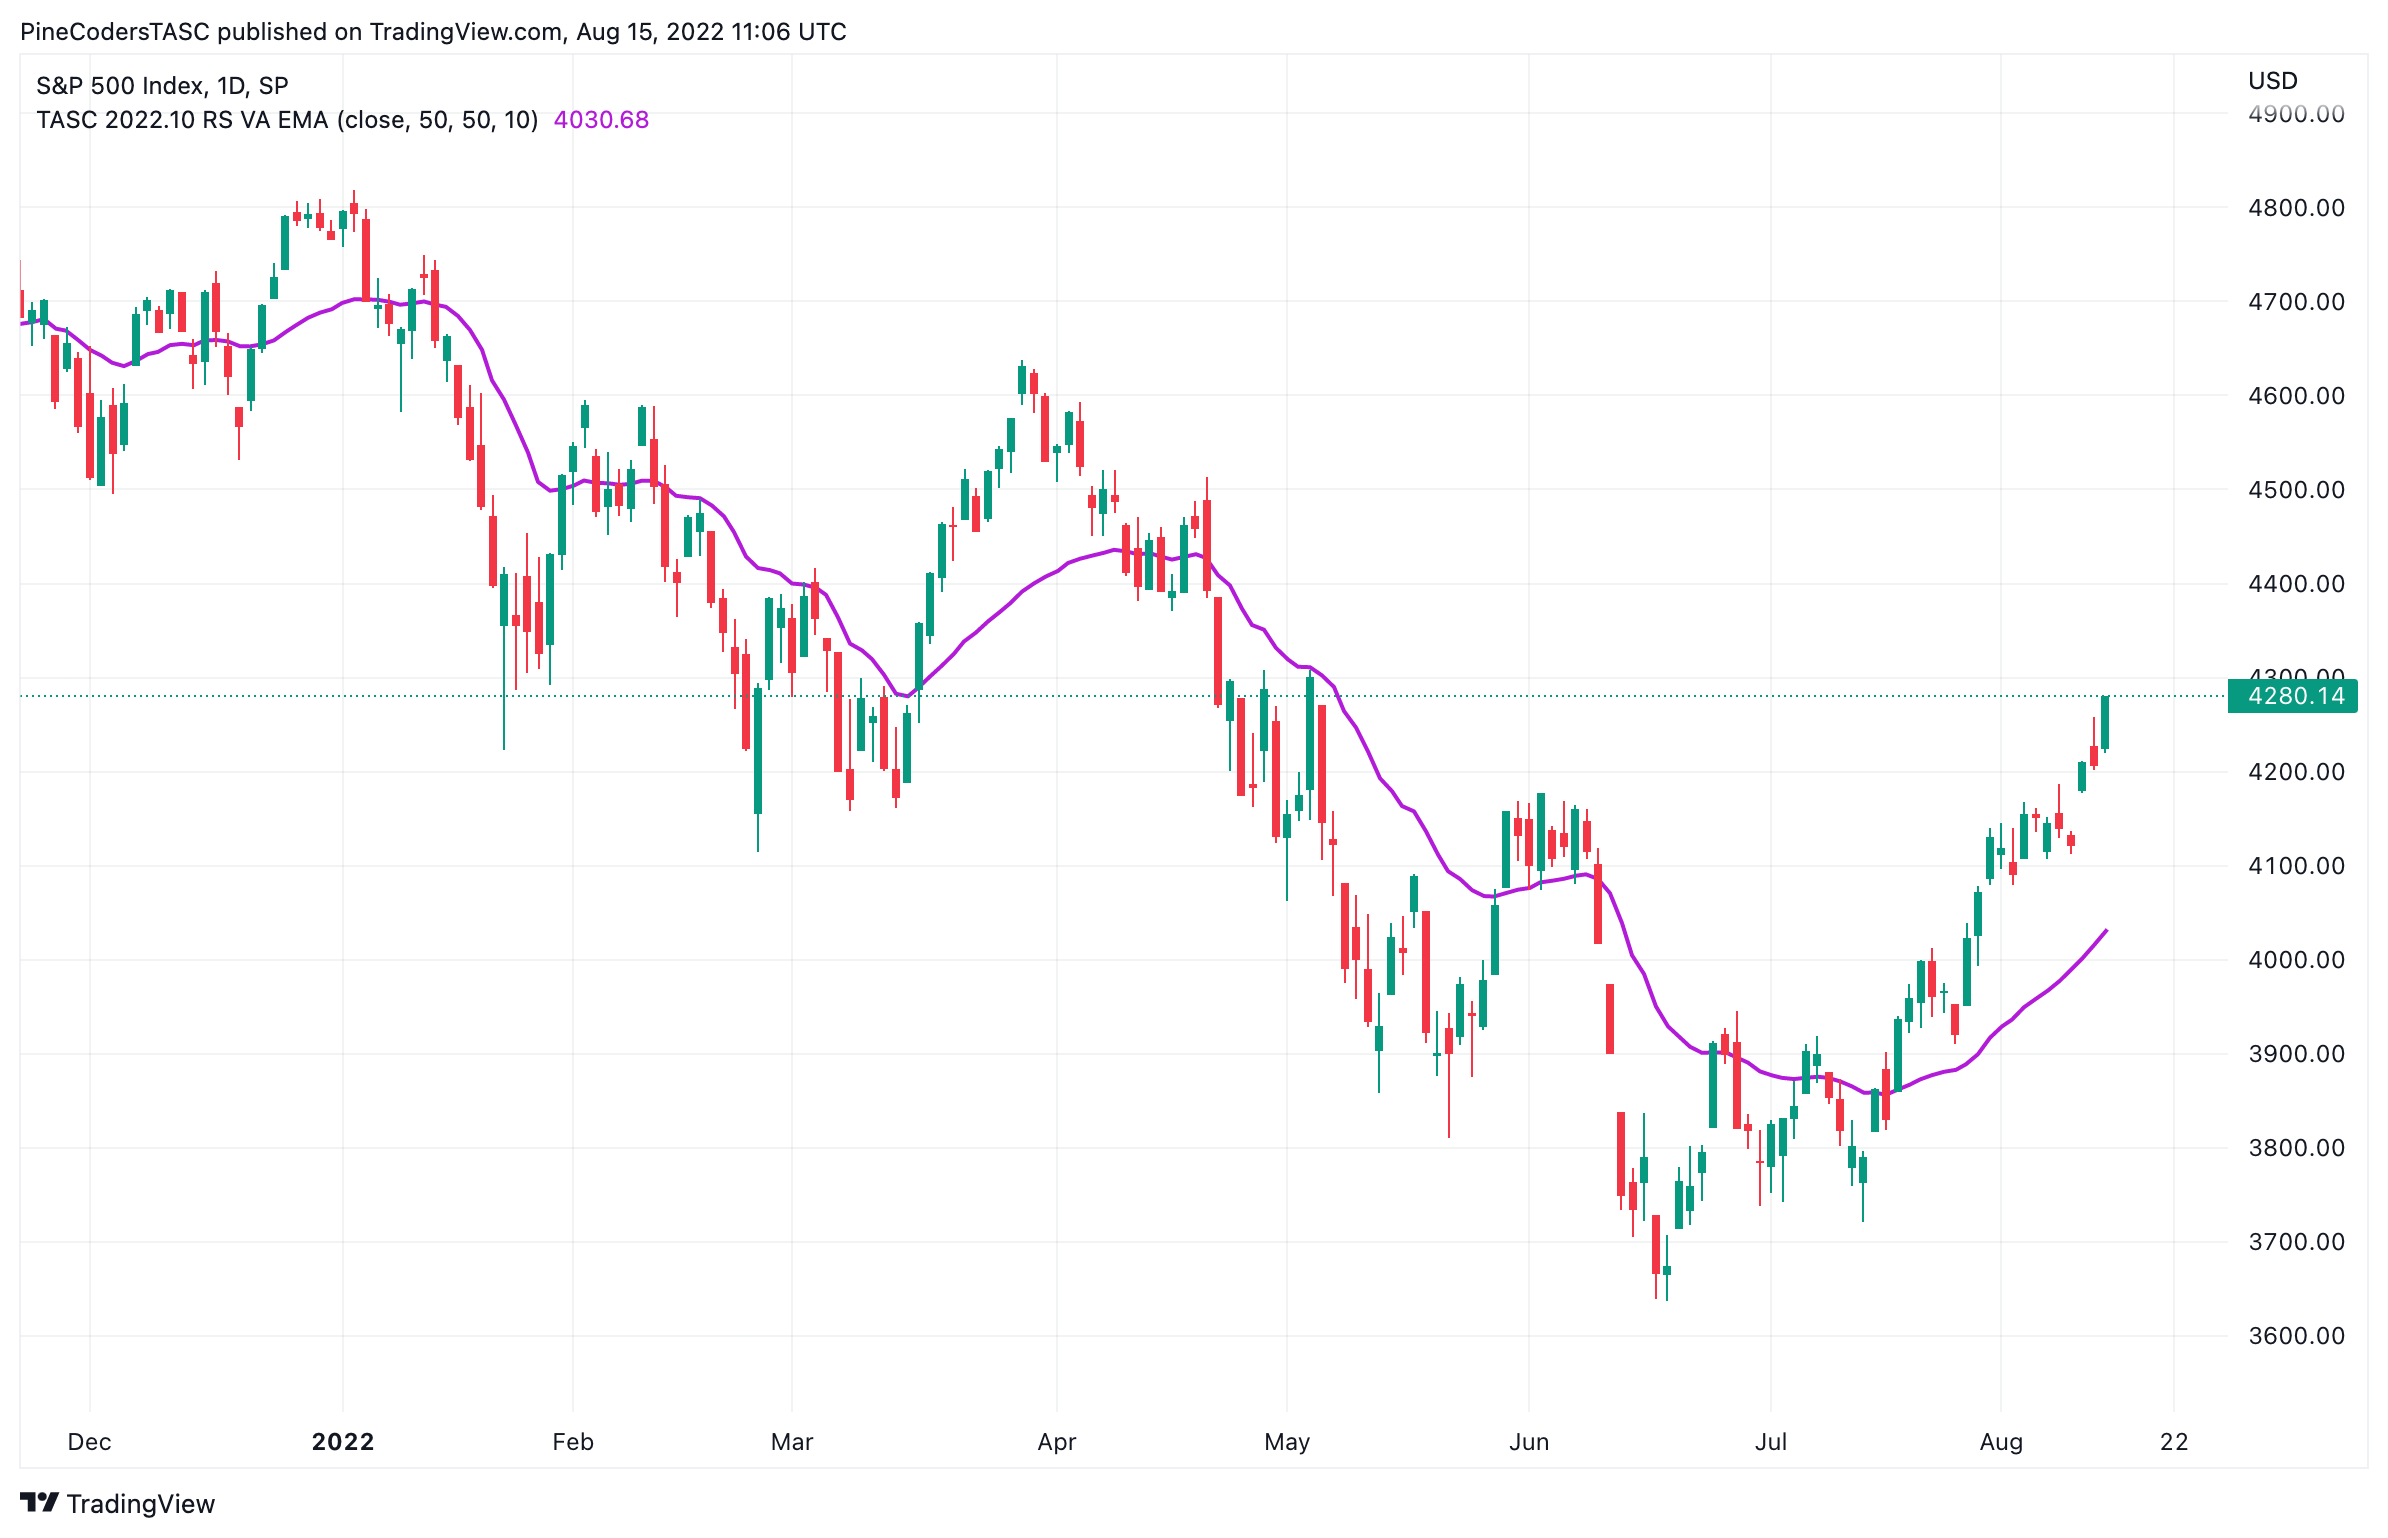
FIGURE 6: TRADINGVIEW. The relative strength volume-adjusted exponential moving average (RS VA EMA) is shown on a chart of the SPX.
—PineCoders, for TradingView
www.TradingView.com
BACK TO LIST

Neuroshell Trader: October 2022
The relative strength volume-adjusted exponential moving average (RS VA EMA), as introduced by Vitali Apirine in his February 2022 article in S&C, can be easily implemented in NeuroShell Trader by combining some of NeuroShell Trader’s 800+ indicators. To implement the indicators, select new indicator from the insert menu and use the indicator wizard to create the following indicators:
VUEMA:	ExpAvg( IfThenElse( A>B( Momentum(Close, 1), 0 ), Volume, 0 ), 10)
VDEMA:	ExpAvg( IfThenElse( A<B( Momentum(Close, 1), 0 ), Volume, 0 ), 10)
RS:		Divide( Abs( Subtract(VUEMA, VDEMA) ), Add3(VUEMA, VDEMA, 0.00001) )
RATE:	Multiply2( Divide( 2, Add2(10, 1) ), Add2(1, Multiply(RS, 10) ) )
RSVAEMA:	DynamicExpAvg (Close, RATE )
The DynamicExpAvg is a dynamic rate exponential moving average custom indicator available for download on NeuroShell’s free technical support website with this Traders’ Tip. Users of NeuroShell Trader can go to the STOCKS & COMMODITIES section of the NeuroShell Trader free technical support website to download a copy of this or any previous Traders’ Tips.

FIGURE 7: NEUROSHELL TRADER. This NeuroShell Trader chart shows the relative strength volume-adjusted exponential moving average on the SPX.
—Ward Systems Group, Inc.
sales@wardsystems.com
www.neuroshell.com
BACK TO LIST

Optuma: October 2022
Here is the Optuma script formula for the relative strength volume-adjusted exponential moving average (RS VA EMA), which was introduced by Vitali Apirini in his February 2022 S&C article.
$Periods = 20;
$Pds = 20;
$MLTP = 10;
MLTP1 = 2 / (VarToList(VAL=$MLTP) + 1);
Vup = IF(Close() IsUp, VOL(), 0);
Vdwn = IF(Close() IsDown, VOL(), 0);
EMAVup = MA(Vup,CALC=Close, STYLE=Exponential, BARS=$Pds);
EMAVdwn = MA(Vdwn,CALC=Close, STYLE=Exponential, BARS=$Pds);
RS=ABS(EMAVup - EMAVdwn) / (EMAVup + EMAVdwn) + 0.00001;
RATE=MLTP1*(1+RS);
RSEVMA = RSEVMA[1] + RATE * (Close() - RSEVMA[1]);
RSEVMA
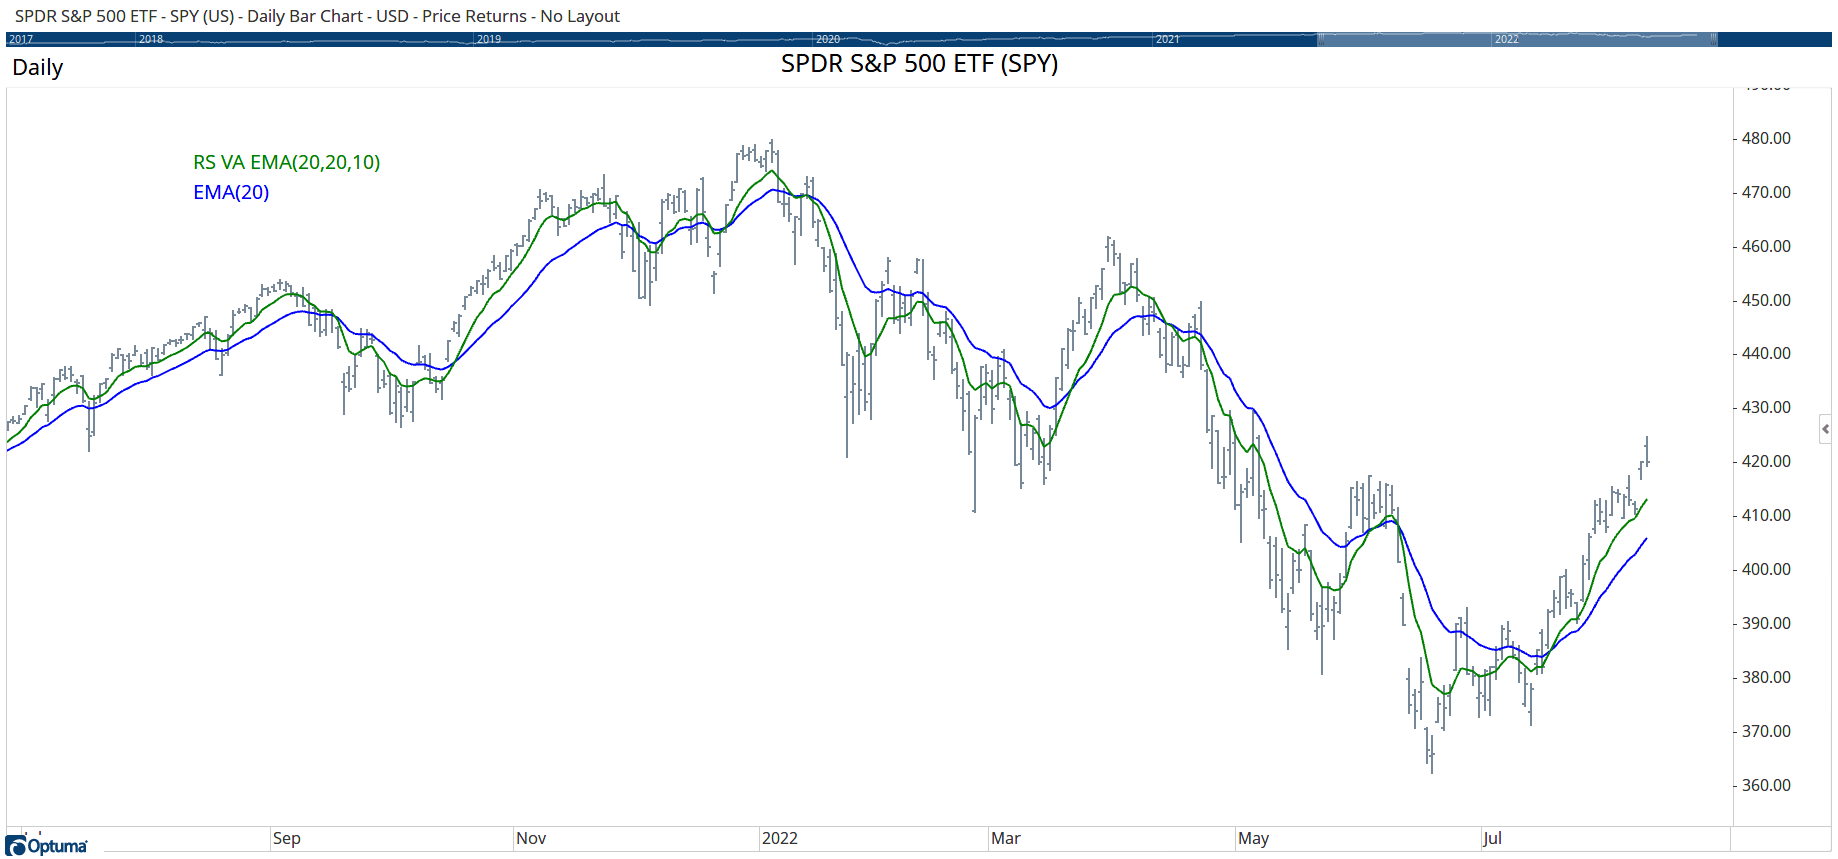
FIGURE 8: OPTUMA. This sample chart displays the relative strength volume-adjusted exponential moving average (RS VA EMA) on the SPY.
—support@optuma.com
BACK TO LIST

The Zorro Project: October 2022
In Vitali Apirine’s article on the relative strength volume-adjusted exponential moving average (RSEMA2) in the February 2022 issue, a volume-based RSI serves as an EMA time period. This requires only a small modification of the similar but volatility-based indicator from Apirine’s previous article.
Here is the MetaStock code given in the article converted to C:
var RSEMA2(int Periods, int PdsEMA, var Mltp)
{
	var Vup = ifelse(priceC(0) > priceC(1),marketVol(),0),
		Vdn = ifelse(priceC(0) < priceC(1),marketVol(),0);
	var EMAUp = EMA(Vup,Pds), EMADn = EMA(Vdn,Pds);
	var RS = abs(EMAUp-EMADn)/(EMAUp+EMADn+0.00001)*Mltp;
	var Rate = 2./(Periods+1)*(1+RS);
	return EMA(priceC(),Rate);
}
Figure 9 shows the RSEMA2(20,20,10) applied to a chart of the DJIA in comparison with EMA(20). We can see that the RSEMA2 (red) has noticeably less lag than the original EMA (blue). This is not surprising since its time period is modulated by the volume.
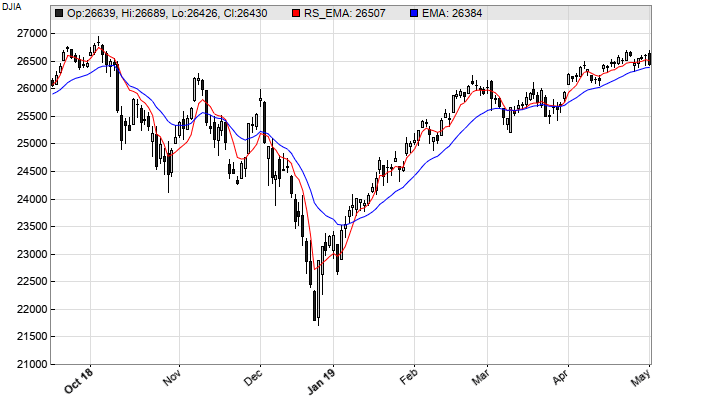
FIGURE 9: ZORRO PROJECT. The RSEMA2(20,20,10) is applied to a chart of the DJIA in comparison with EMA(20). The RSEMA2 (red) has noticeably less lag than the original EMA (blue).
The RSEMA2 indicator can be downloaded from the 2022 script repository on https://financial-hacker.com. The Zorro software can be downloaded from https://zorro-project.com.
—Petra Volkova
The Zorro Project by oP group Germany
https://zorro-project.com
BACK TO LIST

AIQ: October 2022
The importable AIQ EDS file based on Vitali Apirine’s article in the February 2022 issue titled “Relative Strength Volume-Adjusted Exponential Moving Average” can be obtained on request via email to info@TradersEdgeSystems.com. The code is also available here:
! Relative Strength Volume Adjusted Exponential Moving Average
! Author: Vitali Apirine, TASC October 2022
! Coded by: Richard Denning, 8/16/2022

Periods is 40.
Pds is 40.
Mltp is 10.
C is [close].
v IS [volume].
Mltp1 is 2/(Periods+1).
Vup is iff(C>valresult(C,1),V,0).
Vdwn is iff(C<valresult(C,1),V,0).
VupEma is expavg(Vup,Pds).
VdwnEma is expavg(Vdwn,Pds).
RS is abs(VupEma-VdwnEma)/(VupEma+VdwnEma+0.00001).
RS1 is RS*Mltp.
Rate is Mltp1*(1+RS1).
HD if hasdatafor(Periods*2+1) > Periods*2.
DaysInto is ReportDate() - RuleDate().
Stop if DaysInto > 50.
stopesa is iff(stop,C,RS_VA_EMA).
!myesa is alpha * [close] + beta * valresult( stopesa, 1 ).

RS_VA_EMA is iff(HD,valresult(stopesa,1)+Rate*(C-valresult(stopesa,1)),C).
!If(Cum(1)=Periods*2,C,PREV+Rate*(C-PREV)).
ListValues if 1.
EMAp is expavg(C,Periods).
Code for the author’s indicator is set up in the AIQ EDS code file. Figure 10 shows a comparison of the EMA(40) versus the RS_VA_EMA on a chart of SPY during three months of 2022.

FIGURE 10: AIQ. Here, the exponential moving average of close over 40 bars (smooth blue line) is compared to the RS_VA_EMA(40,40,10) (jagged red line) on SPY.
—Richard Denning
info@TradersEdgeSystems.com
for AIQ Systems
BACK TO LIST
Microsoft Excel: October 2022
This month we’ll explore the second article in a series by Vitali Apirine on relative strength moving averages. Here, we’ll look at the relative strength volume-adjusted exponential moving average (RsVaEMA), which he described in his February 2022 article.
The RsVaEMA indicator uses the volume at each bar to calculate a relative strength. That relative strength value is used to scale the coefficient used in the EMA calculation at each bar.
In the example charts that the author provided with the article, RsVaEMA values appear to track price action more closely than a standard EMA with less apparent lag.
The spreadsheet I am providing here is set up to allow up to two standard EMAs and up to two RsVaEMAs, each with their own specifications, so that users may mix and match as they explore.

FIGURE 11: EXCEL. This chart is an approximation in Excel of Figure 3 from Vitali Apirine’s article.
To download this spreadsheet: The spreadsheet file for this Traders’ Tip can be downloaded here. To successfully download it, follow these steps:
- Right-click on the Excel file link, then
- Select “save as” (or “save target as”) to place a copy of the spreadsheet file on your hard drive.
Note: The spreadsheet provided in the September 2022 issue contained an error that will interfere with data retrievals. For those willing to venture into the VBA editor, two simple fixes will bypass problem. Here are the steps:
- Open the spreadsheet but do not refresh prices.
- Open the VBA editor (ALT-F11—that is, hold down the ALT key and press the F11 key).
- Open VBA Find dialog (hold down the CTRL key and press the "F" key).
- Fill in the "Find what" box with: Call ButtonText1(
- In the search box, click the "Current project" button.
- Then click the "Find next" button. The target line will be highlighted in yellow.
- On the target line, place a single quote (') in front of the word "Call"
- In the "Find" dialog box, change the "Find what:" box to read: Call ButtonText2(
- Then click the "find next" button. The target line will be highlighted in yellow just a few lines down.
- On this target line, place a single quote (') in front of the word "Call"
- Close the VBA editor (the red X in the upper-right corner)
- Close the spreadsheet and "save changes" when prompted.
“Price refresh” or “download for a new symbol” should now work correctly for the September 2022 spreadsheet.
—Ron McAllister
Excel and VBA programmer
rpmac_xltt@sprynet.com
BACK TO LIST
Originally published in the October 2022 issue of
Technical Analysis of STOCKS & COMMODITIES magazine.
All rights reserved. © Copyright 2022, Technical Analysis, Inc.


