TRADERS’ TIPS
December 2022

For this month’s Traders’ Tips, the focus is Barbara Star’s article in this issue, “Short-Term Continuation And Reversal Signals.” Here, we present the December 2022 Traders’ Tips code with possible implementations in various software.
You can right-click on any chart to open it in a new tab or window and view it at it’s originally supplied size, often much larger than the version printed in the magazine.
The Traders’ Tips section is provided to help the reader implement a selected technique from an article in this issue or another recent issue. The entries here are contributed by software developers or programmers for software that is capable of customization.

TradeStation: December 2022
In her article in this issue, “Short-Term Continuation And Reversal Signals,” author Barbara Star describes modifications to the classic directional movement indicator (DMI) and commodity channel index (CCI) that can aid in more easily identifying price reversals and continuations in a trend. Traditionally, the DMI is comprised of two lines: a plus line (+DI) and negative line (−DI).
In her article, Star creates a DMI oscillator by subtracting −DI from +DI. Historically, the DMI uses a default length of 14. In the article, this has been shortened to 10. The CCI has also been adjusted in the article to use a length of 13 instead of the usual 14 or 20. The DMI oscillator PaintBar colors the price bars so they match the color of the DMI oscillator. Here, CCI reversal signals are plotted with crosses (plus signs) as opposed to the diamond shapes used by the author.
Indicator: DMI Oscillator
// TASC DEC 2022
// DMI Oscillator
// Barbara Star

inputs:
	DMILength( 10 ),
	DMIOscColor( DarkGray ),
	AboveZeroColor( DarkGreen ),
	BelowZeroColor( Red ),
	ZeroColor( DarkGray );

variables:
	ReturnValue( 0 ),
	oDMIPlus( 0 ),
	oDMIMinus( 0 ),
	oDMI( 0 ),
	oADX( 0 ),
	oADXR( 0 ),
	oVolty( 0 ),
	DMIOsc( 0 );

ReturnValue = DirMovement( High, Low, Close, DMILength,
 oDMIPlus, oDMIMinus, oDMI, oADX, oADXR, oVolty );
DMIOsc = oDMIPlus - oDMIMinus;

Plot1( DMIOsc, "DMI Osc" );

if DMIOsc > 0 then
	SetPlotColor(1, AboveZeroColor )
else if DMIOsc < 0 then
	SetPlotColor(1, BelowZeroColor )
else
	SetPlotColor(1, ZeroColor );

Plot2( DMIOsc, "DMI Osc", DMIOscColor );

Indicator: DMI Continuation Signals and CCI Reversal Signals
// TASC DEC 2022
// DMI Continuation Signals and CCI Reversal Signals
// Barbara Star

inputs:
	CCILength( 13 ),
	DMILength( 10 ),
	AvgLength( 18 ),
	MarkerOffset( 4 ),
	UpTrendColor( Blue ),
	DownTrendColor( DarkRed ),
	CCITopColor( Magenta ),
	CCIBottomColor( DarkGreen );

variables:
	ReturnValue( 0 ),
	oDMIPlus( 0 ),
	oDMIMinus( 0 ),
	oDMI( 0 ),
	oADX( 0 ),
	oADXR( 0 ),
	oVolty( 0 ),
	DMIOsc( 0 ),
	CCIValue( 0 ),
	Avg( 0 ),
	intrabarpersist PlotOffset( 0 );

once
begin
	PlotOffset = (MinMove / PriceScale) * MarkerOffset;
end;

Avg = Average( Close, AvgLength );
CCIValue = CCI( CCILength );
ReturnValue = DirMovement( High, Low, Close, DMILength,
 oDMIPlus, oDMIMinus, oDMI, oADX, oADXR, oVolty );
DMIOsc = oDMIPlus - oDMIMinus;

if Close > Avg
 and DMIOsc > 0
 and Low > L[1]
 and L[1] < L[2] then
	Plot1( Low - PlotOffset, "Up Trend", UpTrendColor )
else
	NoPlot(1);

if Close < Avg
 and DMIOsc < 0
 and High < High[1]
 and High[1] > High[2] then
	Plot2( High + PlotOffset, "Down Trend", DownTrendColor )
else
	NoPlot(2);

if CCIValue <= 100
 and CCIValue[1] > 100
 and CCIValue[2] > 100 then
	Plot3( High + PlotOffset, "CCI Top", CCITopColor )
else
	NoPlot( 3 );

if CCIValue >= -100
 and CCIValue[1] < -100
 and CCIValue[2] < -100 then
	Plot4( Low - PlotOffset, "CCI Bottom", CCIBottomColor )
else
	NoPlot( 4 );

PaintBar: DMI Oscillator
// TASC DEC 2022
// DMI Oscillator PaintBar
// Barbara Star

inputs:
	DMILength( 10 ),
	AboveZeroColor( DarkGreen ),
	BelowZeroColor( Red ),
	ZeroColor( DarkGray );

variables:
	ReturnValue( 0 ),
	oDMIPlus( 0 ),
	oDMIMinus( 0 ),
	oDMI( 0 ),
	oADX( 0 ),
	oADXR( 0 ),
	oVolty( 0 ),
	DMIOsc( 0 );

ReturnValue = DirMovement( High, Low, Close, DMILength,
 oDMIPlus, oDMIMinus, oDMI, oADX, oADXR, oVolty );
DMIOsc = oDMIPlus - oDMIMinus;

PlotPaintBar( High, Low, Open, Close, "DMI Osc" );

if DMIOsc > 0 then
begin
 	SetPlotColor( 1, AboveZeroColor );
 	SetPlotColor( 2, AboveZeroColor );
 	SetPlotColor( 3, AboveZeroColor );
 	SetPlotColor( 4, AboveZeroColor );
end
else if DMIOsc < 0 then
begin
	SetPlotColor( 1, BelowZeroColor );
	SetPlotColor( 2, BelowZeroColor );
	SetPlotColor( 3, BelowZeroColor );
	SetPlotColor( 4, BelowZeroColor );
end
else
begin
 	SetPlotColor( 1, ZeroColor );
 	SetPlotColor( 2, ZeroColor );
 	SetPlotColor( 3, ZeroColor );
 	SetPlotColor( 4, ZeroColor );
 end;
A sample chart is shown in Figure 1.

FIGURE 1: TRADESTATION. Here, a daily chart of Costco (symbol COST) for a portion of 2022 is shown with the indicators and PaintBar applied.
This article is for informational purposes. No type of trading or investment recommendation, advice, or strategy is being made, given, or in any manner provided by TradeStation Securities or its affiliates.
—John Robinson
TradeStation Securities, Inc.
www.TradeStation.com
BACK TO LIST

Wealth-Lab.com: December 2022
With Wealth-Lab 8 it couldn’t be easier to plot the difference between the +DI and −DI indicators as an oscillator, as Barbara Star describes in her article in this issue, “Short-Term Continuation And Reversal Signals.” Simply drag and drop the MathIndOpInd indicator (in the Transformers group) onto a chart, choosing DI+ as the first and DI− as the second indicator and choosing “subtract” as the operation. Finally, set the plot style to “HistogramTwoColor.” Voilà!
To demonstrate the application of indicators (see Figure 2) from Star’s article, we’ve coded the system she describes in the article for shorter-term traders in a simplified way:
using System;
using WealthLab.Backtest;
using WealthLab.Core;
using WealthLab.Indicators;

namespace WealthScript1
{
    public class TASC202212 : UserStrategyBase
    {
		TimeSeries diOsc, sma;
		CCI cci;
		bool _shortTrades;

		public TASC202212()
		{
			AddParameter("Short trades?", ParameterType.Int32, 0, 0, 1, 1);
		}

		public override void Initialize(BarHistory bars)
        {
			/* The DMI oscillator */
			diOsc = DIPlus.Series(bars, 10) - DIMinus.Series(bars, 10);
			sma = SMA.Series(bars.Close, 18);
			PlotTimeSeries( diOsc, "DI Oscillator", "DI", WLColor.DarkGreen, PlotStyle.HistogramTwoColor);

			cci = CCI.Series(bars, 13);
			PlotTimeSeries( cci, "CCI", "CCI");
			DrawHorzLine(+100, WLColor.Blue, 1, LineStyle.Dashed, "CCI");
			DrawHorzLine(-100, WLColor.Red, 1, LineStyle.Dashed, "CCI");
			PlotTimeSeries( sma, "SMA", "Price", WLColor.Black);
            _shortTrades = Parameters[0].AsInt == 0 ? false : true;
        }

		public override void Execute(BarHistory bars, int i)
		{
			/* Color the price bars */
			SetBarColor( bars, i, diOsc[i] > 0 ? WLColor.Green : diOsc[i] == 0 ? WLColor.Gray : WLColor.Red);

			/* DMI Continuation signals */
			bool dmiUp = bars.Close[i] > sma[i] && diOsc[i] > 0 && ConsecUp.Series(bars.Low, 1)[i] == 2;
			bool dmiDown = bars.Close[i] < sma[i] && diOsc[i] < 0 && ConsecDown.Series(bars.High, 1)[i] == 2;
			if (dmiUp) DrawDot( i, bars.Low[i] * 0.99, WLColor.Blue, 3, "Price");
			else
				if (dmiDown)	DrawDot( i, bars.High[i] * 1.01, WLColor.DarkRed, 3, "Price");

			/* CCI Reversal signals */
			bool cciTop = cci[i] <= 100 && cci[i - 1] > 100 && cci[i - 2] > 100;
			bool cciBottom = cci[i] >= -100 && cci[i - 1] < -100 && cci[i - 2] < -100;
			if (cciTop) DrawBarAnnotation( TextShape.ArrowDown, i, true, WLColor.Magenta, 20);
			else
				if (cciBottom) DrawBarAnnotation( TextShape.ArrowUp, i, false, WLColor.DarkGreen, 20);

			if (_shortTrades)
			{
				if (! HasOpenPosition (bars, PositionType.Short))
	            {
					if (dmiDown) PlaceTrade( bars, TransactionType.Short, OrderType.Market);
				}
				else
					if(cciBottom) PlaceTrade( bars, TransactionType.Cover, OrderType.Market);
			}

			if (! HasOpenPosition (bars, PositionType.Long))
			{
				if(dmiUp) PlaceTrade( bars, TransactionType.Buy, OrderType.Market);
			}
			else
				if(cciTop) PlaceTrade( bars, TransactionType.Sell, OrderType.Market);
        }
    }
}

FIGURE 2: WEALTH-LAB. This demonstrates example trades taken by the trading system applied to a chart of SPY in Wealth-Lab 8.
—Gene Geren (Eugene)
Wealth-Lab team
www.wealth-lab.com
BACK TO LIST

NinjaTrader: December 2022
In “Short-Term Continuation And Reversal Signals” by Barbara Star in this issue, the short-term continuation and reversal signals indicator she describes has been made available for download at the following links for NinjaTrader 8 and for NinjaTrader 7:
Once the file is downloaded, you can import the indicator into NinjaTrader 8 from within the control center by selecting Tools → Import → NinjaScript Add-On and then selecting the downloaded file for NinjaTrader 8. To import into NinjaTrader 7, from within the control center window, select the menu File → Utilities → Import NinjaScript and select the downloaded file.
You can review the indicator source code in NinjaTrader 8 by selecting the menu New → NinjaScript Editor → Indicators folder from within the control center window and selecting the ShortTermContinuationAndReversal file. You can review the indicator’s source code in NinjaTrader 7 by selecting the menu Tools → Edit NinjaScript → Indicator from within the control center window and selecting the ShortTermContinuationAndReversal file.
NinjaScript uses compiled DLLs that run native, not interpreted, to provide you with the highest performance possible.
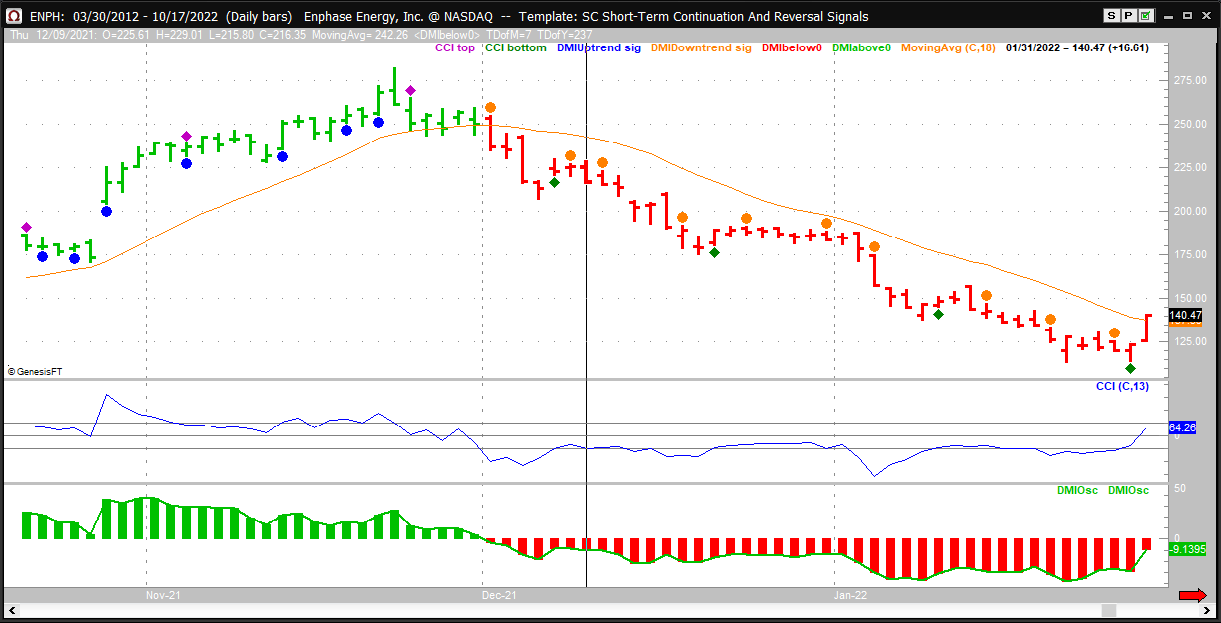
A sample NinjaTrader chart displaying the indicator is shown in Figure 3.

FIGURE 3: NINJATRADER. The short-term continuation and reversal indicator is displayed on a daily chart pf ENPH from October 2021 to January 2022.
—Emily Christoph
NinjaTrader, LLC
www.ninjatrader.com
BACK TO LIST

TradingView: December 2022
Here is the TradingView Pine Script code implementing the indicators described in this issue’s article “Short-Term Continuation And Reversal Signals” by Barbara Star:
//  TASC Issue: December 2022 - Vol. 40, Issue 13
//     Article: Short-Term Continuation And Reversal Signals
//  Article By: Barbara Star
//    Language: TradingView's Pine Script™ v5
// Provided By: PineCoders, for tradingview.com

//@version=5
string title = 'TASC 2022.12' +
 'Short-Term Continuation And Reversal Signals'
string stitle = 'TASC 2022.12'
indicator(title, stitle, false)

// Constant variables:
string XP0 = shape.arrowdown, string XP5 = shape.flag
string XP1 = shape.arrowup  , string XP6 = shape.square
string XP2 = shape.circle   , string XP7 = shape.triangledown
string XP3 = shape.cross    , string XP8 = shape.triangleup
string XP4 = shape.diamond  , string XP9 = shape.xcross
string LTOP= location.top   , string LABAR = location.abovebar
string LBOT= location.bottom, string LBBAR = location.belowbar
string SZ  = size.tiny      , string LDASH = line.style_dashed
PH = plot.style_histogram
color CGRAY = #555522

// Input panel groups, titles and inline references:
string g00 = 'Input Options:'
string g01 = 'Style Options:'
string it0 = 'Continuity Signals:'
string it1 = 'CCI Signals:     '
string it2 = 'Oscillator Mode:'
string it3 = 'DMI Colors:     '
string it4 = 'DMI Multiplier:  '
string MD0 = 'DMI', string MD2 = 'Dual'
string MD1 = 'CCI', string MD3 = 'Overlay'

// Input options:
string mode   = input.string(MD2, it2,
 [MD0, MD1, MD2, MD3], group=g00)
float DMIMult = input.float(1.0, it4, step=0.25, group=g00)
int  diLength = input.int(10, 'DMI Length:', group=g00)
int  maLength = input.int(18,  'MA Length:', group=g00)
int cciLength = input.int(13, 'CCI Length:', group=g00)

// Style options:
color colDMIUp      = input.color(#22AA22,it3,'',it3,g01)
color colDMIDo      = input.color(#AA2222,'','',it3,g01)
string shapeCon     = input.string(XP2, it0,
 [XP0,XP1,XP2,XP3,XP4,XP5,XP6,XP7,XP8,XP9],'',it0,g01)
color colConUpTrend = input.color(#5188FF,'','',it0,g01)
color colConDoTrend = input.color(#771515,'','',it0,g01)
string shapeCCI     = input.string(XP4, it1,
 [XP0,XP1,XP2,XP3,XP4,XP5,XP6,XP7,XP8,XP9],'',it1,g01)
color colCCITop     = input.color(#BB00FF,'','',it1,g01)
color colCCIBot     = input.color(#FFBB00,'','',it1,g01)

// Indicators:
float    ma = ta.sma(close, maLength)
[dp, dm, _] = ta.dmi(diLength, 1)
float   DMI = dp - dm
float  mDMI = DMIMult * DMI
float   CCI = ta.cci(close, cciLength)
float  uCCI = CCI > +100.0 ? CCI : na
float  lCCI = CCI < -100.0 ? CCI : na

// Boolean Signals:
bool      pGTma = close > ma, bool  pLTma = close < ma
bool  cciGTp100 = CCI > 100 , bool cciLTm100 = CCI < -100
bool     dmiGT0 = DMI > 0   , bool dmiLT0 = DMI < 0
bool    risingL = low > low[1]   and low[1] > low[2]
bool    falingH = high < high[1] and high[1] < high[2]
bool conUpTrend = pGTma and dmiGT0 and risingL
bool conDoTrend = pLTma and dmiLT0 and falingH
bool cciTop = (not cciGTp100) and cciGTp100[1] and cciGTp100[2]
bool cciBot = (not cciLTm100) and cciLTm100[1] and cciLTm100[2]
bool useDMI = mode == MD0 or mode == MD2
bool useCCI = mode == MD1 or mode == MD2
bool isOverlay = mode == MD3

// Color variation:
color colDMI = switch
    dmiGT0 => colDMIUp
    dmiLT0 => colDMIDo
    => CGRAY
color colCCI = switch
    cciGTp100 => colCCITop
    cciLTm100 => colCCIBot
    => CGRAY

// Output:
showDMI     = useDMI    ? display.all  : display.none
showCCI     = useCCI    ? display.all  : display.none
showLVL     = isOverlay ? display.none : display.all
showOverlay = isOverlay ? display.all  : display.none

// Oscillator signals:
plotshape(conUpTrend, it0, shapeCon, LBOT, colConUpTrend,
 size=SZ, display=showLVL)
plotshape(conDoTrend, it0, shapeCon, LTOP, colConDoTrend,
 size=SZ, display=showLVL)
plotshape(cciTop, it1, shapeCCI, LTOP, colCCITop,
 size=SZ, display=showLVL)
plotshape(cciBot, it1, shapeCCI, LBOT, colCCIBot,
 size=SZ, display=showLVL)
// Overlaid signals:
plotshape(conUpTrend, it0, shapeCon, LBBAR, colConUpTrend,
 size=SZ, display=showOverlay)
plotshape(conDoTrend, it0, shapeCon, LABAR, colConDoTrend,
 size=SZ, display=showOverlay)
plotshape(cciTop, it1, shapeCCI, LABAR, colCCITop,
 size=SZ, display=showOverlay)
plotshape(cciBot, it1, shapeCCI, LBBAR, colCCIBot,
 size=SZ, display=showOverlay)

// Plots:
plot(mDMI, 'DMI Histogram', colDMI, 4, PH, display=showDMI)
plot(mDMI, 'DMI', CGRAY, display=showDMI)
plot(uCCI, 'CCI+', colCCI, 2, PH, false,+100, display=showCCI)
plot(lCCI, 'CCI-', colCCI, 2, PH, false,-100, display=showCCI)
plot(CCI, 'CCI', #BBFFFF, 2, display=showCCI)
hline(0, 'LVL0', CGRAY, display=showLVL)

if useCCI
    var line l1 = line.new(bar_index, +100, bar_index+1, +100,
     xloc.bar_index, extend.both, CGRAY, LDASH)
    var line l2 = line.new(bar_index, -100, bar_index+1, -100,
     xloc.bar_index, extend.both, CGRAY, LDASH)
    line.set_x1(l1, bar_index), line.set_x2(l1, bar_index+1)
    line.set_x1(l2, bar_index), line.set_x2(l2, bar_index+1)
    linefill.new(l1, l2, color.new(CGRAY, 90))

barcolor(colDMI, editable=false, title='barcolor')
The indicator is available on TradingView from the PineCodersTASC account at tradingview.com/u/PineCodersTASC/#published-scripts.
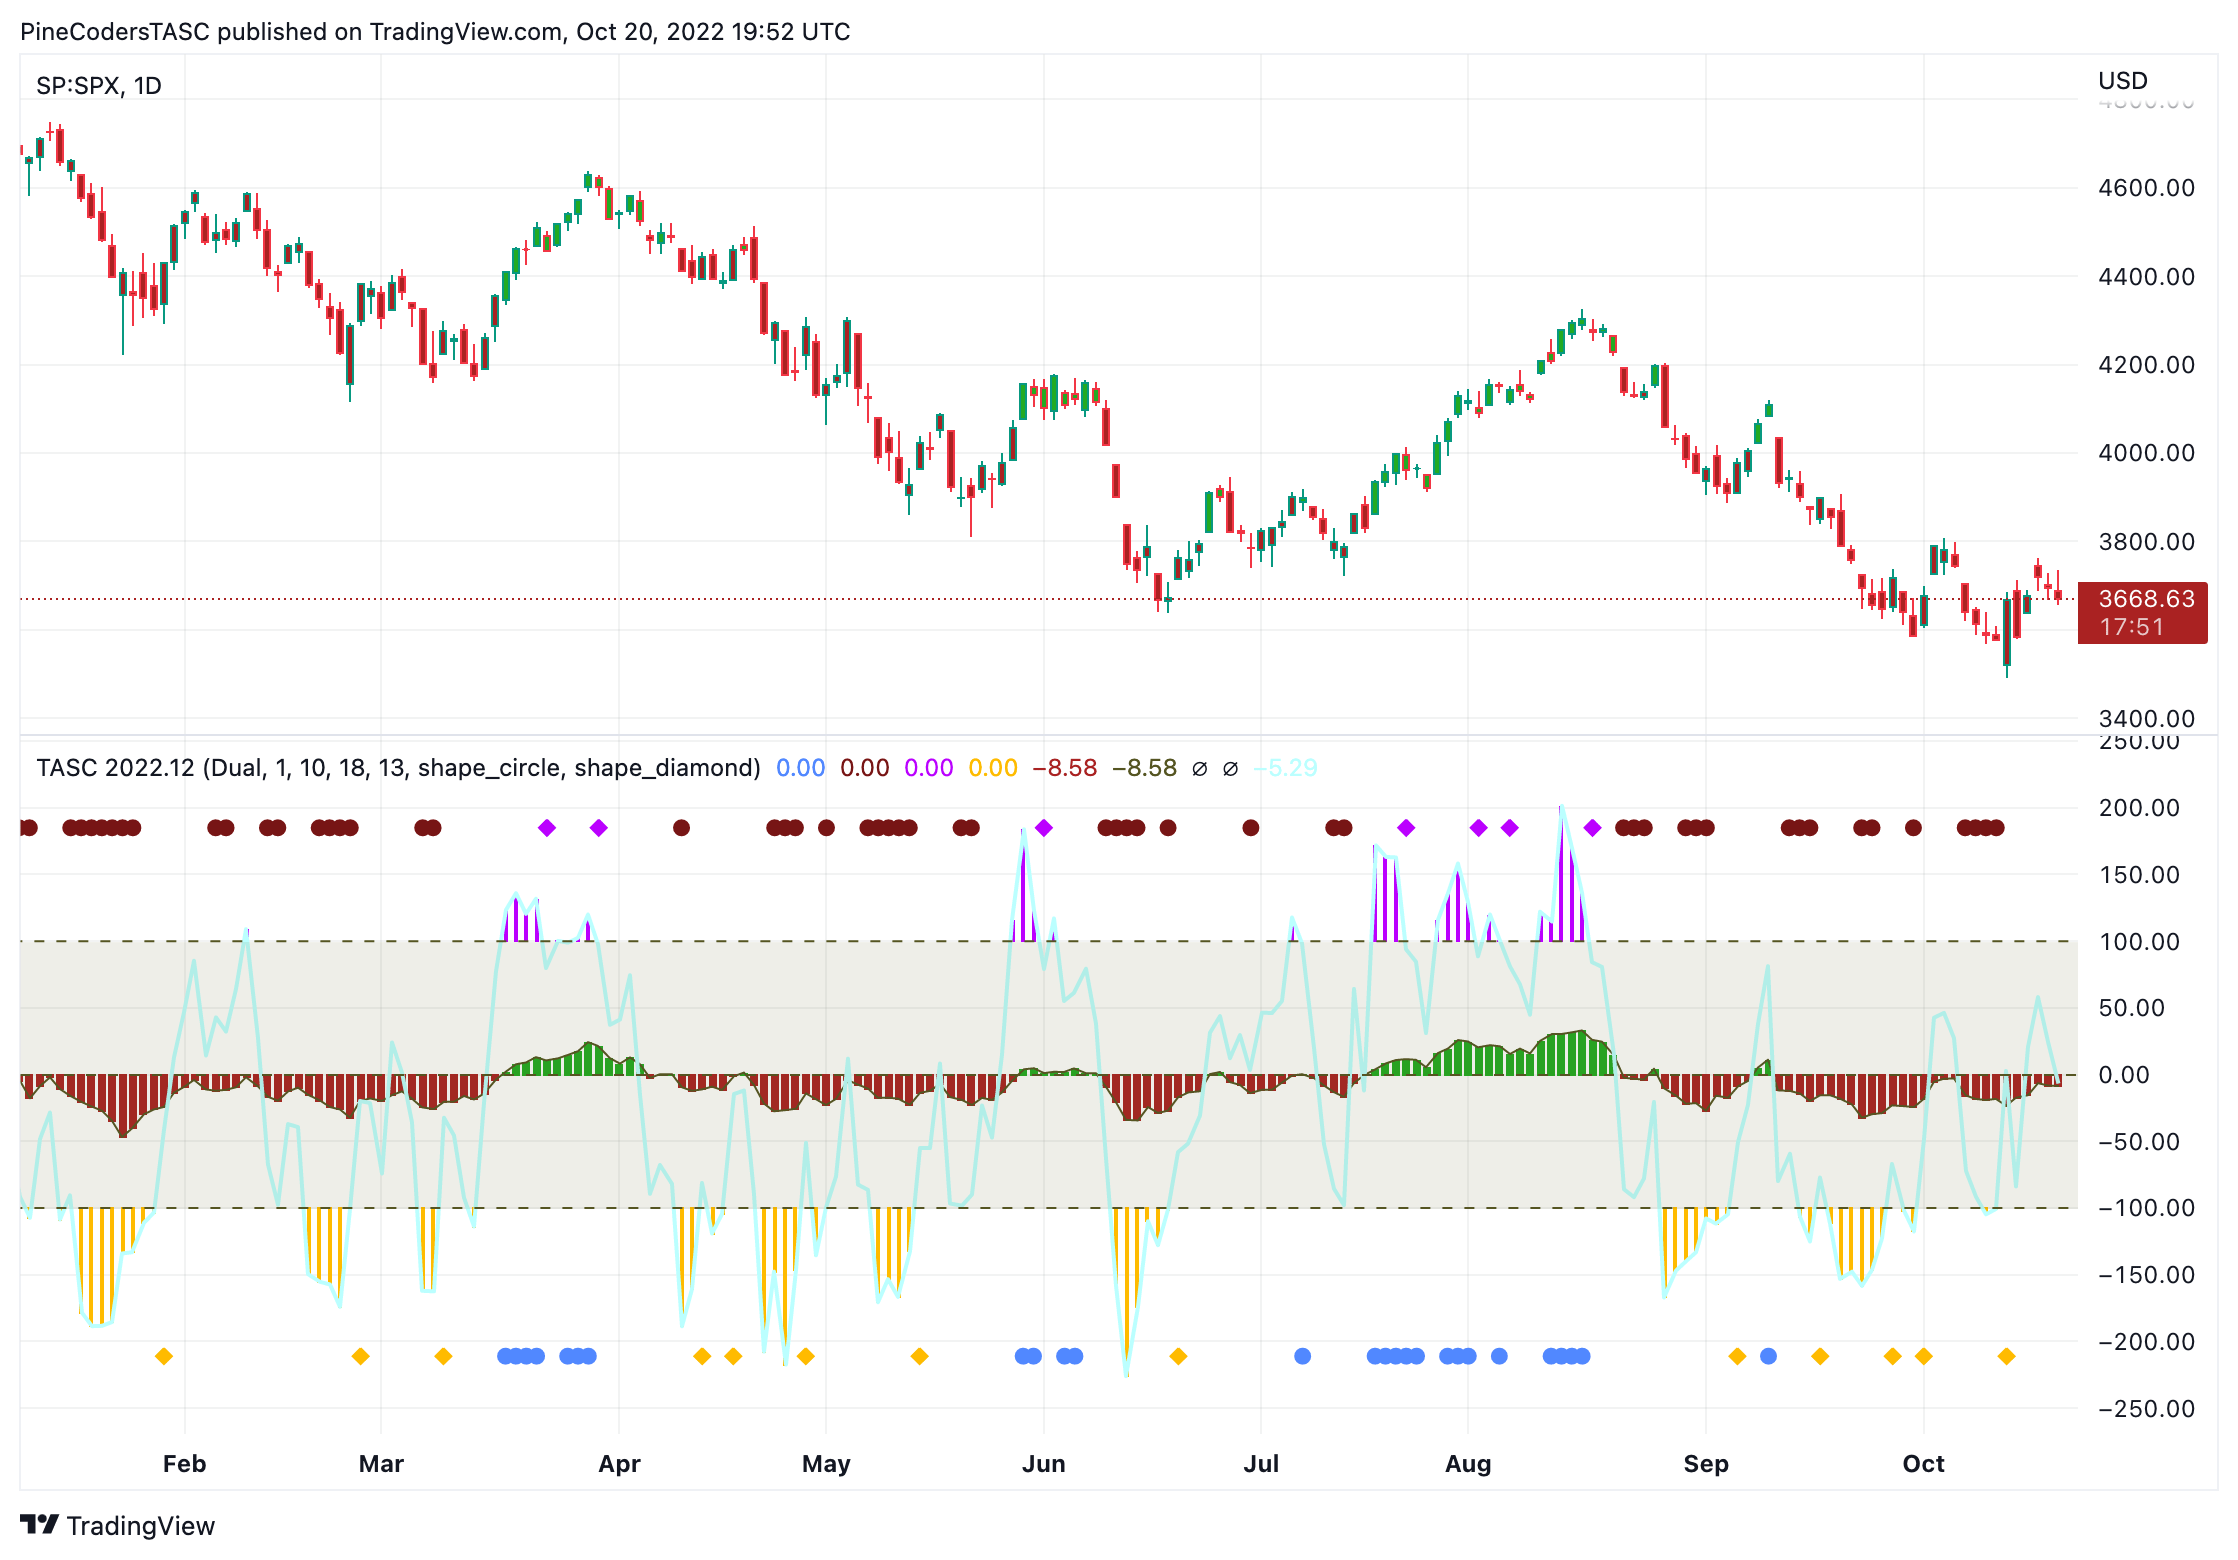
An example chart is shown in Figure 4.

FIGURE 4: TRADINGVIEW. This chart demonstrates the indicator described in Barbara Star’s article in this issue for short-term continuation and reversal signals.
—PineCoders, for TradingView
www.TradingView.com
BACK TO LIST

Neuroshell Trader: December 2022
In “Short-Term Continuation And Reversal Signals” in this issue, Barbara Star presents a way to use the DMI oscillator. Her technique can be easily implemented in NeuroShell Trader by combining some of NeuroShell Trader’s 800+ indicators. To implement the oscillator, select “new indicator” from the insert menu, use the indicator wizard to create the indicator.
To change its bar coloring above and below zero, as Star discusses in her article, simply select the indicator on the chart, choose “selected indicator” from the format menu, and then choose the coloration options on the multi-colored options tab.
Divide( Avg1-Avg2( Close, 20, 40), Avg( Close, 40) )
To implement the DMI oscillator continuation signals as a trading system in NeuroShell Trader, select “new strategy” from the insert menu and use the trading strategy wizard to create the following strategy:
BUY LONG CONDITIONS: [All of which must be true]
     A>B(Close,Avg(Close,18))
     A>B(PlusDI(High,Low,Close,10),MinusDI(High,Low,Close,10))
     A>B(Low,Lag(Low,1))
     A<B(Lag(Low,1),Lag(Low,2))
SELL LONG CONDITIONS: [All of which must be true]
     A<B(Close,Avg(Close,18))
     A<B(PlusDI(High,Low,Close,10),MinusDI(High,Low,Close,10))
     A<B(High,Lag(High,1))
     A>B(Lag(High,1),Lag(High,2))
To implement the CCI reversal signals as a trading system, select “new strategy” from the insert menu and use the trading strategy wizard to create the following strategy:
BUY LONG CONDITIONS: [All of which must be true]
     A>=B(CCI(High,Low,Close,13,0.015),-100)
     A<B(Lag(CCI(High,Low,Close,13,0.015),1),-100)
     A<B(Lag(CCI(High,Low,Close,13,0.015),2),-100)
SELL LONG CONDITIONS: [All of which must be true]
     A<=B(CCI(High,Low,Close,13,0.015),100)
     A>B(Lag(CCI(High,Low,Close,13,0.015),1),100)
     A>B(Lag(CCI(High,Low,Close,13,0.015),2),100)
Note that Wilder’s PlusDI and MinusDI indicators are included in the Advanced Indicator Set 2 Add-on.
Users of NeuroShell Trader can go to the Stocks & Commodities section of the NeuroShell Trader free technical support website to download a copy of this or any previous Traders’ Tips.

FIGURE 5: NEUROSHELL TRADER. This NeuroShell Trader chart shows the DMI and CCI indicators, reversal signals, and continuation signals on for Tyson Foods.
—Ward Systems Group, Inc.
sales@wardsystems.com
www.neuroshell.com
BACK TO LIST

Optuma: December 2022
Here are the formulas to implement the techniques described by Barbara Star in her article in this issue, “Short-Term Continuation And Reversal Signals,” in Optuma.
Formula for DMI oscillator above or below zero:

ADX(BARS=10).DMPlus - ADX(BARS=10).DMMinus

Bar colours:

Set the default colour to red and use this for the custom colour:

ADX(BARS=10).DMPlus - ADX(BARS=10).DMMinus > 0

DMI oscillator continuation signals

Up-trending signals in the Show Bar tool set to blue circle symbol:

DMO=ADX(BARS=10).DMPlus - ADX(BARS=10).DMMinus;

CLOSE()>MA(BARS=18, CALC=Close) and DMO>0 and LOW()>LOW()[1] and LOW()[1]<LOW()[2]

Down-trending signals in the Show Bar tool set to red circle symbol:

DMO=ADX(BARS=10).DMPlus - ADX(BARS=10).DMMinus;

CLOSE()<MA(BARS=18, CALC=Close) and DMO<0 and HIGH()<HIGH()[1] and HIGH()[1]>HIGH()[2]

CCI reversal signals

CCI top in the Show Bar tool set to blue diamond symbol::

CCI(BARS=13) CrossesBelow 100 and CCI(BARS=13)[2]>100

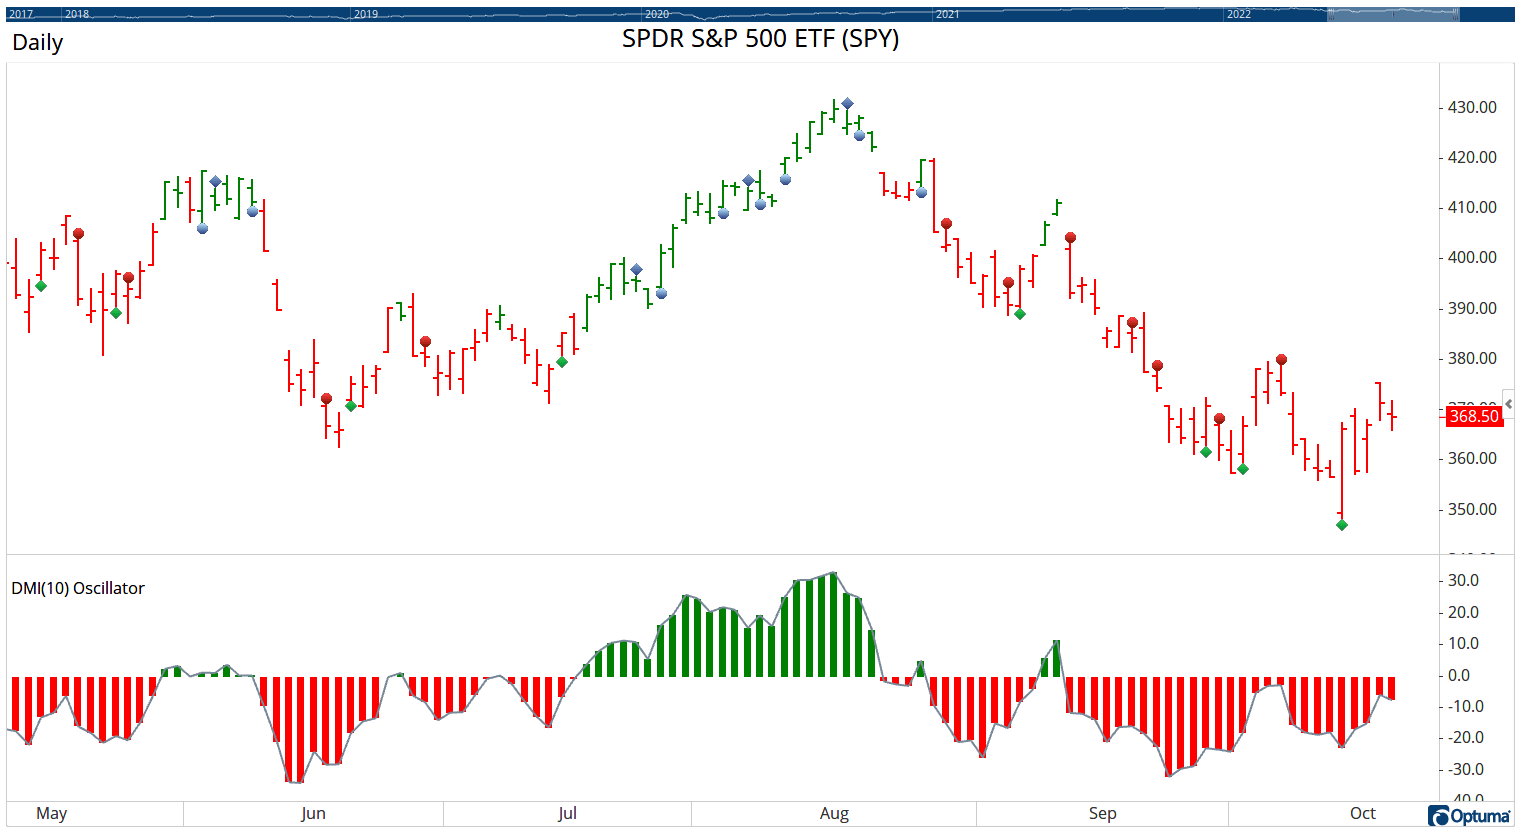
CCI bottom in the Show Bar tool set to green diamond symbol:

CCI(BARS=13) CrossesAbove -100 and CCI(BARS=13)[2]<-100

FIGURE 6: OPTUMA. This sample chart implements Barbara Star’s technique for displaying the DMI oscillator with example signals on a daily chart of SPY.
—support@optuma.com
Optuma.com
BACK TO LIST

AIQ: December 2022
The importable AIQ EDS file based on Barbara Star’s article in this issue, “Short-Term Continuation And Reversal Signals,” can be obtained on request via email to info@TradersEdgeSystems.com. The code is also shown here:
! Short-Term Continuation And Reversal Signals
! Author: Barbara Star, TASC Dec 2022
! Coded by: Richard Denning, 10/21/2022

C is [close].
H is [high].
L is [low].
H1 is valresult(H,1).
H2 is valresult(H,2).
L1 is valresult(L,1).
L2 is valresult(L,2).

GreenDMI if [DirMov] > 0.
RedDMI if [DirMov] < 0.

StartOfDownTrend if C < simpleavg(C,18) and [DirMov] < 0 and H < H1 and H1 > H2.
StartOfUpTrend if C >= simpleavg(C,18) and [DirMov] >= 0 and L > L1 and L1 < L2.

GreenTrend if C >= simpleavg(C,18) and [DirMov] >= 0.
RedTrend if C < simpleavg(C,18) and [DirMov] < 0.
Code for the author’s color study is set up in the AIQ EDS code file. Figure 7 shows the color studies set up in the charts module. Figure 8 shows the color studies on a chart of Apple, Inc. (AAPL). The black bars are potential entry points in the downtrend.

FIGURE 7: AIQ. The color bar setup in the charts module is demonstrated.

FIGURE 8: AIQ. This shows an example of the color studies applied to a chart of Apple, Inc. (AAPL) with a DMI histogram and an 18-bar simple moving average.
—Richard Denning
info@TradersEdgeSystems.com
for AIQ Systems
BACK TO LIST

Trade Navigator: December 2022
We have created a special file to make it easy to download the library in Trade Navigator that is based on Barbara Star’s article in this issue, “Short-Term Continuation And Reversal Signals.”
The file name is “SC202212.”
To install this library into Trade Navigator, click on Trade Navigator’s file dropdown menu, then select update data. Next, select download special file, then erase the word “upgrade” and type in “SC202212,” then click the start button. When prompted to upgrade, click the yes button. If prompted to close all software, click on the continue button. Your library will now download.
This library contains a template named “SC Short-Term Continuation And Reversal Signals,” and seven functions: CCI Bottom, CCI Top, DMIabove0, DMIbelow0, DMIdowntrend sig, DMIuptrend sig, and DMIOsc.
Template
The template we have added to the library allows you to modify your chart with a prebuilt indicator package and settings. To access the template, open the charting pull-down menu, select the templates command, then on the sub-menu that opens, select the “SC Short-Term Continuation And Reversal Signals” template. If you are prompted with, “Save the current chart settings as template?” your answer will depend on whether or not you’ve made any changes to your current chart template that you would like to keep. If you choose “no,” these changes will be discarded; a “yes” choice will save the changes into the prior template on your chart before switching to the “SC Short-Term Continuation And Reversal Signals” template.
Adding the indicators to your chart
You can insert indicators onto your chart by opening the charting drop-down menu, selecting the “add to chart” command, then, on the indicators tab, find your named indicator, select it, then click on the add button. Repeat this procedure for additional indicators if you wish.

FIGURE 9: TRADE NAVIGATOR. This chart demonstrates using the “SC Short-Term Continuation And Reversal Signals” template in Trade Navigator based on the techniques described in Barbara Star’s article in this issue.
If you need assistance with creating or using the indicators and/or template, our friendly technical support staff will be happy to help via phone or via live chat through our website.
—Genesis Financial Data
Tech support 719 884-0245
www.TradeNavigator.com
BACK TO LIST
Originally published in the December 2022 issue of
Technical Analysis of STOCKS & COMMODITIES magazine.
All rights reserved. © Copyright 2022, Technical Analysis, Inc.


