TRADERS’ TIPS
January 2023

For this month’s Traders’ Tips, the focus is Vitali Apirine’s article in this issue, “True Range Adjusted Exponential Moving Average (TRAdj EMA).” Here, we present the January 2023 Traders’ Tips code with possible implementations in various software.
You can right-click on any chart to open it in a new tab or window and view it at it’s originally supplied size, often much larger than the version printed in the magazine.
The Traders’ Tips section is provided to help the reader implement a selected technique from an article in this issue or another recent issue. The entries here are contributed by software developers or programmers for software that is capable of customization.

TradeStation: January 2023
In his article in this issue, “True Range Adjusted Exponential Moving Average (TRAdj EMA),” author Vitali Apirine presents how a security’s true range, which measures volatility, can be incorporated into a traditional exponential moving average. The trend-following indicator, called the true range adjusted exponential moving average (TRAdj EMA), applied with different lengths, can help define turning points and filter price movements. By comparing the indicator with an exponential moving average of identical length, the trader can gain insight into the overall trend.
// TASC JAN 2023
// True Range Adjusted EMA
// Vitali Apirine

inputs:
	Periods( 40 ),
	Pds( 40 ),
	Mltp( 10 );

variables:
	Mltp1( 0 ),
	Mltp2( 0 ),
	Rate( 0 ),
	TH( 0 ),
	TL( 0 ),
	TR( 0 ),
	TRAdj( 0 ),
	TRAdjEMA( 0 );

Mltp1 = 2 / (Periods + 1);
TH = Iff(Close[1] > High, Close[1], High);
TL = Iff(Close[1] < Low, Close[1], Low);
TR = AbsValue(TH - TL);
TRAdj = (TR - Lowest(TR, Pds)) /
 (Highest(TR, Pds) - Lowest(TR, Pds));
Mltp2 = TrAdj * Mltp;
Rate = Mltp1*(1 + Mltp2);

if CurrentBar = 1 then
	TRAdjEMA = Close
else
	TRAdjEMA = TRAdjEMA[1] + Rate *
	 (Close - TRAdjEMA[1]);

Plot1( TRAdjEMA, "TRAdjEMA" );
A sample chart is shown in Figure 1.

FIGURE 1: TRADESTATION. This TradeStation daily chart of the S&P 500 ETF SPY shows a portion of 2022 with the indicator and exponential moving average applied. The indicator is configured with inputs 20, 20, and 5, and the exponential moving average is configured with the same length of 20.
This article is for informational purposes. No type of trading or investment recommendation, advice, or strategy is being made, given, or in any manner provided by TradeStation Securities or its affiliates.
—John Robinson
TradeStation Securities, Inc.
www.TradeStation.com
BACK TO LIST

thinkorswim: January 2023
We have put together a study based on the article by Vitali Apirine in this issue on the true range adjusted exponential moving average (TR AdjEMA). We built the study referenced by using our proprietary scripting language, thinkscript. To ease the loading process, simply click https://tos.mx/Iwxt5XL or enter it into the address into setup → open shared item from within thinkorswim, then choose view thinkScript study and name it “TRAdjEMA” or whatever you prefer and can identify. You can then add the study to your charts from the edit studies menu from within the charts tab and then selecting “studies.”
Figure 2 shows our version of the study on a daily chart of SPX. Please see Apirine’s article in this issue for how to interpret the indicator.

FIGURE 2: THINKORSWIM. Here is a sample plot of a version of the study (TRAdjEMA) on a daily chart of SPX. Please see Vitali Apirine’s article in this issue for how to interpret the indicator.
—thinkorswim
A division of TD Ameritrade, Inc.
www.thinkorswim.com
BACK TO LIST

Wealth-Lab.com: January 2023
The TRAdjEMA described by Vitali Apirine in his article in this issue has been added to Wealth-Lab 8 Build 22+, making it available to its wide range of tools and extensions automatically.
To demonstrate the new indicator’s application, let’s sketch a trading system based on bullish crossovers of the two TRAdjEMA smoothers with faster and slower reaction speed. For example, the author took the TRAdj EMA(10,10,5) and TRAdj EMA(40,40,5) in his article. For testing purposes, to close the long position, we simply exit after 25 bars. The trading system’s rules are outlined in Figure 3.
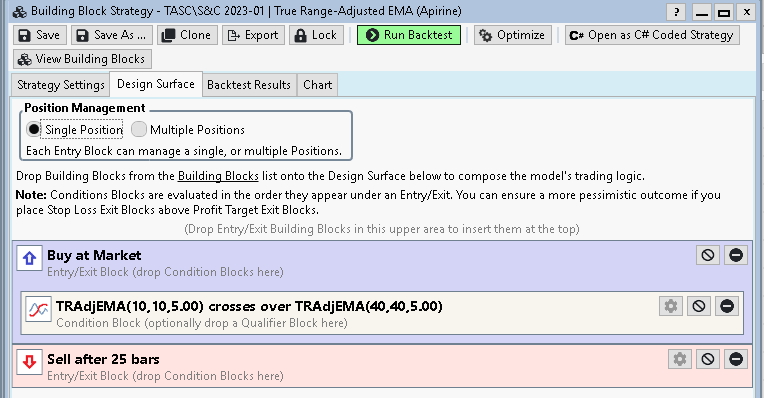
FIGURE 3: WEALTH-LAB. An example of laying out the system’s rules in the Building Blocks feature of Wealth-Lab 8.
Figure 4 illustrates some potential long trades that could have taken place when the faster TRAdjEMA (black) crossed below the slower TRAdjEMA (blue) in 2021 and 2022.
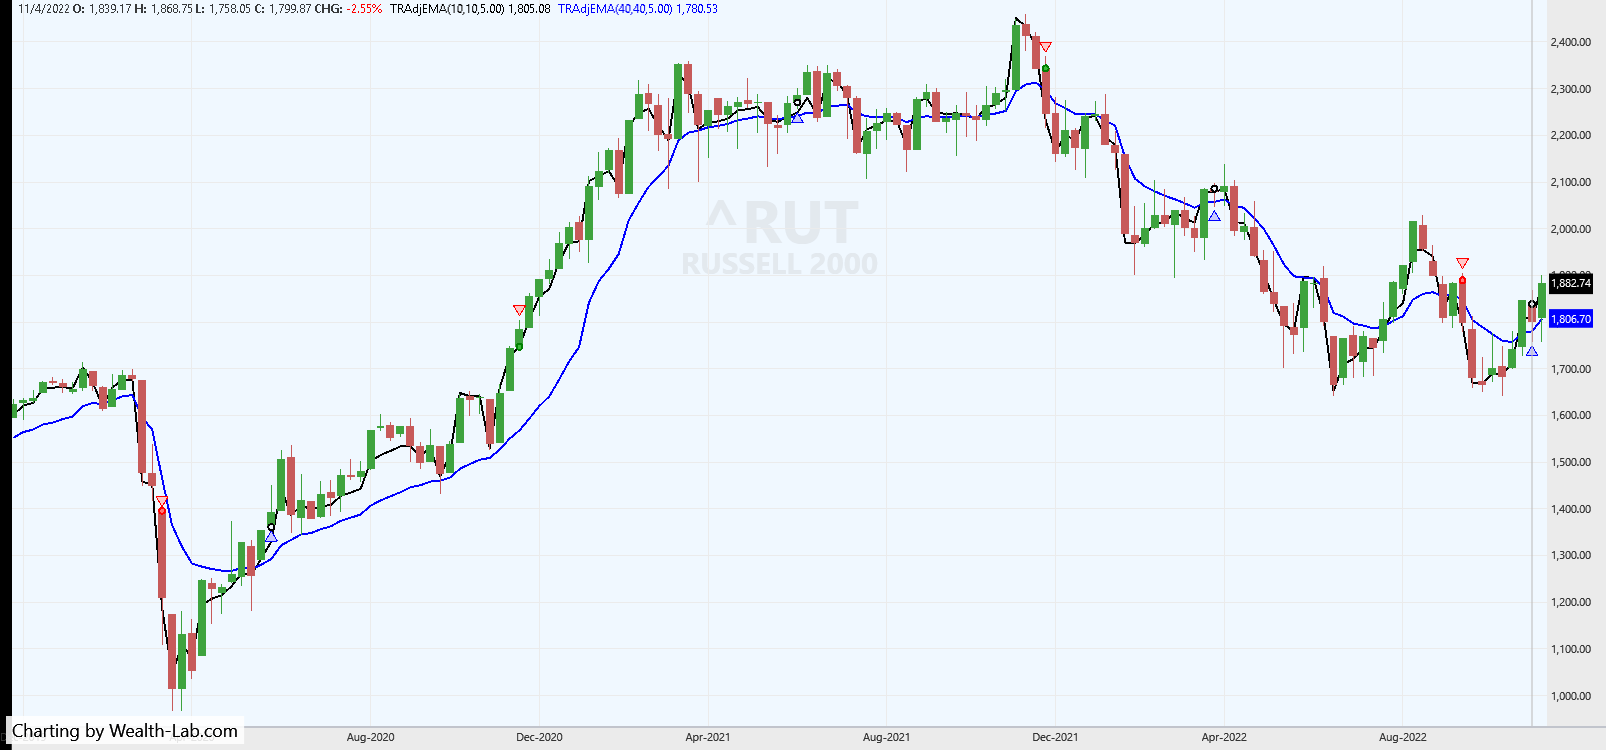
FIGURE 4: WEALTH-LAB. Trades taken by the fast/slow TRAdjEMA crossovers are applied to a weekly chart of the Russell 2000 index (^RUT).
—Gene Geren (Eugene)
Wealth-Lab team
www.wealth-lab.com
BACK TO LIST

NinjaTrader: January 2023
The indicator described in Vitali Apirine’s article in this issue, “True Range Adjusted Exponential Moving Average (TRAdj EMA),” has been made available for download at the following links for NinjaTrader 8 and for NinjaTrader 7:
Once the file is downloaded, you can import the indicator into NinjaTrader 8 from within the control center by selecting Tools → Import → NinjaScript Add-On and then selecting the downloaded file for NinjaTrader 8. To import into NinjaTrader 7, from within the control center window, select the menu File → Utilities → Import NinjaScript and select the downloaded file.
You can review the indicator source code in NinjaTrader 8 by selecting the menu New → NinjaScript Editor → Indicators folder from within the control center window and selecting the indicator file. You can review the indicator’s source code in NinjaTrader 7 by selecting the menu Tools → Edit NinjaScript → Indicator from within the control center window and selecting the indicator file.
NinjaScript uses compiled DLLs that run native, not interpreted, to provide you with the highest performance possible.
A sample chart displaying the indicator is shown in Figure 5.

FIGURE 5: NINJATRADER. The TRAdjEMA indicator is displayed on a one-minute chart of S&P 500 emini futures (ES).
—Chelsea Bell
NinjaTrader, LLC
www.ninjatrader.com
BACK TO LIST

TradingView: January 2023
Here is TradingView Pine Script code implementing the TRAdj EMA indicator described in this issue’s article by Vitali Apirine, “True Range Adjusted Exponential Moving Average (TRadj EMA).”
//  TASC Issue: January 2023 - Vol. 41, Issue 1
//     Article: TRAdj EMA - True Range Adjusted
//              Exponential Moving Average
//  Article By: Vitali Apirine
//    Language: TradingView's Pine Script™ v5
// Provided By: PineCoders, for tradingview.com

//@version=5
string title = 'TASC 2023.01 TRAdj EMA'
string stitle = 'TRAdj EMA'
indicator(title, stitle, true)

int Periods = input.int(40,       'MA Length:', 1)
int     Pds = input.int(40, 'Lookback Period:', 1)
int    Mltp = input.int(10,      'Multiplier:', 5, 10)

TRAdjEMA (
  float source = close,
  int  Periods = 40,
  int      Pds = 40,
  int     Mltp = 10
 ) =>
    int   pds      = math.max(1, Pds)
    float Mltp1    = 2.0 / (Periods + 1.0)
    float HHV      = ta.highest(ta.tr, pds)
    float LLV      = ta.lowest(ta.tr, pds)
    float TRAdj    = (ta.tr - LLV) / (HHV - LLV)
    float Mltp2    = TRAdj * Mltp
    float Rate     = Mltp1 * (1.0 + Mltp2)
    float TRAdjEMA = na
    if bar_index > math.max(Periods, pds)
        float prev = nz(TRAdjEMA[1], source)
        TRAdjEMA  := prev + Rate * (source - prev)
    TRAdjEMA

float ma = TRAdjEMA(close, Periods, Pds, Mltp)
plot(ma, 'TRAdjEMA', color.blue)
The code is available on TradingView in the PineCodersTASC account: https://www.tradingview.com/u/PineCodersTASC/#published-scripts.
An example chart is shown in Figure 6.
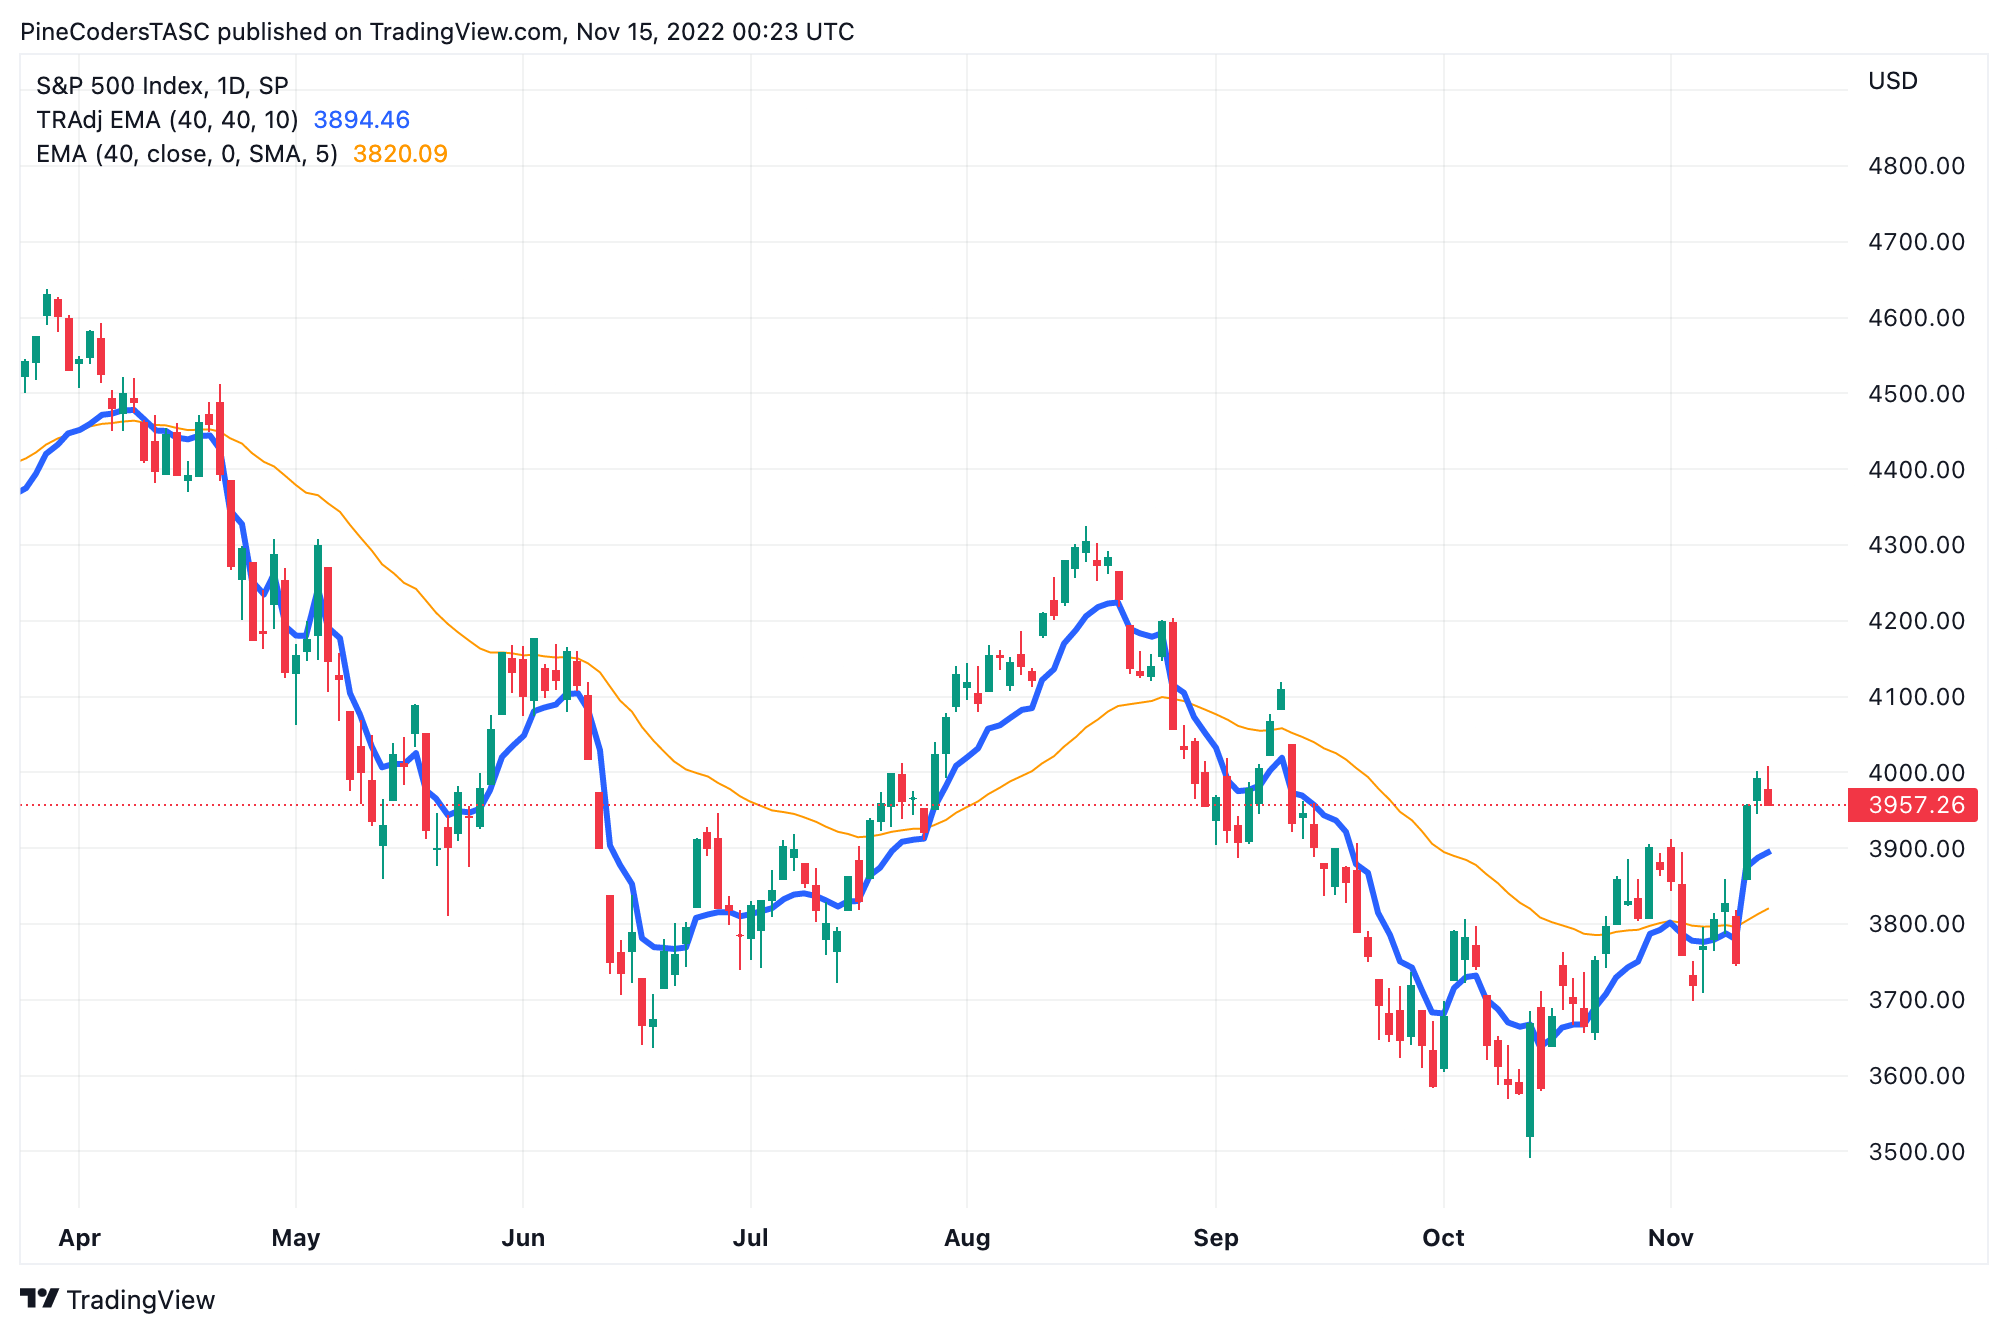
FIGURE 6: TRADINGVIEW. This chart demonstrates the indicator described in Vitali Apirine’s article in this issue, the TRadj EMA.
—PineCoders, for TradingView
www.TradingView.com
BACK TO LIST

Neuroshell Trader: January 2023
The indicator described in Vitali Apirine’s article in this issue, “True Range Adjusted Exponential Moving Average (TRAdj EMA),” can be easily implemented in NeuroShell Trader by combining some of NeuroShell Trader’s 800+ indicators. To implement the indicators, select “new indicator” from the insert menu and use the indicator wizard to create the following indicators:
Mltp1:	Divide(2,Add2(40,1)))
Mltp2:	Mul2(Divide(SimpleStoch%K(ATR(High,Low,Close,1),40),100),10)
RATE:	Mul2(Mltp1, Add2(1, Mltp2))

TRAdjEMA:	DynamicExpAvg (Close, RATE )
Users of NeuroShell Trader can go to the Stocks & Commodities section of the NeuroShell Trader free technical support website to download a copy of this or any previous Traders’ Tips. The DynamicExpAvg is a dynamic rate exponential moving average custom indicator available for download on the free technical support website with the Traders’ Tip.

FIGURE 7: NEUROSHELL TRADER. This NeuroShell Trader chart shows the SPX true range adjusted exponential moving average.
—Ward Systems Group, Inc.
sales@wardsystems.com
www.neuroshell.com
BACK TO LIST

Optuma: January 2023
Here is an Optuma script formula to implement the true range adjusted exponential moving average (TRAdj EMA), which is described in the article in this issue by Vitali Apirine.
$Periods = 40;
$Pds = 40;
MLTP = 10;
MLTP1 = 2 / (VarToList(VAL=$Periods) + 1);
TR=TRUERANGE();
TRAdj = (TR-LOWESTLOW(TR, BARS=$Pds)) / (HIGHESTHIGH(TR, BARS=$Pds) - LOWESTLOW(TR, BARS=$Pds));

MLTP2=TRAdj*MLTP;

RATE=MLTP1*(1+MLTP2);
RES1=RES1 + RATE * (Close() - RES1[1]);
RES1
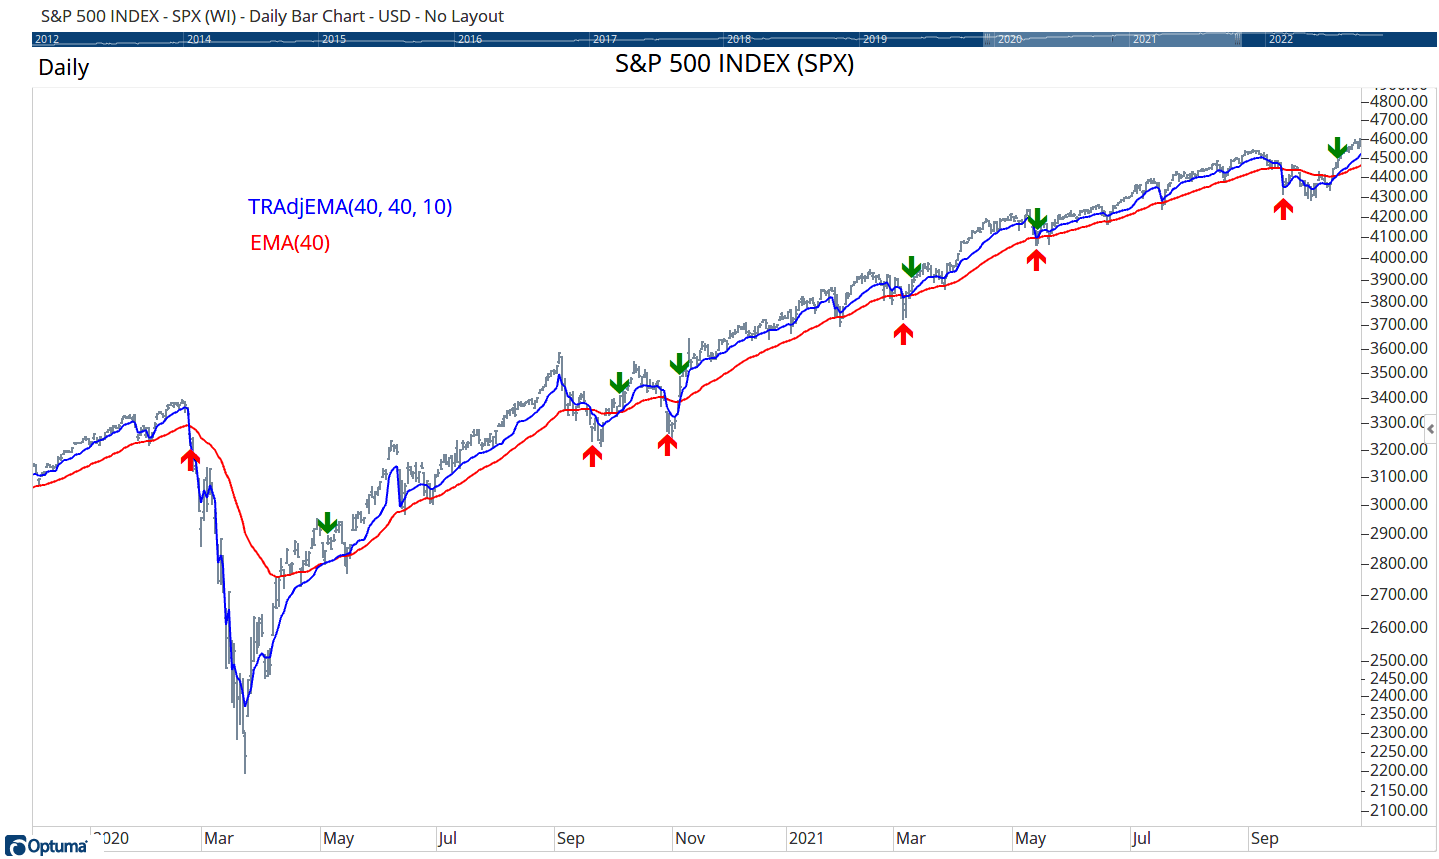
FIGURE 8: OPTUMA. This sample chart displays the true range adjusted exponential moving average (TRAdj EMA).
—support@optuma.com
Optuma.com
BACK TO LIST

AIQ: January 2023
The importable AIQ EDS file based on Vitali Apirine’s article in this issue, “True Range Adjusted Exponential Moving Average,” can be obtained on request via rdencpa@gmail.com. The code is also available below.
!TRUE RANGE ADJUSTED EXPONENTIAL MOVING AVERAGE
!TRadj EMA
!Author: Vitali Apirine, TASC Jan 2023
!Coded by: Richard Denning, 11/18/2022

C is [close].
C1 is valresult(C,1).
H is [high].
L is [low].

Periods is 10.
Pds is 10.
Mltp is 5.
Mltp1 is 2 / (Periods+1).

TH is max(H,C1).
TL is min(L,C1).
TR is abs(TH-TL).
TRadj is (TR-lowresult(TR,Pds))/(highresult(TR,Pds)-lowresult(TR,Pds)).

Mltp2 is TRadj*Mltp.
Rate is Mltp1*(1+Mltp2).

HD if hasdatafor(Periods*2+1) > Periods*2.
DaysInto is ReportDate() - RuleDate().
Stop if DaysInto > Periods.
stopesa is iff(stop,C,TRadj_EMA).

TRadj_EMA is iff(HD,valresult(stopesa,1)+Rate*(C-valresult(stopesa,1)),C).

EMA10 is expavg(C,10).

Status is iff(TRadj_EMA>EMA10,1,0).
ShowValues if 1.
Code for the author’s color study is set up in the AIQ EDS code file. Figure 9 shows the TRadj_EMA(10,10,5) indicator (red jagged line) and the EMA(10) (green smooth line) on a chart of the S&P 500 index to 9/30/2020. The results match the author’s Excel spreadsheet. This indicator runs very slowly in AIQ so you have to be patient for it to load. Also, if you increase the parameters to longer than 10,10,5 it will run even slower.

FIGURE 9: AIQ SYSTEMS. The TRadj_EMA(10,10,5) and EMA(10) are shown on chart of the S&P 500 index.
—Richard Denning
rdencpa@gmail.com
for AIQ Systems
BACK TO LIST
Originally published in the January 2023 issue of
Technical Analysis of STOCKS & COMMODITIES magazine.
All rights reserved. © Copyright 2022, Technical Analysis, Inc.


