
TRADERS’ TIPS
This month, instead of focusing on a particular article in this issue, we asked the software developers who regularly contribute to this section to submit something on a topic of their own choosing, whether that be an idea, technique, or program feature. So here, you will find some custom coding and some helpful pointers for implementing a technique or for using a platform feature.
You can right-click on any chart to open it in a new tab or window and view it at it’s originally supplied size, often much larger than the version printed in the magazine.
The Traders’ Tips section is provided to help the reader implement a selected technique from an article in this issue or another recent issue. The entries here are contributed by software developers or programmers for software that is capable of customization.

Here, we present some TradingView Pine Script code that implements a directional version of Perry Kaufman’s efficiency ratio calculated from intrabars, that is, bars at a lower timeframe than the chart’s.
The intrabar efficiency ratio (IER) is designed to gauge the “efficiency” of intrabar price movement. This is achieved by calculating the ratio of single-bar price changes for the current chart’s timeframe to the sum of absolute intrabar changes. The results are smoothed, which gives an indication of how efficient changes are on the current chart’s timeframe for each bar relative to the lower timeframe “noise” on an average basis. In addition, unlike the standard definition of the efficiency ratio, the IER calculation preserves directional information that allows it to be used as a momentum oscillator.
//  TASC Issue: January 2023 - Vol. 41, Issue 2
//     Article: Intrabar Efficiency Ratio
//  Article By: TradingView
//    Language: TradingView's Pine Script™ v5
// Provided By: PineCoders, for tradingview.com

// For a more complete version of this indicator, see:
// https://www.tradingview.com/script/o8tRZCzT-Intrabar-Efficiency-Ratio/

//@version=5
indicator(
 'TASC 2023.02 Intrabar Efficiency Ratio',
 'IER (TASC)', false, precision = 4)

// Libraries used by the script.
import PineCoders/Time/3 as PCtime
import PineCoders/lower_tf/3 as PCltf


//#region ———————————————————— Constants and Inputs
// ————— Constants
// Colors
color GRAY = #80808080
color GRAY_LT = #f5f3f3

// Strings
string ltfString = "2"
string TAB_TXT = "Uses intrabars at {0}\nAvg intrabars per
 chart bar: {1,number,#.#}\nChart bars covered: {2} of {3}"

// Error Messages
string NI_ERR1 =
 "No intrabar information exists at the '{0}' timeframe."
string NI_ERR2 = "This script uses intrabars;
 the chart's timeframe must be >= 5min."

// ————— Inputs
string in10 = "Line"
string in11 = "Fill"
string in12 = "12"
string in20 = "20"
color icLine1 = input.color(#00BCD4AA, in10, "", in10)
color icLine2 = input.color(#FF5252AA, "", "", in10)
int lenInput = input.int(20, "Length", inline = in10)
color icFill1 = input.color(#00BCD4AA, in11, "", in11)
color icFill2 = input.color(#fffc52aa, "", "", in11)
color icFill3 = input.color(#FF5252AA, "", "", in11)

bool rankWeightInput = input.bool(false,
 "Weigh using relative close changes", "", in12)
int rankLengthInput = input.int(100, "", inline = in12)

bool showInfoBoxInput = input.bool(true, "Show information box")
string infoBoxSizeInput = input.string("small", "Size",
 ["tiny","small","normal","large","huge","auto"], "", in20)
string infoBoxYPosInput = input.string("bottom","↕",
 ["top","middle","bottom"], "", in20)
string infoBoxXPosInput = input.string("left", "↔",
 ["left", "center", "right"], "", in20)
color infoBoxColorInput = input.color(GRAY, "", "", in20)
color infoBoxTxtColorInput = input.color(GRAY_LT, "T", "", in20)
//#endregion


//#region ———————————————————— Calculations
// ———— IER
// Get array of 'close' to 'close' changes in intrabars.
array<float> travels = request.security_lower_tf(
     syminfo.tickerid, ltfString, math.abs(ta.change(close)))
float totalTravels = array.sum(travels)
// Get 'close' to 'close' change of the chart's last two bars.
float chartBarChange = nz(ta.change(close))
// Weight on relative size of the 'close' to 'close' change.
float weight = switch
    rankWeightInput => ta.percentrank(
         math.abs(chartBarChange), rankLengthInput) / 100.0
    => 1.0
// Calculate IER and its MA.
float ier = nz(chartBarChange / totalTravels) * weight
float maMid = ta.alma(ier, lenInput, 0.85, 6)

// ———— Intrabar stats
[intrabars, chartBarsCovered, avgIntrabars] =
 PCltf.ltfStats(travels)
int chartBars = bar_index + 1
//#endregion


//#region ———————————————————— Visuals
plotStyle1 = plot.style_line
plotStyle2 = plot.style_linebr
plotDN = display.none
var float mR = 0.0
mR := math.max(nz(mR), math.abs(maMid)) * 0.6
float upper = math.max(0, maMid)
float lower = math.min(0, maMid)
grad = color.from_gradient(maMid, -mR, mR, icLine1, icLine2)
plot(maMid, "Mid MA", grad, 1, plotStyle1)
plot(maMid, "Mid MA", color.new(grad, 75), 3, plotStyle1)
P1 = plot(upper, "", grad, 1, plotStyle2, display = plotDN)
P2 = plot(lower, "", grad, 1, plotStyle2, display = plotDN)
TSW = maMid >= 0
cUP = TSW ? icFill2 : icFill3
cLO = TSW ? icFill1 : icFill2
fill(P1, P2, TSW ? mR : 0, TSW ? 0 : -mR, cLO, cUP, "")
hline(0)

// Information box.
if showInfoBoxInput
    var table infoBox = table.new(infoBoxYPosInput + "_" +
     infoBoxXPosInput, 1, 1)
    string formattedLtf = PCtime.formattedNoOfPeriods(
     timeframe.in_seconds(ltfString) * 1000)
    string txt = str.format(TAB_TXT, formattedLtf,
     avgIntrabars, chartBarsCovered, chartBars)
    if barstate.isfirst
        table.cell(infoBox, 0, 0, txt,
         text_color = infoBoxTxtColorInput,
         text_size = infoBoxSizeInput,
         bgcolor = infoBoxColorInput)
    else if barstate.islast
        table.cell_set_text(infoBox, 0, 0, txt)

// Runtime errors.
if ta.cum(intrabars) == 0 and barstate.islast
    runtime.error(str.format(NI_ERR1, ltfString))
else if timeframe.in_seconds() < 5 * 60
    runtime.error(NI_ERR2)
//#endregion
This indicator is available on TradingView: https://www.tradingview.com/script/o8tRZCzT-Intrabar-Efficiency-Ratio.
An example chart is shown in Figure 1.
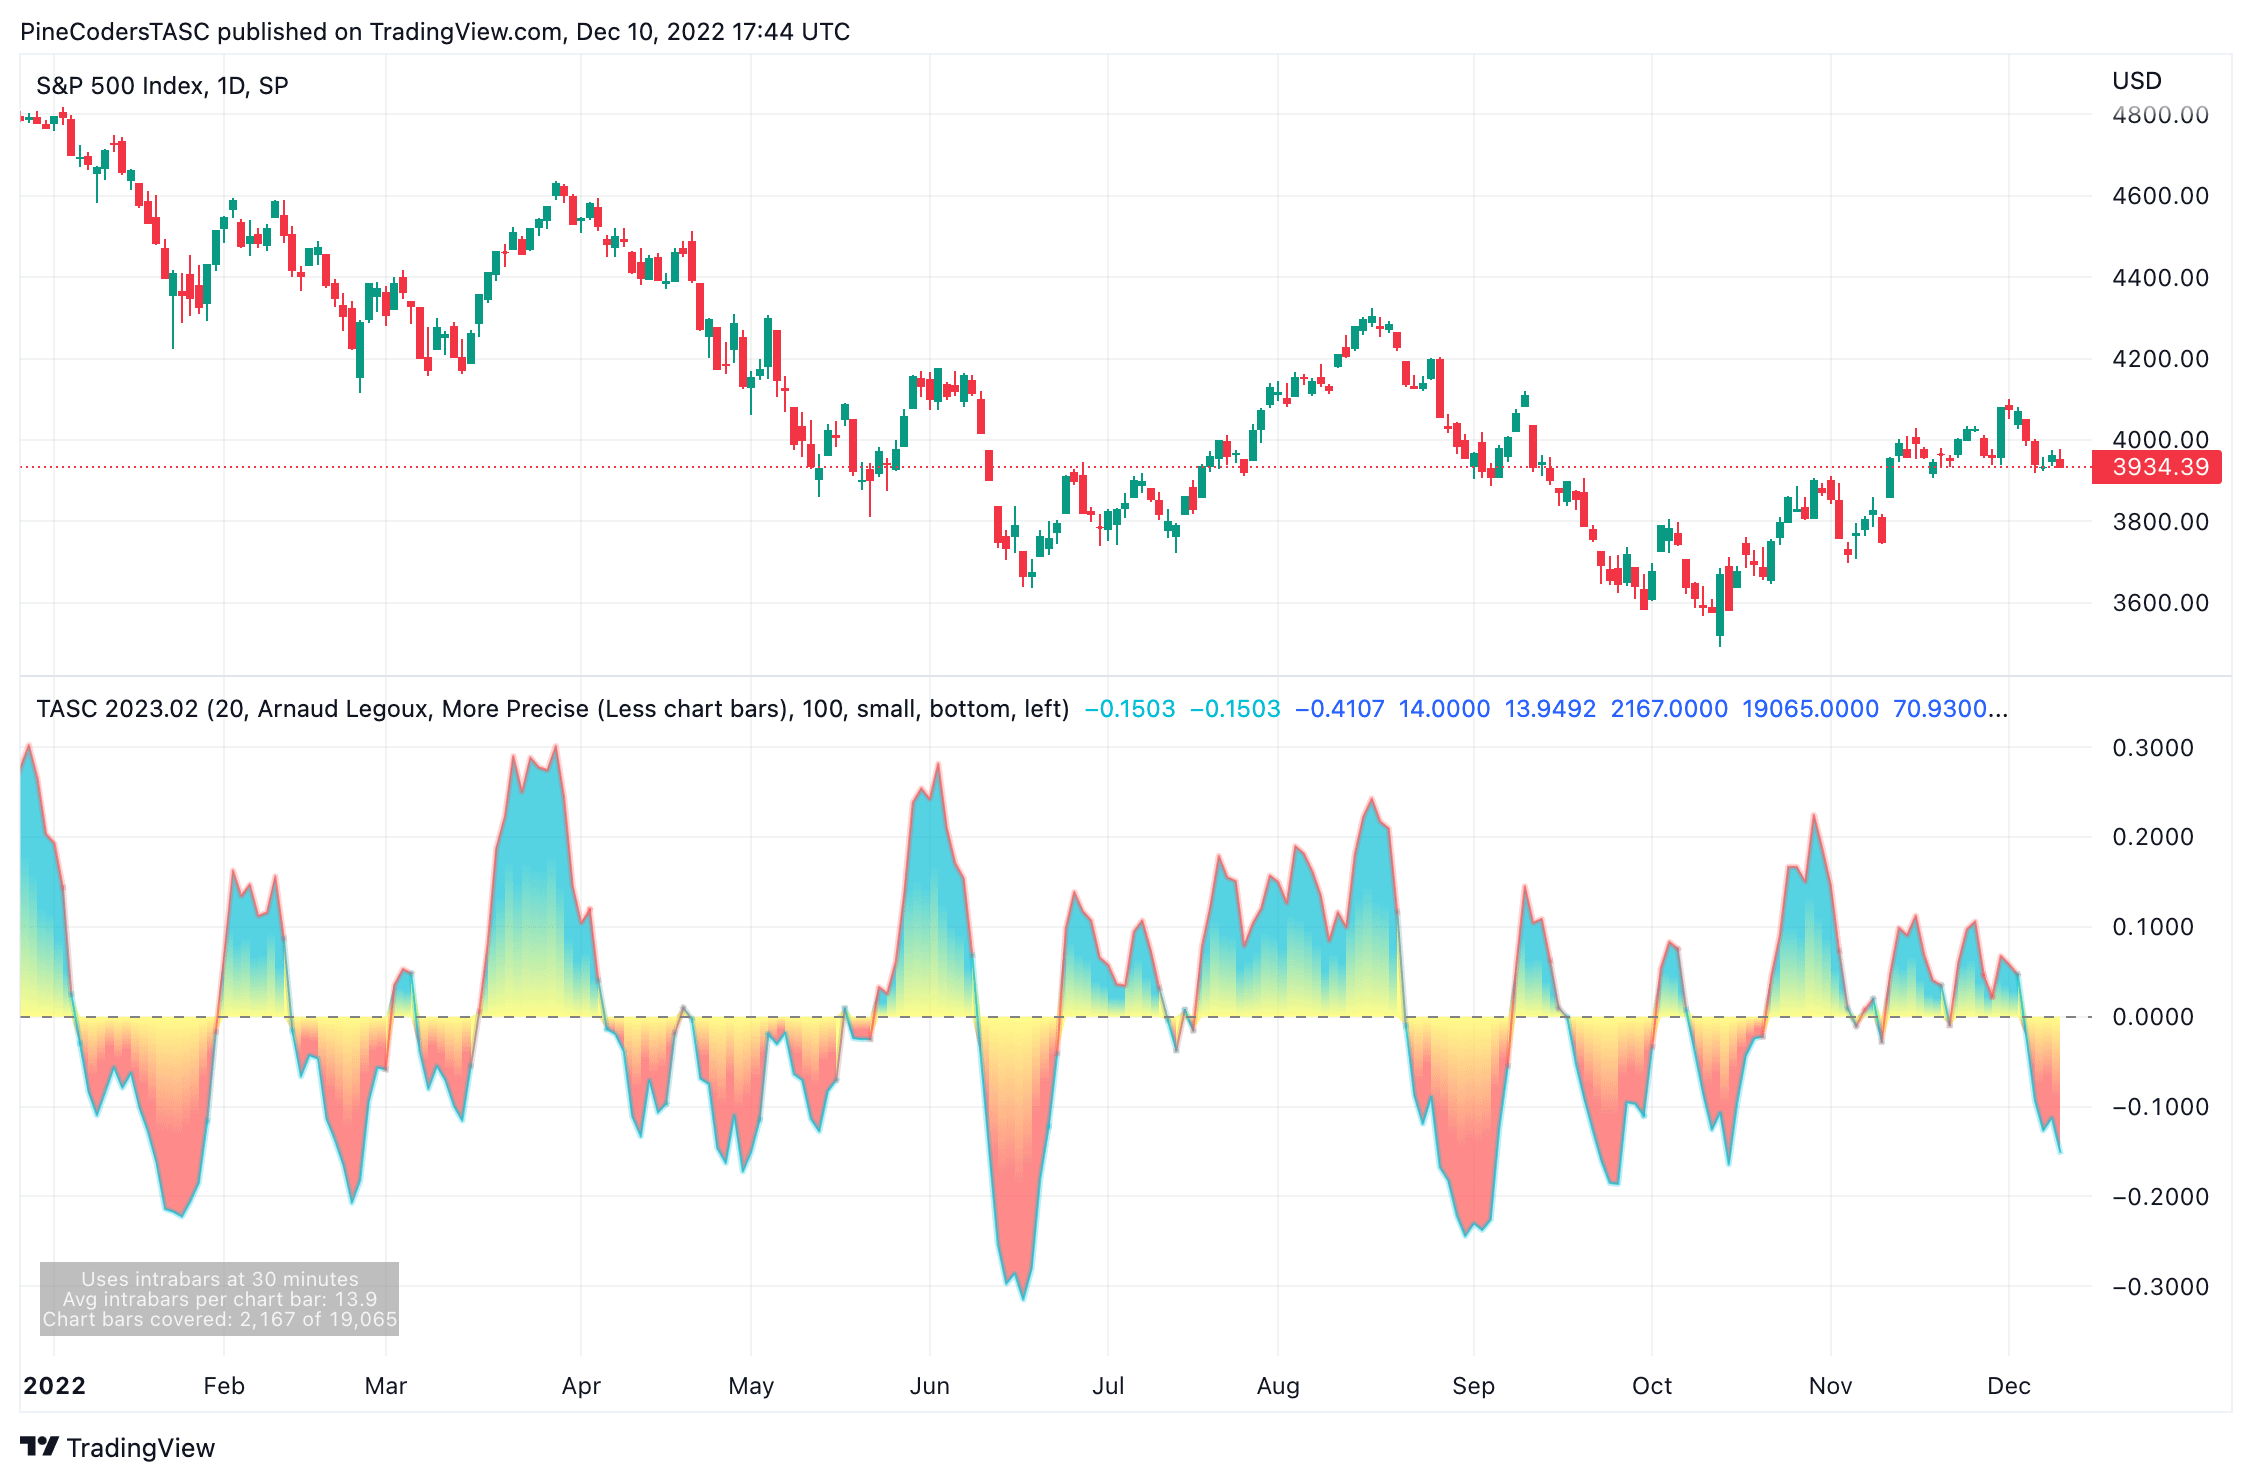
FIGURE 1: TRADINGVIEW. The intrabar efficiency ratio (IER), which is a directional version of Perry Kaufman’s efficiency ratio, is designed to gauge the “efficiency” of intrabar price movement. The IER calculation preserves directional information that allows it to be used as a momentum oscillator.

This month, we’d like to highlight one of Wealth-Lab’s strongest points: chart pattern recognition.
With our Chart Patterns extension, all the “textbook” patterns that traders are familiar with—such as the cup & handle, double bottom, triangles and flags—can be automatically detected and drawn on charts. You can even encode a chart pattern of your own invention—say, the fivefold top—and let the application scan for it.
Progress never stops though. What we consider the killer feature of Wealth-Lab’s Chart Patterns extension are grid-based patterns, which we call PriceGrids. Think of it as computer vision, simply put. A region of a price chart is divided into a 2D matrix (grid) and the grid cells where prices are found are marked with “one” bit and the blank cells as “zero” bits. This process creates a visual pattern of the price dynamic. Encoded into a “fingerprint,” it can then be matched by an indicator returning a confidence factor value that reflects how closely a pattern matches the current price dynamics. As the indicator calculates values bar-by-bar, a high confidence level may suggest that the PriceGrid pattern has emerged.
Defining such patterns is easy: Spot what you think is a price pattern, drag the mouse pointer across a section of the chart and let Wealth-Lab instantly create a PriceGrid for you (Figure 2). But beware: The process can get addicting! Figure 3 shows an example of testing the new pattern on a stock.
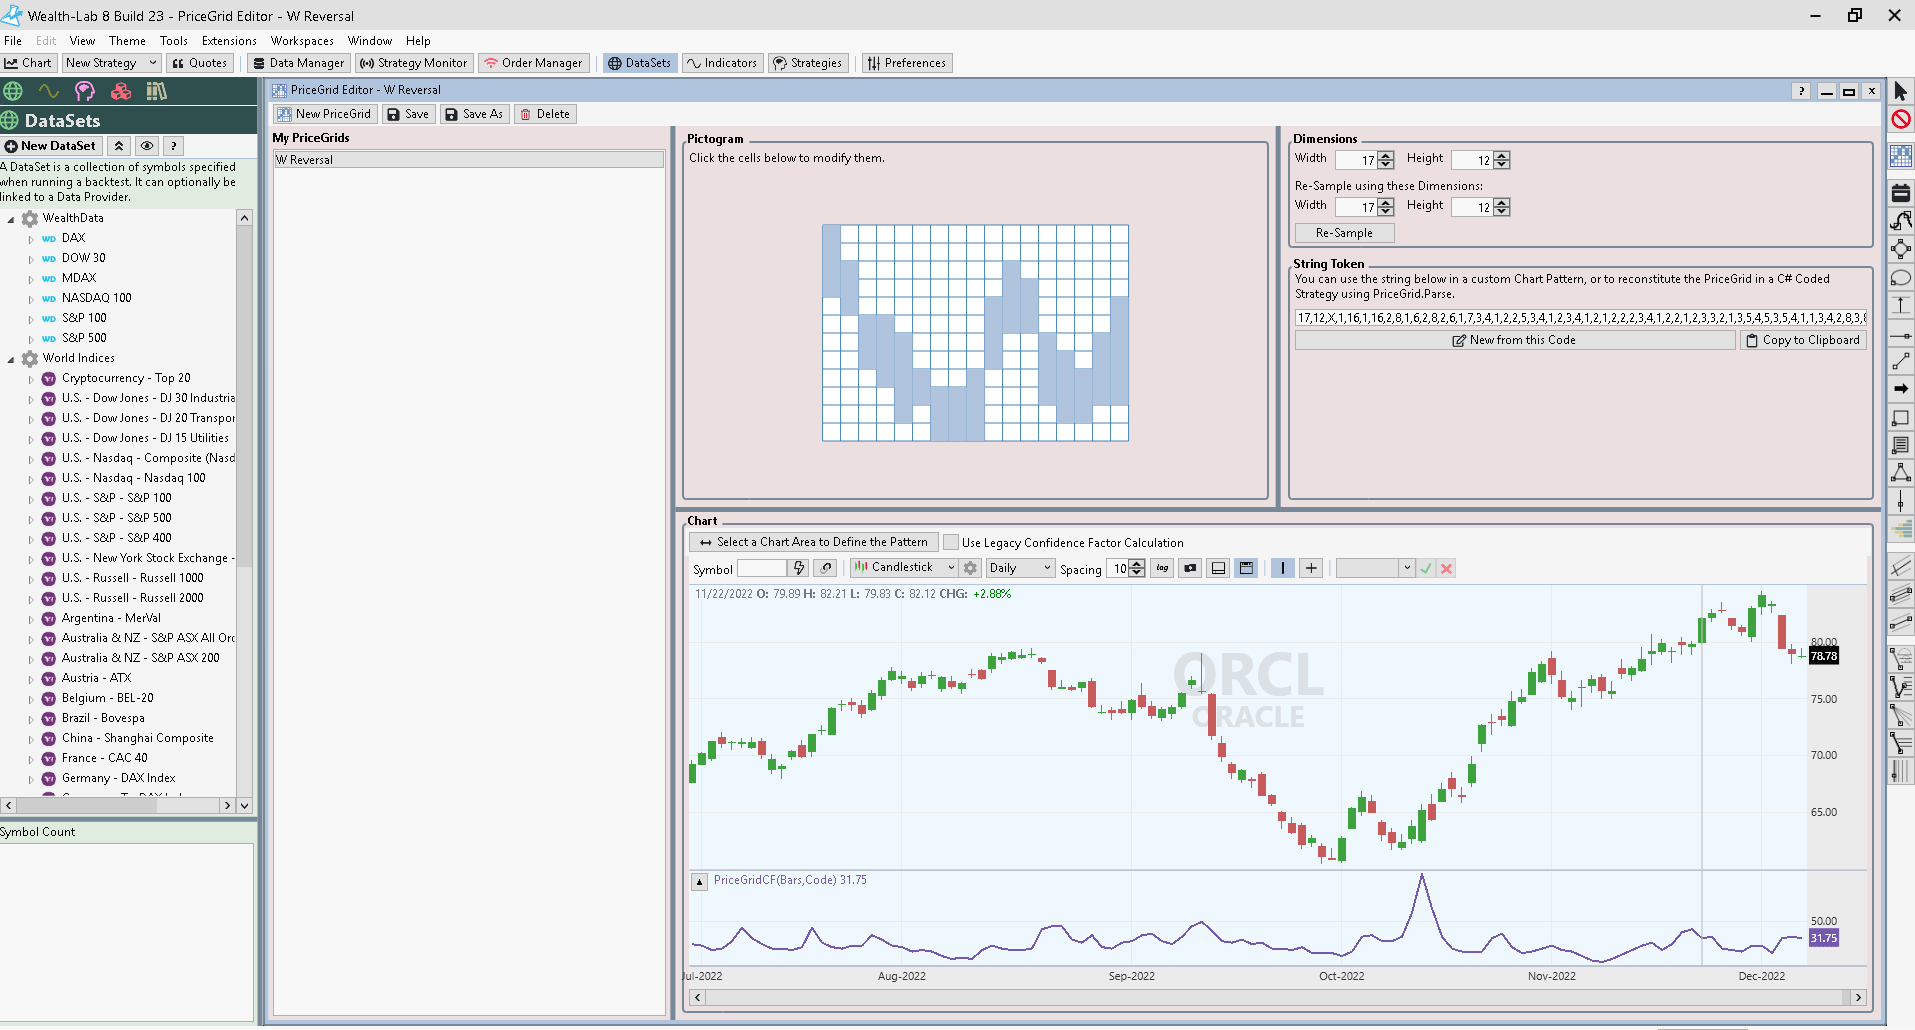
FIGURE 2: WEALTH-LAB. Here is an example of defining a pattern on a daily chart of Oracle (ORCL) using the PriceGrids feature of Wealth-Lab’s Chart Patterns extension.
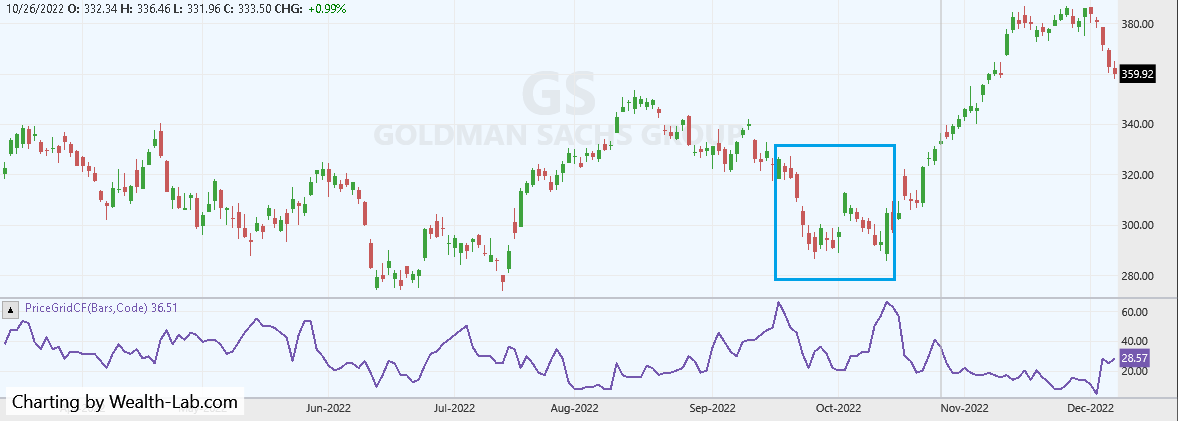
FIGURE 3: WEALTH-LAB. Once a pattern is defined, you can test the pattern on symbols you choose. Here’s an example of testing a newly defined pattern on Goldman-Sachs stock (GS).
And of course, everything of that can be done without having to write a single line of code. Dropping the “Chart Patterns” or “PriceGrids” rule onto a Building Block makes you one step closer to building a strategy that detects chart patterns (Figure 4) and trades them automatically in your brokerage account.
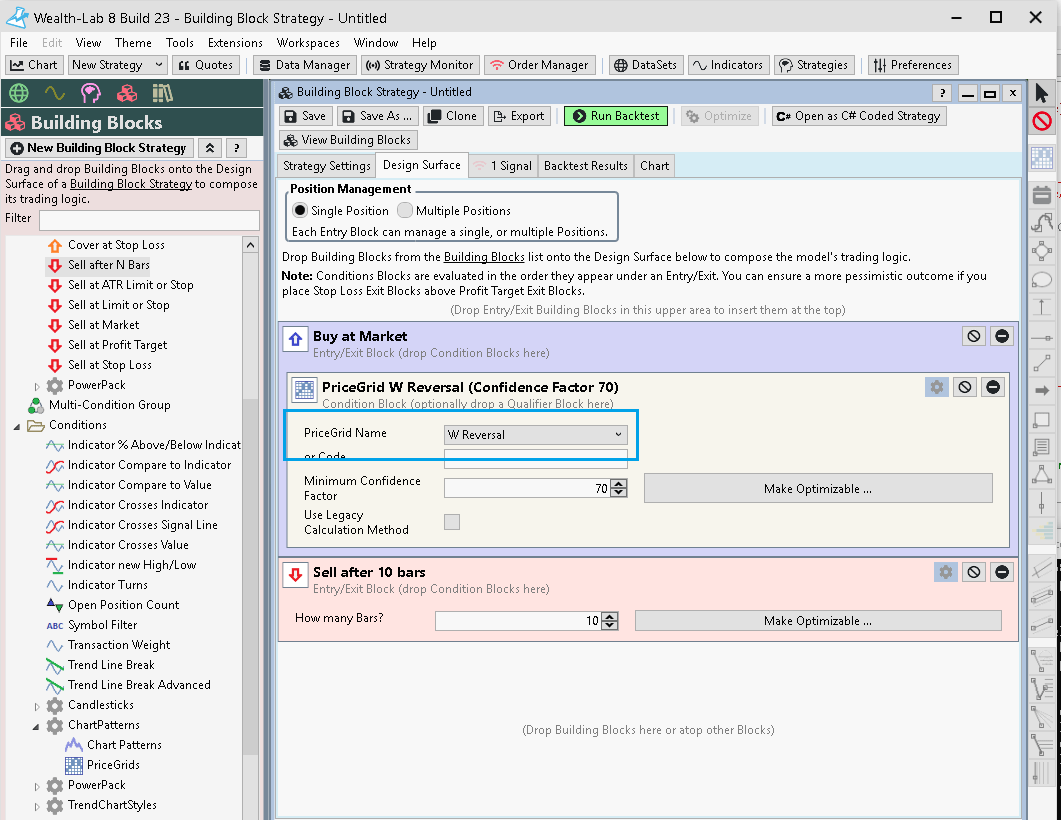
FIGURE 4: WEALTH-LAB. Once you define and test a pattern, you can easily mock up a trading strategy by dropping the “Chart Patterns” or “PriceGrids” rule onto a Building Block. This shows an example of mocking up a trading system based on the new pattern.

One of the more interesting techniques that we find in W.D. Gann’s original hand-drawn charts is that he often plotted the position of planets that he thought were influential to that security—what we call Gann planetary lines (GPLs).
The method he used was to take the planet’s longitudinal angle (from either a heliocentric or geocentric perspective) and convert it into a price using a scaling factor to have it display in the appropriate price range.
This means that 180 degrees could be plotted at $1.80, $18.00, $1800, or even 18c. The next level is then plotted 360 degrees away ($3.60, $36.00, etc. depending on the scaling).
The example in Figure 5 shows the 180-degree GPLs of Mars (in red).
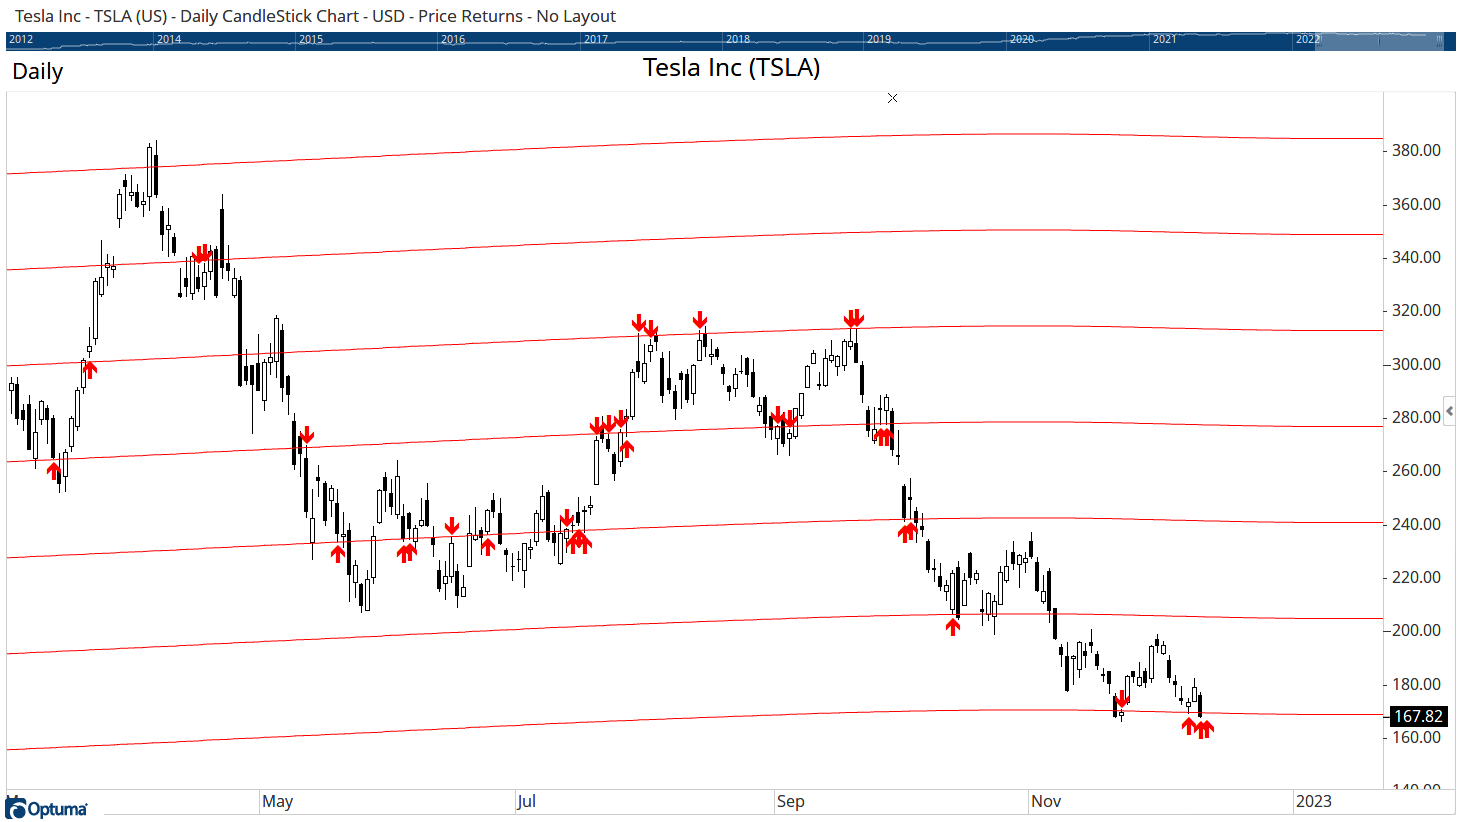
FIGURE 5: OPTUMA. This example of Gann planetary lines (GPLs) shows the 180-degree GPLs of Mars (in red). The method takes the planet’s longitudinal angle and converts it into a price using a scaling factor to have it display in the appropriate price range. Optuma users with the Astro module can use an Optuma script to get alerts based on when price is approaching one of the GPL levels.
Gann planetary line alerts
When looking at these plots, there are times when they behave as very effective support and resistance lines. Alan Oliver (TradingWithGann.com) has done a detailed study on these lines and which planets work best with which markets.
The difficult part has always been to get alerted when price is approaching one of these levels (see Figure 5). For Optuma clients with the Astro module, the following script can do just that:
P1=PVAL(PLANET=[Mars]);
G1=GPA();
ASPECTS(P1, G1, ORB=20.0, ASPECTS=[Conjunction,Opposition], EXACT=False)
The first line of code gets the planet’s angle for each day (i.e., Mars).
The second line of code is a new function that turns price into an angle based on the GPL rules. You can set your own scaling unit in this, but leaving them set to “auto” means it can scan lots of different securities.
The final “ASPECTS” function takes the angles and the price angles (P1 & G1) and allows us to set a tolerance—or orb—and the aspects to be considered (you can do all of them, with “conjunction” being 360 degrees, “opposition” at 180 degrees, “square” at 90 degrees, and so on).
This can then also be used in scans to find any security that is coming up against one of these planetary lines.
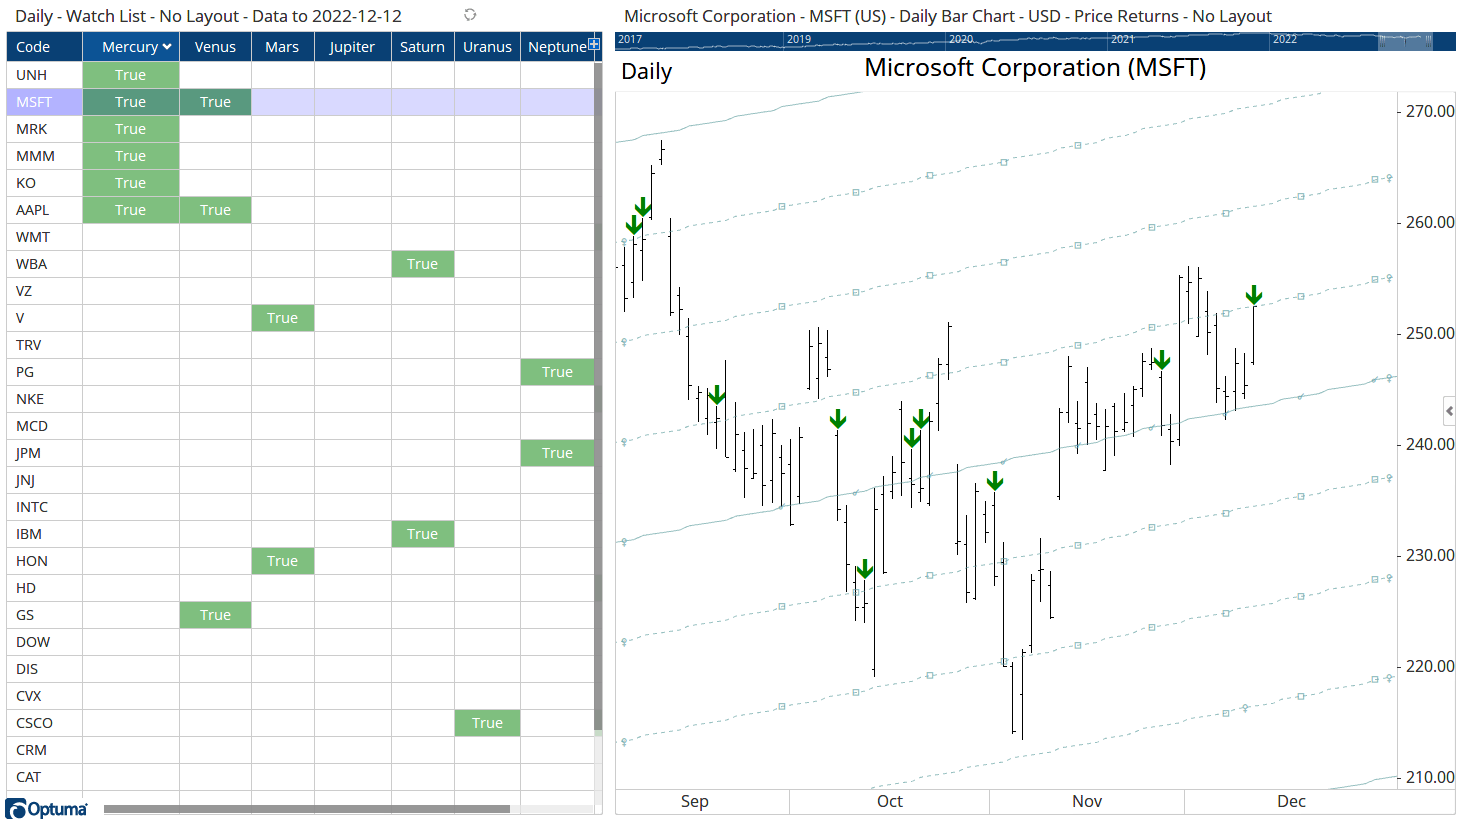
FIGURE 6: OPTUMA. The “ASPECTS” function takes the angles and the price angles (P1 & G1) and allows the user to set a tolerance—or orb—and the aspects to be considered. This can then also be used in scans to find any security that is coming up against one of these planetary lines.

Here, we’ll focus on a robust and useful tool in eSignal to quickly scan the market for trading opportunities. Market Screener Plus (included with a subscription to eSignal) allows the user to integrate technical analysis and fundamental data to scan the markets. You’ll find 20 existing filters (that is, preset defaults) that can be used as a template to create custom scans. These filters can be selected using the dropdown menu at the top of the window (see Figure 7).
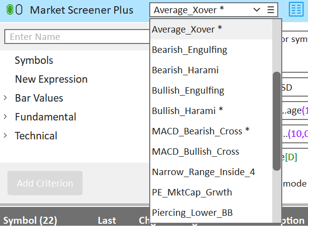
FIGURE 7: eSIGNAL. The Market Screener Plus feature of eSignal, which is included with a subscription to eSignal, allows the user to integrate technical analysis and fundamental data to scan the markets. Using the dropdown menu at the top of the window, the user can select from 20 preset filters that can be used as a template to create custom scans.
In the following example, we’ll use the preset default titled Average_Xover. Once you have selected a default, click the “filter” icon (see Figure 8). The default filters all have descriptions to give you an idea of the type of scan being performed (Figure 9).

FIGURE 8: eSIGNAL. Here’s an example of selecting one of the present filters (Average_Xover).

FIGURE 9: eSIGNAL. Descriptions of the different preset filters available are provided onscreen to provide an idea of the type of scan the filter will perform.
In the left-hand panel you can select additional scan criteria. In this example, we’ll select “exchanges” and click the add criterion button (Figure 10). Alternatively, you can doubleclick the category to add it. Please note that by default, one exchange is available. In order to scan multiple exchanges, you will need to upgrade to either three or five exchanges, which is an add-on service.
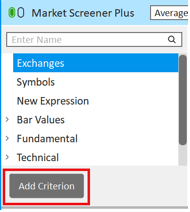
FIGURE 10: eSIGNAL. You can select additional scan criteria in the panel at left by selecting a choice and clicking the “add criterion” button (or doubleclick the category to add it).
From here, click add exchanges to reveal a list of exchanges in the left panel. Choose the exchange you wish to scan, then click apply (Figure 11).

FIGURE 11: ESIGNAL. Click “add exchanges” to reveal a list of exchanges in the left panel. Choose the exchange you wish to scan, then click “apply.”
The scan button can be used to periodically update the results, which are displayed in the window (Figure 12).
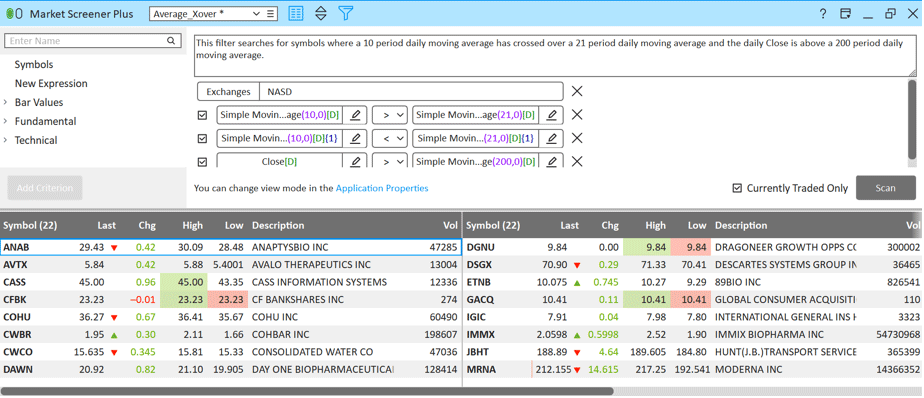
FIGURE 12: ESIGNAL. The scan button can be used to periodically update the results, which are displayed in the window.
To create a new filter from scratch, click the menu icon (highlighted by the red box drawn on Figure 13) followed by “new filter.” Choose “save filter as” to assign the filter a new name and save it.
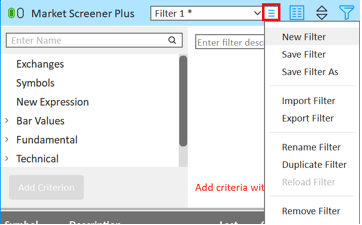
FIGURE 13: ESIGNAL. To create a new filter from scratch, click the menu icon (highlighted by the red box) followed by “new filter.” Choose “save filter as” to assign the filter a new name and save it.
Back in the left panel, choose from the existing categories:
Since Market Screener Plus provides the same functionality as a watchlist window, you can also run built-in studies, formulas, and custom expressions (based on any of the values in the Market Screener columns) to further analyze and sort the results of your scans.
In summary, we think you’ll find Market Screener Plus to be an invaluable tool to scan and analyze entire markets (domestic and global) using the very same tools applied to any other window in eSignal.