TRADERS’ TIPS
March 2023

For this month’s Traders’ Tips, the focus is John F. Ehlers’ article in this issue, “Every Little Bit Helps.” Here, we present the March 2023 Traders’ Tips code with possible implementations in various software.
You can right-click on any chart to open it in a new tab or window and view it at it’s originally supplied size, often much larger than the version printed in the magazine.
The Traders’ Tips section is provided to help the reader implement a selected technique from an article in this issue or another recent issue. The entries here are contributed by software developers or programmers for software that is capable of customization.

TradeStation: March 2023
In his article in this issue, “Every Little Bit Helps,” author John Ehlers proposes that noise can be reduced merely by averaging the open and close of a bar instead of only using the closing price. The data sampling example presented in the article compares the traditional RSI using close data to one calculated using the average of the open and the close.
Several built-in TradeStation indicators allow a price to be specified as an input used for calculations. For example, the built-in Mov Avg 1 Line indicator’s price input can be changed from close to (close + open) / 2. In fact, the built-in RSI indicator itself has a price input that can similarly be changed.
Indicator: Data Sampling Test
// TASC MAR 2022
// Data Sampling Test
// (C) John F. Ehlers

variables:
	CTest( 0 ),
	OCTest( 0 );

CTest = RSI(Close, 14);
OCTest = RSI((Open + Close) / 2, 14);

Plot1(CTest, "W/O Sampling");
Plot2(OCTest, "W/ Sampling");
A sample chart is shown in Figure 1.
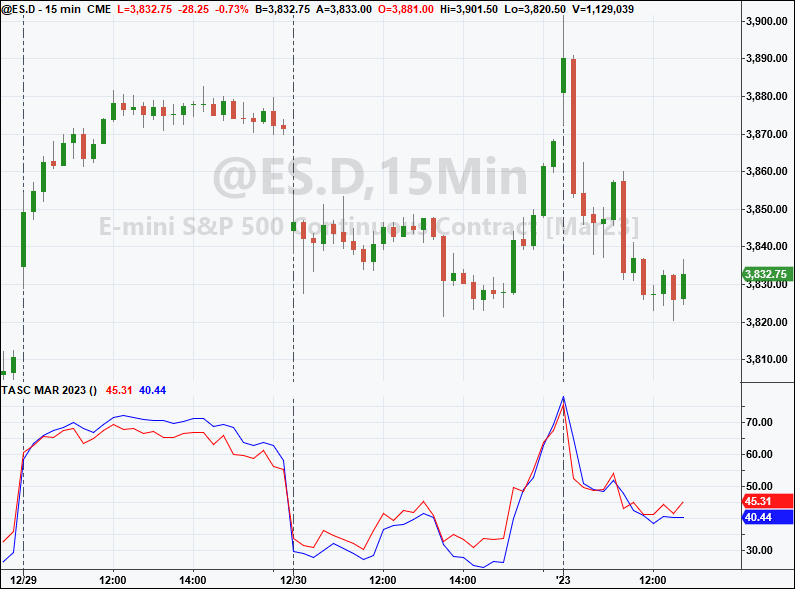
FIGURE 1: TRADESTATION. This shows a TradeStation 15-minute chart of the continuous emini S&P 500 contract (symbol @ES.D) with the indicator applied. Shown in red is the sampling using closing prices. Shown in blue is the sampling using the average of the open and close.
This article is for informational purposes. No type of trading or investment recommendation, advice, or strategy is being made, given, or in any manner provided by TradeStation Securities or its affiliates.
—John Robinson
TradeStation Securities, Inc.
www.TradeStation.com
BACK TO LIST

TradingView: March 2023
Here is TradingView Pine Script code implementing the numerical example from John Ehlers’ article in this issue, “Every Little Bit Helps.” Taking the RSI as a test indicator, the author demonstrates the noise reduction in the data by using the average of the open and close instead of using just the closing price.
The Pine Script code provided here implements this technique, and also uses a color scheme that highlights both the RSI value and the difference between the two RSI data streams.
// TASC Issue: March 2023 - Vol. 41, Issue 3
// Article: Every Little Bit Helps
// Article By: John F. Ehlers
// Language: TradingView's Pine Script™ v5
// Provided By: PineCoders, for tradingview.com

//@version=5
indicator("TASC 2023.03 Every Little Bit Helps", "ELBH",
    explicit_plot_zorder = true)

// External libraries:
import kaigouthro/hsvColor/15 as h

// Constant variables:
color NTRL = #888888

// Input panel groups, titles and inline references:
string g0  = 'RSI Options:'
string g1  = 'Color and Gradient Options:'
string it0 = 'RSI Length'
string it1 = 'Hue High'
string it2 = 'Hue Low'
string it3 = 'Background Opacity'
string it4 = 'RSI Threshold Value'
string t0  = 'Hue varies from 0 to 360, with red at 0 '+
            'and 360, green at 120, blue at 240.'
string t1  = 'Specifies the sensitivity of the gradient '+
            'to the RSI value.'

// Input options:
int len  = input.int(14, it0,1,1000,1,'','',g0)
int hue1 = input.int(150,it1,0,360, 15,t0,'',g1)
int hue2 = input.int(0 , it2,0,360, 15,'','',g1)
int op   = input.int(90, it3,0,100, 1, '','',g1)
int hbot = input.int(10, it4,5,40,  1, t1,'',g1)

// Indicators:
float rsiC  =  ta.rsi(close,  len)
float oc2   =  math.avg(open, close)
float rsiOC =  ta.rsi(oc2,    len)

// Color and gradient related calculations:
int   htop = 100 - hbot
int   span = htop - hbot
float smR  = (rsiOC/100) * span
float pt1  = smR + hbot
float pt2  = (pt1+100)/3
float br   = h.bright(chart.bg_color) < .7 ?.9:.5
float ez   = h.easeOut(math.abs((rsiOC-pt2)/span-1))
float fh   = math.max(rsiOC, rsiC, hbot)
float fl   = math.min(rsiOC, rsiC, htop)
o(col, o)  => color.new(col, o)
color c1   = h.hsv(h.stepHue(-smR, hue2, 1/ez,2),1,br, 1)
color c2   = h.hsv(h.stepHue( smR, hue1, 1/ez,2),1,br, 1)
color fade = h.hsv_gradient (rsiOC,  hbot, htop,  c1, c2)
color hc   = h.stepGradient (rsiOC, -pt1, br, fade, c1)
color lc   = h.stepGradient (rsiOC,  pt1, br, c2,  fade)

// Plots:
p0   = plot(rsiOC, 'rsi(OC)', o(fade,10), 1 )
p1   = plot(rsiC,  'rsi(C)',  na)
mid  = plot(50,    '50',   o(NTRL, 90), 2)
zero = plot(0,     '0',    o(c1, op), 1)
hund = plot(100,   '100',  o(c2, op), 1)
fill(p1, hund, rsiC, 150 , o(fade,op), o(hc,br*90))
fill(p0, zero, rsiC, -50 , o(fade,op), o(lc,br*90))
fill(p0, p1, fh,fl, o(fade, 60), o(fade,70))
The indicator is available on TradingView from the PineCodersTASC account: https://www.tradingview.com/u/PineCodersTASC/#published-scripts
An example chart is shown in Figure 2.
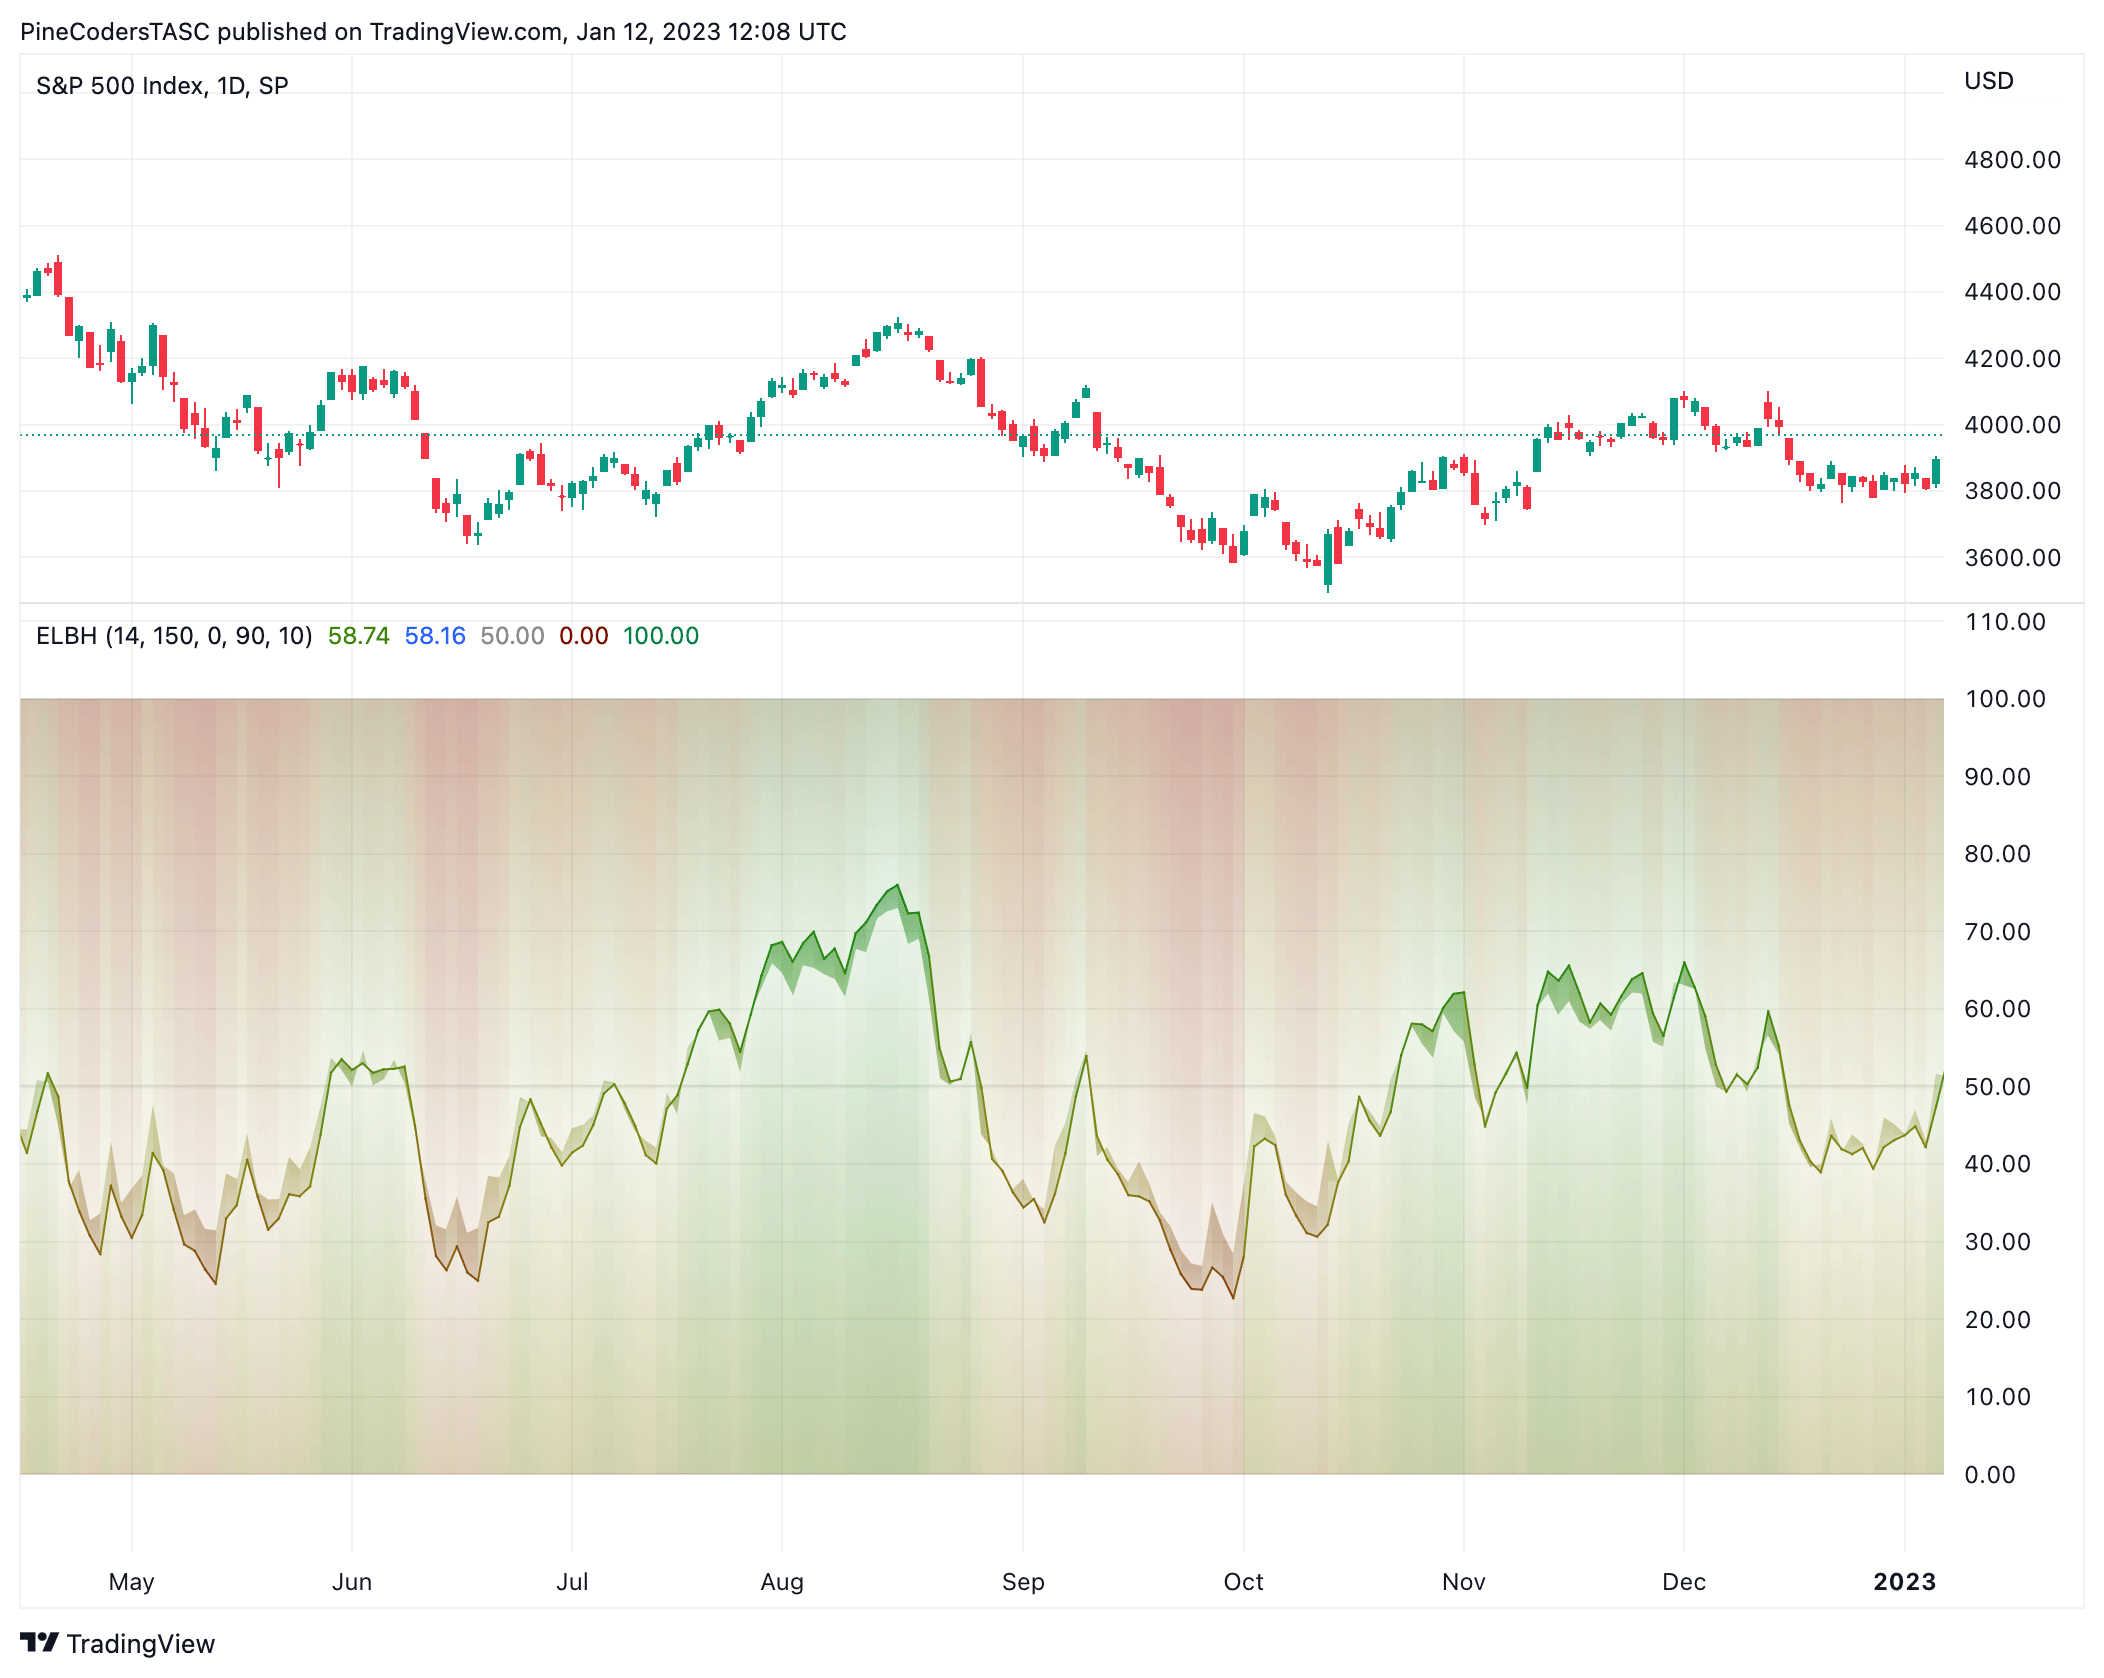
FIGURE 2: TRADINGVIEW. In this example TradingView chart, the color scheme highlights both the RSI value and the difference between the two RSI data streams, so you can more easily compare. One RSI datastream uses close data only while the other datastream uses an average of the open and the close as calculated by the Pine Script code provided.
—PineCoders, for TradingView
www.TradingView.com
BACK TO LIST

thinkorswim: March 2023
We have put together a study based on the article by John Ehlers in this issue, “Every Little Bit Helps: Averaging The Open And Close To Reduce Noise.” We built the study referenced by using our proprietary scripting language, thinkscript. To ease the loading process, simply click https://tos.mx/Wqoyzmb or enter the URL in setup → open shared item from within thinkorswim, then choose view thinkScript study and name it “RSI_DataSamplingComparison” or whatever name you prefer and can identify. You can then add the study to your charts from the edit studies menu from within the charts tab and then select studies.
Figure 3 shows our version of the study on a two-day 15-minute chart of the S&P emini futures contract. Please see Ehlers’ article in this issue for how to interpret the indicator.
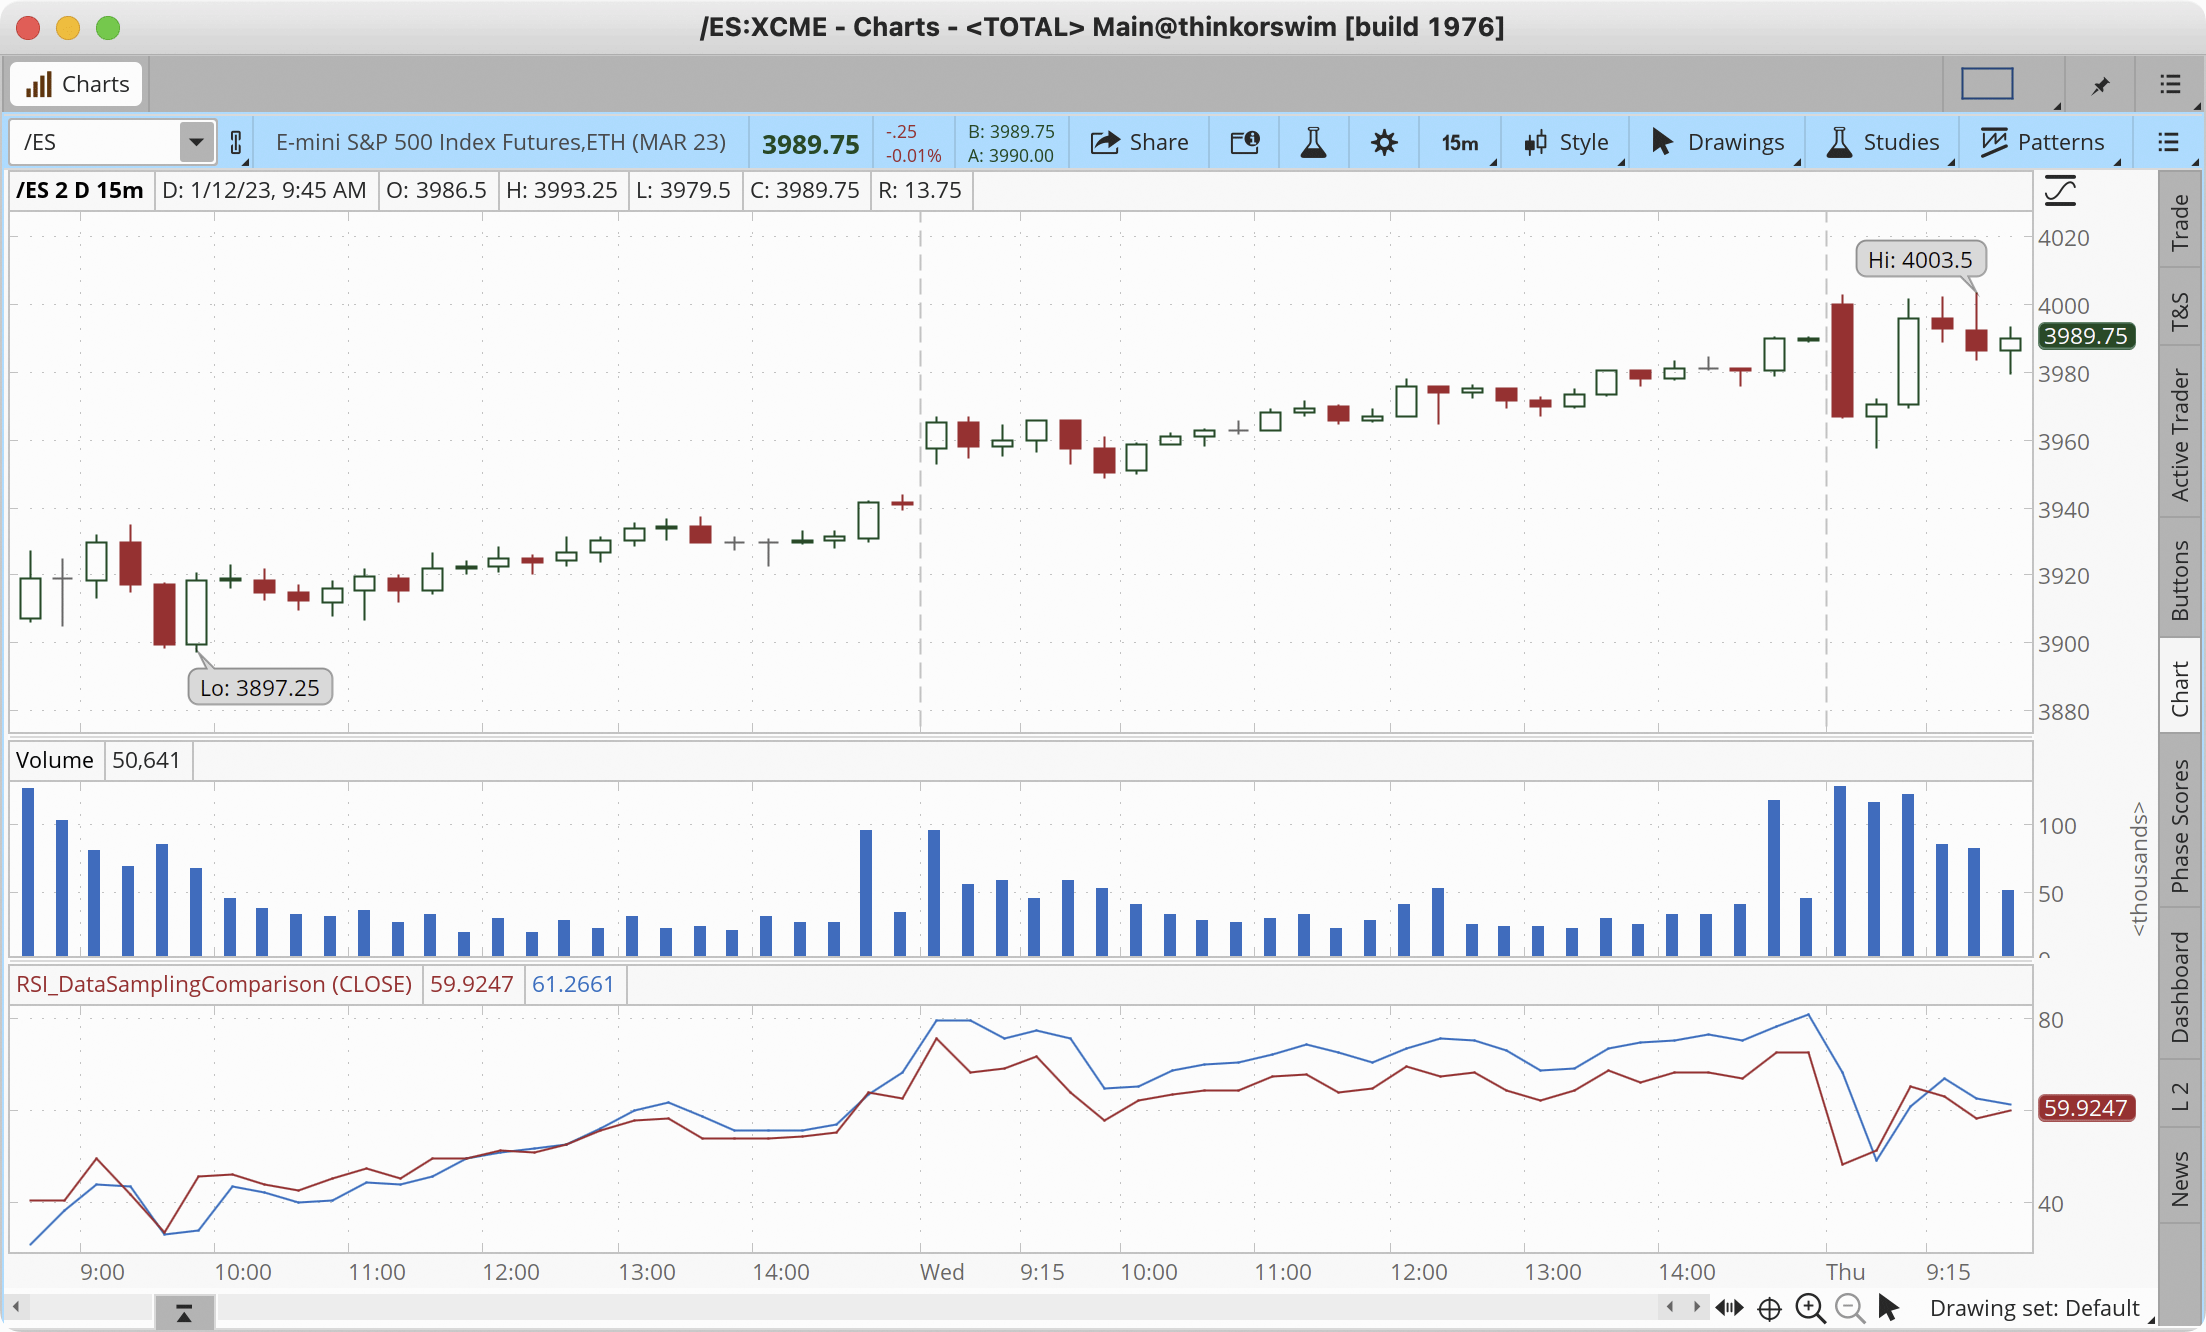
FIGURE 3: THINKORSWIM. Here, the data sampling comparison study is demonstrated on a two-day 15-minute chart of the S&P emini futures contract.
—thinkorswim
A division of TD Ameritrade, Inc.
www.thinkorswim.com
BACK TO LIST

Wealth-Lab.com: March 2023
In “Every Little Bit Helps” in this issue, John Ehlers suggests a simple method to reduce data noise by using an average of the open and close instead of using just the closing price.
Techniques such as this come off-the-shelf in Wealth-Lab 8. With any indicator (not just the RSI) that allows customization of time series, traders can pick many flavors of the average price without having to program anything. In addition to OHLCV, here are possible choices ranging from conventional to exotic:
- (Open+Close)/2 [This choice is demonstrated on the chart in Figure 4 as “AveragePriceOC”
- (H+L)/2
- (H+L+C)/3
- (O+H+L+C)/4
- (H+L+C+C)/4 [an average price with double-weight closing price]
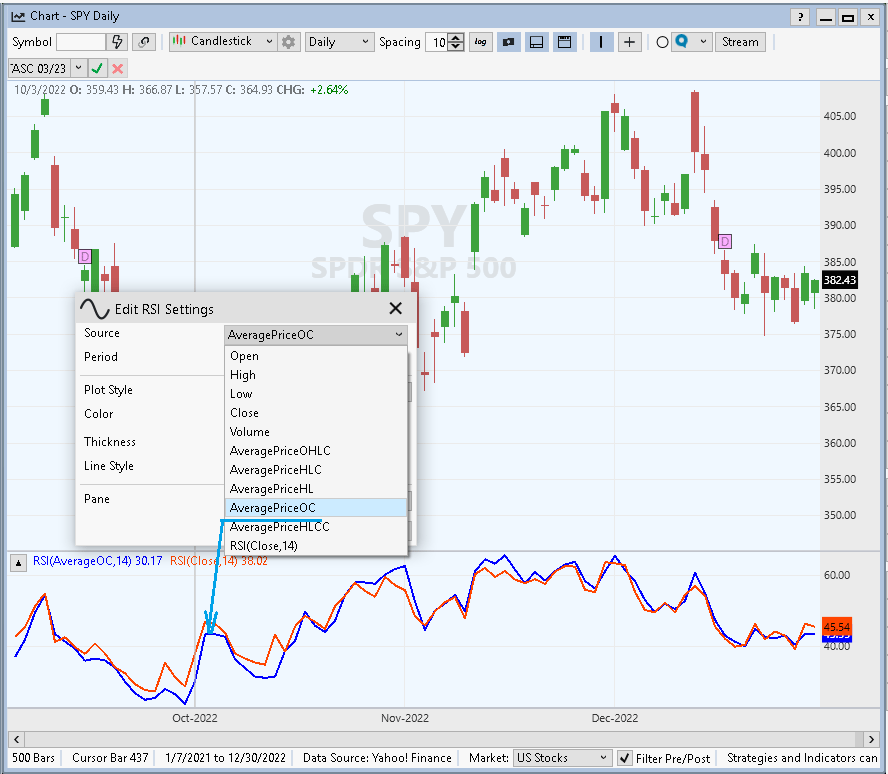
FIGURE 4: WEALTH-LAB. This demonstrates creating an RSI based on the open and close average prices, plotted on a daily chart of S&P 500 SPDR ETF (SPY).
—Gene Geren (Eugene)
Wealth-Lab team
www.wealth-lab.com
BACK TO LIST

NinjaTrader: March 2023
The example RSI indicator discussed in John Ehlers’ article in this issue, “Every Little Bit Helps: Averaging The Open And Close To Reduce Noise,” is available for download from the following links for NinjaTrader 8 and for NinjaTrader 7:
Once the file is downloaded, you can import the indicator into NinjaTrader 8 from within the control center by selecting Tools → Import → NinjaScript Add-On and then selecting the downloaded file for NinjaTrader 8. To import into NinjaTrader 7, from within the control center window, select the menu File → Utilities → Import NinjaScript and select the downloaded file.
You can review the indicator’s source code in NinjaTrader 8 by selecting the menu New → NinjaScript Editor → Indicators from within the control center window and selecting the file you wish to examine. You can review the indicator’s source code in NinjaTrader 7 by selecting the menu Tools → Edit NinjaScript → Indicator from within the control center window and selecting the file to examine.
NinjaScript uses compiled DLLs that run native, not interpreted, which provides you with the highest performance possible.
A sample chart displaying both the original RSI based on close-only data and the RSI based on averaged data is shown in Figure 5.
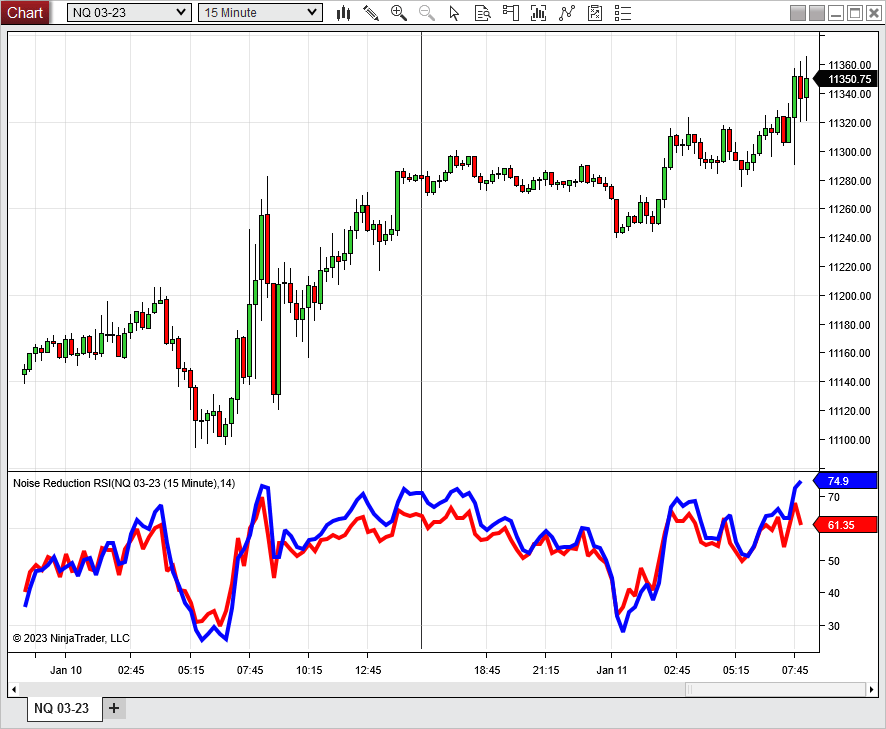
FIGURE 5: NINJATRADER. This 15-minute chart of the Nasdaq 100 emini displays both the RSI based on close-only data and an RSI based on averaged data.
—Chelsea Bell
NinjaTrader, LLC
www.ninjatrader.com
BACK TO LIST

Neuroshell Trader: March 2023
In “Every Little Bit Helps” in this issue, John Ehlers proposes averaging the open and close as inputs to some indicators to help reduce noise, instead of using only the close. This technique can be easily implemented in NeuroShell Trader. To implement a comparison between the RSI and the open-close-averaged RSI, select “new indicator” from the insert menu, and use the indicator wizard to create the indicators as follows:
RSI( Close, 14)
RSI( Avg2(Open,Close), 14)
Figure 6 shows both the RSI and the open-close-averaged RSI on a chart for comparison.
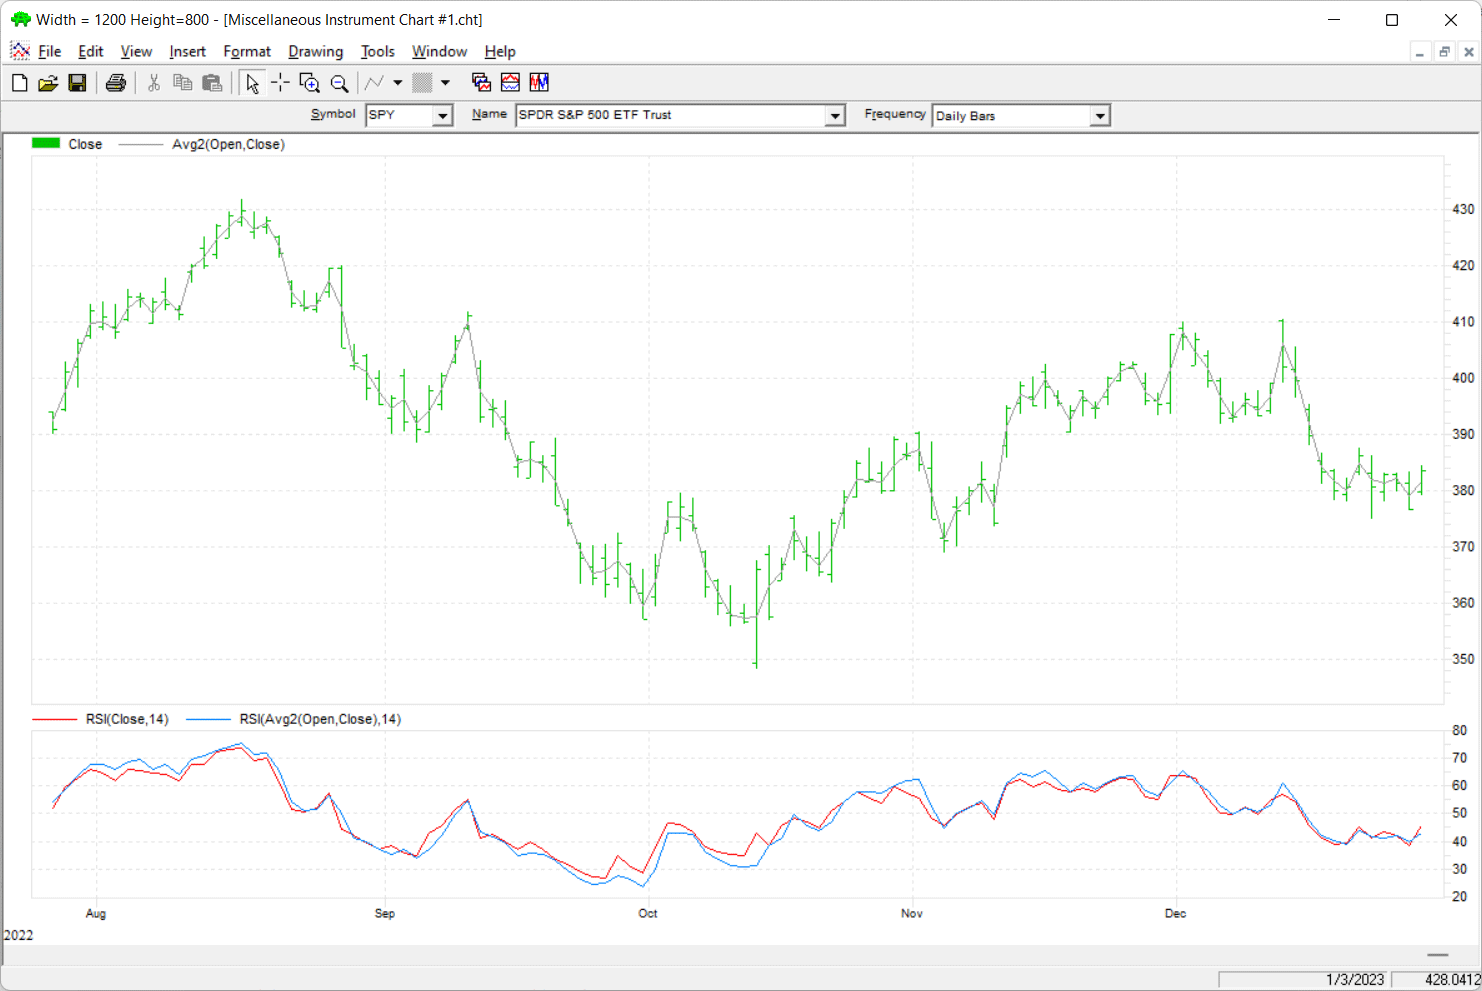
FIGURE 6: NEUROSHELL TRADER. This NeuroShell Trader chart shows a comparison between the RSI and the open-close-averaged RSI for SPY.
Users of NeuroShell Trader can go to the Stocks & Commodities section of the NeuroShell Trader free technical support website to download a copy of this or any previous Traders’ Tips.
—Ward Systems Group, Inc.
sales@wardsystems.com
www.neuroshell.com
BACK TO LIST

AIQ: March 2023
The importable AIQ EDS file based on John Ehlers’ article in this issue, “Every Little Bit Helps,” can be obtained on request via rdencpa@gmail.com. The code is also available below.
!Every Little Bit Helps
!Author: John F. Ehlers, TASC Mar 2023
!Coded by: Richard Denning, 1/12/2023

!Data Sampling Test
!(c) John Ehlers 2022

!INPUTS:
W1 is 14. !Wilder RSI length
W2 is 14. !Ehlers RSI length

!RSI Wilder code:
U is [close]-val([close],1).
D is val([close],1)-[close].
L1 is 2 * W1 - 1.
AvgU is ExpAvg(iff(U>0,U,0),L1).
AvgD is ExpAvg(iff(D>=0,D,0),L1).
RSIwilder is 100-(100/(1+(AvgU/AvgD))).

!Ehlers RSI code:
OCavg is ([open] + [close])/2.
Uoc is  OCavg-valresult(OCavg,1).
Doc is valresult(OCavg,1)-OCavg.
L2 is 2 * W2 - 1.
AvgU2 is ExpAvg(iff(Uoc>0,Uoc,0),L2).
AvgD2 is ExpAvg(iff(Doc>=0,Doc,0),L2).
RSIoc is 100-(100/(1+(AvgU2/AvgD2))).

!CTest is RSIwilder.
!OCTest is RSIoc.

BuyRSIwilder if RSIwilder < 20 and valrule(RSIwilder >= 20,1).
ExitRSIwilder if RSIwilder > 80 or {Position days}>=20.

BuyRSIoc if RSIoc < 20 and valrule(RSIoc >= 20,1).
ExitRSIoc if RSIoc > 80 or {Position days}>=20.
Code for the author’s indicators are set up in the AIQ EDS code file. Figure 7 shows the EDS module backtest results using the RSI original indicator. Figure 8 shows the EDS module backtest results using the modified version of the RSI indicator over a 10-year period using NASDAQ 100 stocks. The comparison suggests that some of the metrics improve using the modified version and a few are worse.
The system rules are:
- Buy when the RSI crosses down below 20
- Sell when the RSI is crosses above 80 or after 20 trading days
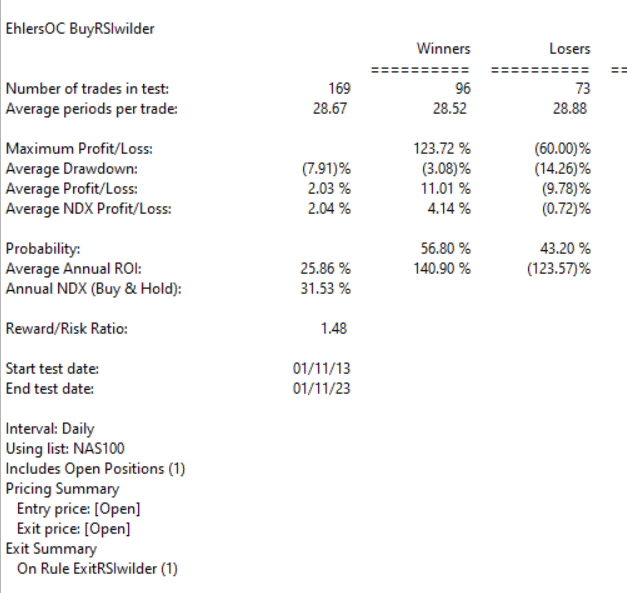
FIGURE 7: AIQ. This shows example backtest results for classic RSI trading system rules, based on closing data, over a 10-year period using NASDAQ 100 stocks.
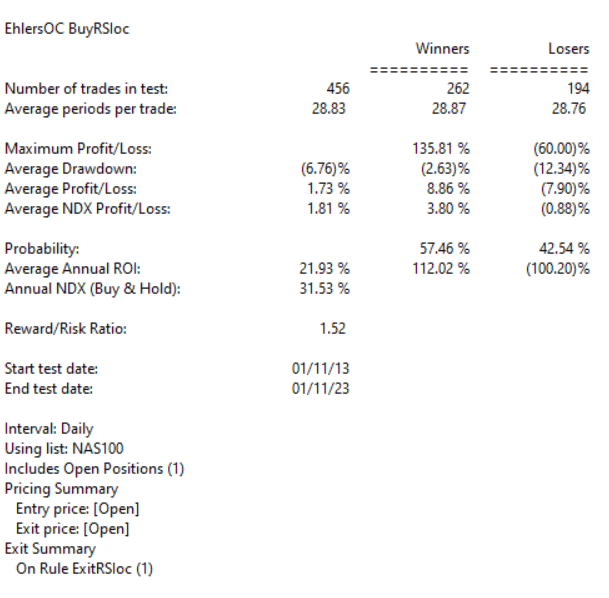
FIGURE 8: AIQ. This shows example backtest results for the RSI trading system rules, this time based on data that averages the open and close instead of using just the closing price data, over a 10-year period using NASDAQ 100 stocks.
—Richard Denning
rdencpa@gmail.com
for AIQ Systems
BACK TO LIST

Trade Navigator: March 2023
In “Every Little Bit Helps: Averaging the Open and Close to Reduce Noise” in this issue, John Ehlers suggests using an average of the open and close data instead of just close data in your indicators to slightly reduce noise in the data.
We have created a special file to make it easy to download a library into Trade Navigator that is based on this article. The file name is “SC202303.”
To install this new library into Trade Navigator, click on Trade Navigator’s file dropdown menu, then select “update data.” Next, select download special file, then erase the word “upgrade” and type in “SC202303” (without the quotes), then click the start button. When prompted to upgrade, click yes. If prompted to close all software, click continue. Your library will now download.
This library contains a template named “S&C March 2023,” a study named “data sampling,” and two indicators named “CTest” and “OCTest.”
The template allows you to modify your chart with a prebuilt indicator package and settings. To use it, open the charting pulldown menu, select the templates command, then on the submenu that opens, select the “S&C March 2023” template. If you are prompted to save the current chart settings as a template, your answer will depend on whether you have made any changes to your current chart template that you would like to keep. If you choose “yes,” changes will be saved in the prior template before switching to the new “S&C March 2023” template.
You can insert indicators onto your chart by opening the charting dropdown menu, select the add to chart command, then on the indicators tab, find your named indicator, select it, then click on the add button. Repeat this procedure for additional indicators if you wish.
You can apply the “data sampling” study to your chart by opening the charting menu, select the add to chart command, and click on the studies tab. Here you will find the study in question. Select it by clicking on it, then clicking on the add button.
If you need any assistance, our friendly technical support staff will be happy to help via phone or via live chat through our website.
—Genesis Financial Data
Tech support 719 884-0245
www.TradeNavigator.com
BACK TO LIST

The Zorro Project: March 2023
In his article in this issue, John Ehlers proposes to use the average of the open and close, rather than the close price, for technical indicators. The advantage could be a certain amount of noise reduction.
On intraday bars, the open-close average is similar to a two-day simple moving average (SMA2). It makes the data a bit smoother, but at the cost of additional lag by half a bar.
The script given here, in C for the Zorro platform, compares the standard RSI with the open-close average RSI on the S&P 500 index with 15-minute bars.
void run()
{
  BarPeriod = 15;
  StartDate = 20220629;
  EndDate = 20220712;
  asset("SPX500");

  vars OC = series((priceO()+priceC())/2);
  plot("RSI(Close)",RSI(seriesC(),14),NEW,RED);
  plot("RSI(OC)",RSI(OC,14),0,BLUE);
}
We can indeed see some noise reduction in the resulting chart, shown in Figure 9.
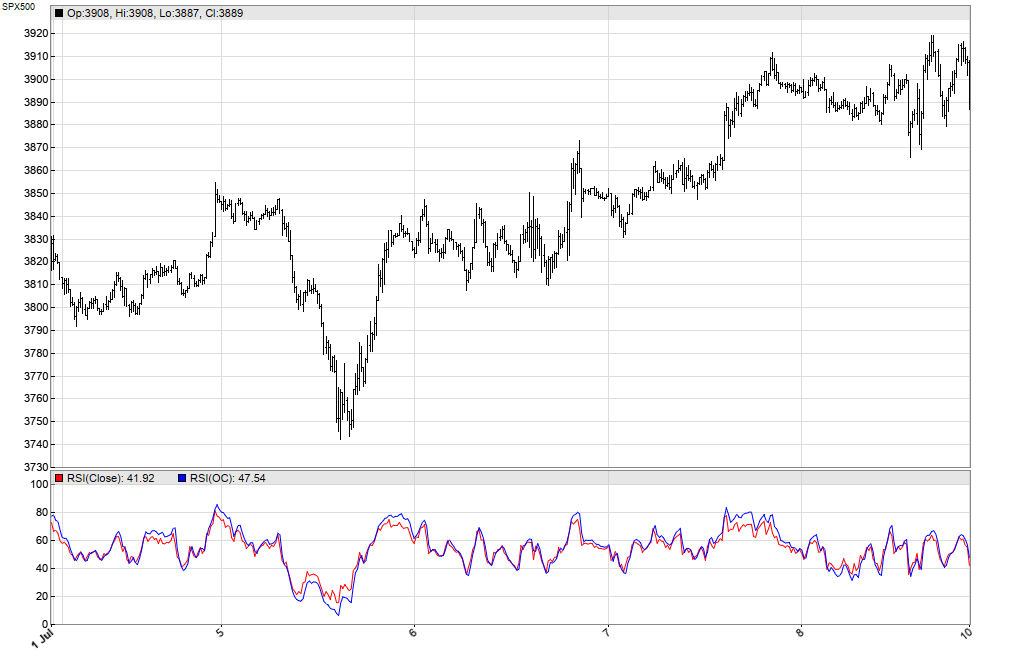
FIGURE 9: ZORRO PROJECT. This shows the SPX with two RSIs in the bottom pane: one that is based only on close data and one based on using averaged data (averaging the open and close).
If the user would like to investigate whether the smoother curve compensates for the half bar of additional lag, the user can add the following five lines to the script:
vars RSIs = series(RSI(OC,14));
if(crossUnder(RSIs,70))
  enterShort();
if(crossOver(RSIs,30))
  enterLong();
This code implements a simple RSI trading system, which enters a short position when the RSI crosses below 70, and enters a long position when it crosses above 30; a position is closed when an opposite position is opened. Using this simple system, the user could compare the RSI version using the open-close average data with the version of the RSI using only close data. And if you’re developing an indicator-based trading system, it would certainly be worth trying the alternative version of the indicator to be used, and comparing the results.
The script can be downloaded from the 2023 script repository on https://financial-hacker.com. The Zorro platform can be downloaded from https://zorro-project.com.
—Petra Volkova
The Zorro Project by oP group Germany
https://zorro-project.com
BACK TO LIST
Originally published in the March 2023 issue of
Technical Analysis of STOCKS & COMMODITIES magazine.
All rights reserved. © Copyright 2023, Technical Analysis, Inc.