TRADERS’ TIPS
May 2023
For this month’s Traders’ Tips, the focus is Scott Cong’s article in the March issue, “An Adaptive Moving Average For Swing Trading.” Here, we present the May 2023 Traders’ Tips code with possible implementations in various software.
You can right-click on any chart to open it in a new tab or window and view it at it’s originally supplied size, often much larger than the version printed in the magazine.
The Traders’ Tips section is provided to help the reader implement a selected technique from an article in this issue or another recent issue. The entries here are contributed by software developers or programmers for software that is capable of customization.

TradeStation: May 2023
In “An Adaptive Moving Average For Swing Trading” in the March 2023 issue, author Scott Cong presents a new adaptive moving average designed to be responsive, smooth, and robust. He starts with a discussion of Perry Kaufman’s adaptive moving average, explaining how an AMA can self-adjust to different market environments. He later explains his methods of adjustments and alteration of the smoothing factor.
Here is EasyLanguage for implementing Cong’s technique in TradeStation.
Function: MACongAdaptive

{
	TASC MAY 2023
	Function: Scott Cong’s Adaptive Moving Average
	Scott Cong
}

inputs:
	Price( numericseries ),
	Length( numericsimple );

variables:
	HH( 0 ),
	LL( 0 ),
	Result( 0 ),
	Effort( 0 ),
	AlphaValue( 0 );

if CurrentBar = 1 then
	MACongAdaptive = Price
else
begin
	HH = Highest(High, Length);
	LL = Lowest(Low, Length);
	Result = HH - LL;
	Effort = Summation(TrueRange, Length);

	if Effort <> 0 then
		AlphaValue = Result / Effort
	else
		AlphaValue = 1;

	if AlphaValue = 1 then
		MACongAdaptive = Price
	else
		MACongAdaptive = AlphaValue * Price
		 + (1 - AlphaValue) * _MACongAdaptive[1];
end;

Indicator: Adaptive AMA Swing Trading

{
	TASC MAY 2023
	An Adaptive Moving Average For Swing Trading
	Scott Cong
}

inputs:
	Length( 20 ),
	Price( Close );

variables:
	AMA( 0 );

AMA = MACongAdaptive( Close, Length );

Plot1( AMA, "Adaptive AMA" );
A sample chart is shown in Figure 1.

FIGURE 1: TRADESTATION. This TradeStation daily chart of the S&P 500 ETF SPY shows a portion of 2022 and 2023 with Scott Cong’s adaptive moving average indicator applied, compared with an EMA and SMA of similar lengths (30).
This article is for informational purposes. No type of trading or investment recommendation, advice, or strategy is being made, given, or in any manner provided by TradeStation Securities or its affiliates.
—John Robinson
TradeStation Securities, Inc.
www.TradeStation.com
BACK TO LIST

thinkorswim: May 2023
We put together a study based on the article “An Adaptive Moving Average For Swing Trading” by Scott Cong, which appeared in the March 2023 issue of S&C. We built the study referenced by using our proprietary scripting language, thinkscript. To ease the loading process, simply click https://tos.mx/n9SXDUV or enter this URL into the address in setup → open shared item from within thinkorswim, then choose view thinkScript study and name it “CongAdaptiveMovingAVG” or whatever you like and can identify. You can then add the study to your charts from the edit studies menu from within the charts tab and then selecting studies.
The chart in Figure 2 shows our version of the study on a one-year daily chart of SPX. Please refer to Cong’s article in the March 2023 issue for how to interpret the indicator.

FIGURE 2: THINKORSWIM. This shows the study, an adaptive moving average, on a one-year daily chart of SPX.
—thinkorswim
A division of TD Ameritrade, Inc.
www.thinkorswim.com
BACK TO LIST

Wealth-Lab.com: May 2023
In the March 2023 issue, Scott Cong introduced an adaptive moving average in his article titled “An Adaptive Moving Average For Swing Trading.” The latest build of Wealth-Lab 8 now comes with the Cong adaptive moving average (CAMA) integrated.
As usual, all the Wealth-Lab tools can instantly get powered up with the new indicator, be it building blocks (to build trading strategies without having to write any code), our indicator profiler (which tells how much of an edge an indicator provides), or our strategy optimization tool.
We “paired” CAMA with its slower same-period predecessor KAMA to prototype a no-code trading strategy based on moving average crossovers. You can see the result on Figure 3. To expand your choice of adaptive moving averages, install the “Advanced Smoothers” package in Wealth-Lab 8.

FIGURE 3: WEALTH-LAB. This shows a 30-period CAMA crossing above and below a 30/30-period KAMA on a daily chart of the SPY ETF with the trading signals it produces. Data provided by Yahoo! Finance.
Prototyping a trading system, including complex ideas, doesn’t take much effort with our building blocks feature. If you’re not familiar with Wealth-Lab, our web-based backtesting engine is free to use. You can create a system (for example, choosing Cong’s AMA in one of the indicator blocks) in its user-friendly interface and run backtests of your strategy right in the browser. As a natural next step, your strategy becomes instantly available in the Wealth-Lab desktop application for your in-depth use. And if the strategy turns out to be good, you could publish it for the benefit of other Wealth-Lab community members.
Here is the URL to visit published strategies in Wealth-Lab: https://www.wealth-lab.com/Strategy/PublishedStrategies.
—Gene Geren (Eugene)
Wealth-Lab team
www.wealth-lab.com
BACK TO LIST

MetaStock: May 2023
In the March 2023 issue of S&C, Scott Cong’s article “An Adaptive Moving Average For Swing Trading” introduced a new way to calculate an adaptive moving average. Coding for the MetaStock version of the indicator is shown here.
Formula:
m:= Input("Method <1= Price Displacement / 2= Max Range>", 1, 2, 1);
tp:= Input("Periods", 1, 500, 20);
m1:= Abs(C - Ref(C, -tp));
m2:= HHV(H, tp) - LLV(L, tp);
denom:= Sum(ATR(1), tp);
a:= If(m=1, m1, m2)/denom;
(a * C) + ((1-a) * If(Cum(1)=tp, Ref(C, -1), PREV))
—William Golson
MetaStock Technical Support
MetaStock.com
BACK TO LIST

NinjaTrader: May 2023
The indicator introduced in Scott Cong’s article in the March 2023 issue titled “An Adaptive Moving Average For Swing Trading” is available for download from the following link for NinjaTrader 8:
Once the file is downloaded, you can import the indicator into NinjaTrader 8 from within the control center by selecting Tools → Import → NinjaScript Add-On and then selecting the downloaded file for NinjaTrader 8.
You can review the indicator’s source code in NinjaTrader 8 by selecting the menu New → NinjaScript Editor → Indicators from within the control center window and selecting the file you wish to examine.
NinjaScript uses compiled DLLs that run native, not interpreted, which provides you with the highest performance possible.
A sample chart displaying the Cong adaptive moving average (CAMA) on a one-minute chart of the S&P 500 emini (ES) is shown in Figure 4.

FIGURE 4: NINJATRADER. This one-minute chart of the S&P 500 emini (ES) displays the Cong adaptive moving average (CAMA).
—Chelsea Bell
NinjaTrader, LLC
www.ninjatrader.com
BACK TO LIST

TradingView: May 2023
Provided here is TradingView Pine Script code implementing the adaptive moving average indicator described in the March 2023 article by Scott Cong titled “An Adaptive Moving Average For Swing Trading.”
//  TASC Issue: May 2023 - Vol. 41, Issue 6
//     Article: Result Vs. Effort
//              An Adaptive Moving Average For Swing Trading.
//  Article By: Scott Cong
//    Language: TradingView's Pine Script™ v5
// Provided By: PineCoders, for tradingview.com


//@version=5
string title = 'TASC 2023.05 Cong Adaptive Moving Average'
string stitle = 'AMA'
indicator(title, stitle, true)


// @function Wilder's True Range
// @param sClose float . Source data, default=`close`.
// @param sHigh  float . Source data, default=`high`.
// @param sLow   float . Source data, default=`low`.
wTR (
float sClose = close ,
float sHigh  = high  ,
float sLow   = low   ) =>
   if bar_index < 1
       sHigh - sLow
   else
       math.max(
        sHigh - sLow      ,
        sHigh - sClose[1] ,
        sLow  - sClose[1] )


// @function Cong Adaptive Moving Average (CAMA)
// @param length       int   . Lookback period.
// @param sClose float . Source data, default=`close`.
// @param sHigh  float . Source data, default=`high`.
// @param sLow   float . Source data, default=`low`.
// @returns float. Smoothed series data.
maCongAdaptive (
int   length = 10 ,
float sClose = close ,
float sHigh  = high  ,
float sLow   = low   ) =>
   float result_cama = sClose
   float hh  = ta.highest(sHigh, length)
   float ll  = ta.lowest( sLow , length)
   float wTR = wTR(sClose, sHigh, sLow)
   float effort = math.sum(wTR, length)
   float result = hh - ll
   float alpha  = result / effort
   if bar_index > length
       float d = (1.0 - alpha) * result_cama[1]
       result_cama := alpha * sClose + d
   result_cama


int lookback = input.int(10, 'Lookback period', 1)
float cama = maCongAdaptive(lookback)
plot(cama, 'AMA', #4997fc,2)
The indicator is available on TradingView from the PineCodersTASC account: https://www.tradingview.com/u/PineCodersTASC/#published-scripts.
An example chart is shown in Figure 5.
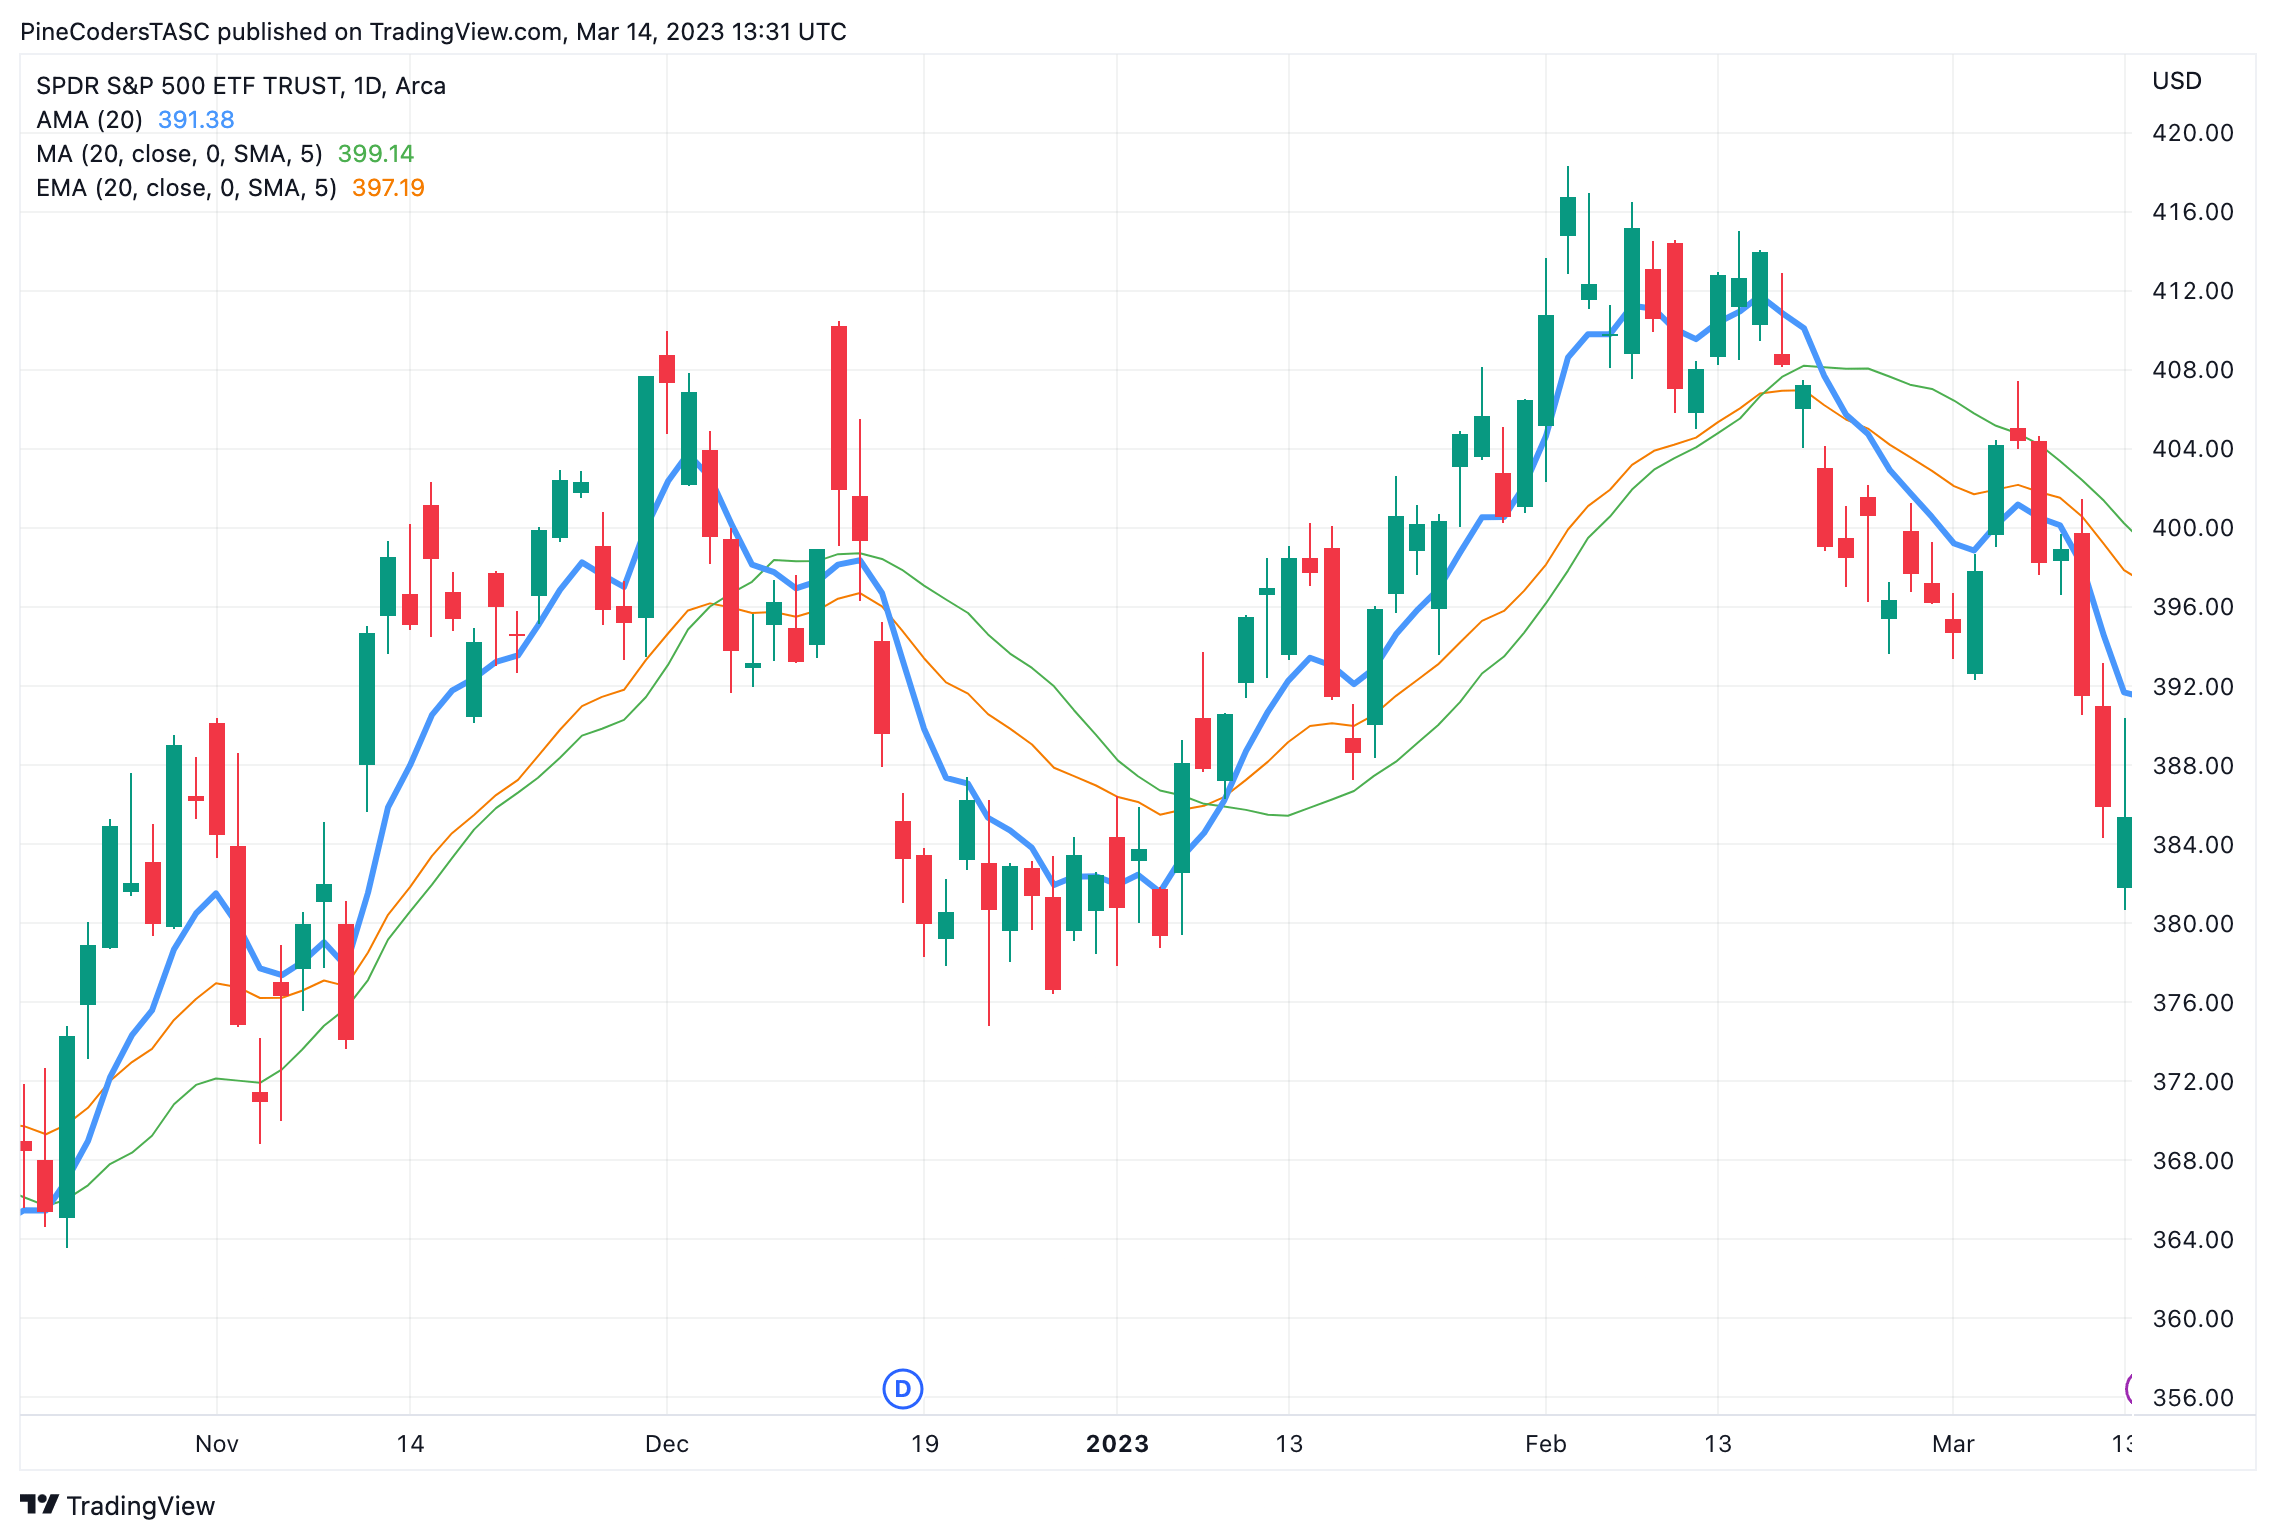
FIGURE 5: TRADINGVIEW. This example TradingView chart demonstrates the Cong adaptive moving average (CAMA) on the SPY.
—PineCoders, for TradingView
www.TradingView.com
BACK TO LIST

NeuroShell Trader: May 2023
The indicator introduced in Scott Cong’s article in the March 2023 issue of S&C, titled “An Adaptive Moving Average For Swing Trading,” can be easily implemented in NeuroShell Trader by combining some of NeuroShell Trader’s 800+ indicators. To implement the indicators, select new indicator from the insert menu and use the indicator wizard to create the following indicators:
ALPHA:	Divide( PriceRange(High,Low,30), Sum( True Range(High,Low,Close), 30) )
AMA:	DynamicExpAvg (Close, ALPHA
Figure 6 shows the adaptive exponential moving average applied to SPY.

FIGURE 6: NEUROSHELL TRADER. This NeuroShell Trader chart demonstrates the adaptive exponential moving average applied to SPY.
Users of NeuroShell Trader can go to the Stocks & Commodities section of the NeuroShell Trader free technical support website to download a copy of this or any previous Traders’ Tips. The true range indicator is available in the Advanced Indicator Set 1 Add-On, while the DynamicExpAvg, a dynamic rate exponential moving average custom indicator, is available for download on the free technical support website along with the Traders’ Tip.
—Ward Systems Group, Inc.
sales@wardsystems.com
www.neuroshell.com
BACK TO LIST

AIQ: May 2023
The importable AIQ EDS file based on Scott Cong’s article in the March 2023 issue, “An Adaptive Moving Average For Swing Trading,” can be obtained on request via rdencpa@gmail.com. The code is also available below.
Code for the author’s indicator as shown below is set up in the downloadable AIQ EDS code file.
!ADAPTIVE MOVING AVERAGE FOR SWING TRADING
!Author: Scott Cong, TASC May 2023
!Coded by: Richard Denning, 03/14/2023

!INPUTS:
Len is 20.

!CODING ABREVIATIONS:
H is [high].
L is [low].
C is [close].
C1 is val([close],1).

TR  is Max(H-L,max(abs(C1-L),abs(C1-H))).
Effort is sum(TR,Len).
Result is highresult(H,Len) - lowresult(L,Len).
alpha is Result / Effort.
beta is 1 - alpha.

DaysInto is ReportDate() - RuleDate().
Stop if DaysInto > Len*2.
stopAMA is iff(stop,C, AMA).
AMA is alpha * [close] + beta * valresult( stopAMA, 1).
ESA is expavg(C,Len).
Figure 7 shows a chart of Broadcom (AVGO) along with the AMA[20] indicator (the red jagged line) and an exponential moving average indicator [20] (the green smooth line).

FIGURE 7: AIQ. This shows a chart of Broadcom (AVGO) with the AMA[20] indicator (the red jagged line) and an exponential moving average indicator [20] (the green smooth line).
—Richard Denning
rdencpa@gmail.com
for AIQ Systems
BACK TO LIST

The Zorro Project: May 2023
Trend-following systems are usually a compromise between too many whipsaws and too much lag. In Scott Cong’s March 2023 article “An Adaptive Moving Average For Swing Trading,” he proposes a solution for this dilemma with an adaptive moving average (AMA). It’s an EMA (exponential moving average) with a variable smoothing factors, derived from the ratio of price result and price effort. Here is code for his indicator written in C:
var AMA(int Period)
{
	var Effort = 0;
	int i;
	for(i=0; i<Period; i++)
		Effort += TR(i);
	var Result = HH(Period) - LL(Period);
	return EMA(priceC(0),Result/fix0(Effort));
}}
The Effort variable in the above code is the sum of all TrueRanges (TR) within the period. The fix0 function is a convenience function for fixing possible division-by-zero errors by flat price lines.
A comparison of the AMA (in blue) and the EMA (in red) applied to SPY is shown in the chart in Figure 8. We can see that the AMA (blue line) follows the price more closely than the EMA (red line) does, due to the fact that the AMA period is often smaller.
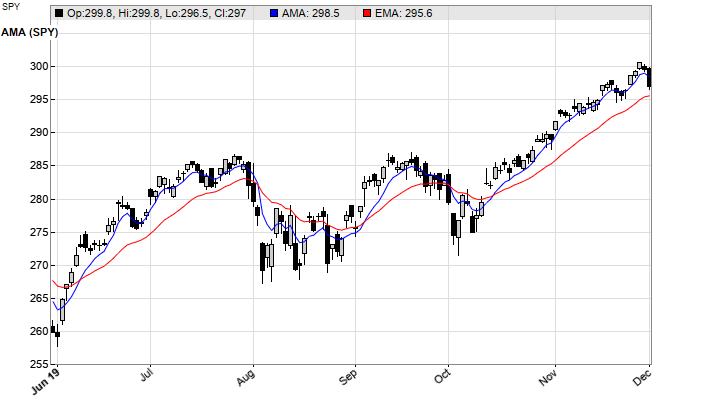
FIGURE 8: ZORRO PROJECT. Here you see both the adaptive moving average (AMA), in blue, along with the exponential moving average (EMA), in red, applied to SPY for comparison.
We wrote a simple SPY system that concurrently trades using both the AMA and EMA to put the indicators into action. A long position is entered when an AMA or EMA valley indicates the start of an uptend. Likewise, a short position is entered when a peak indicates the start of a downtrend. For not comparing apples with oranges, we optimize both time periods and test with walk-forward analysis. The code for this sample trading system in C follows. You can use it to experiment with the AMA.
void run()
{
	BarPeriod = 1440;
	LookBack = 200;
	StartDate = 2005;
	EndDate = 2023;
	asset("SPY");
// walk-forward optimization setup
	set(PARAMETERS,TESTNOW,PLOTNOW);
	NumWFOCycles = 8;
// run a loop over the two algos
	while(algo(loop("AMA","EMA"))) {
		vars Signals;
		int Color;
		int Period = optimize(20,5,100,5);
		if(Algo == "AMA") {
			Signals = series(AMA(Period));
			Color = BLUE;
		} else if(Algo == "EMA") {
			Signals = series(EMA(seriesC(),Period));
			Color = GREY;
		}
		if(valley(Signals)) enterLong();
		if(peak(Signals)) enterShort();
// plot equity curve
		plot(Algo,ProfitOpen+ProfitClosed,LINE+AXIS2,Color);
	}
}
In the above code, the fast and slow periods are optimized separately for both algorithms. The system is trained by clicking the [Train] button on the Zorro panel, then a backtest is automatically started. Training and testing takes a few seconds. The resulting equity curve is plotted in a blue line for the AMA algo and a gray line for the standard EMA algo (Figure 9).
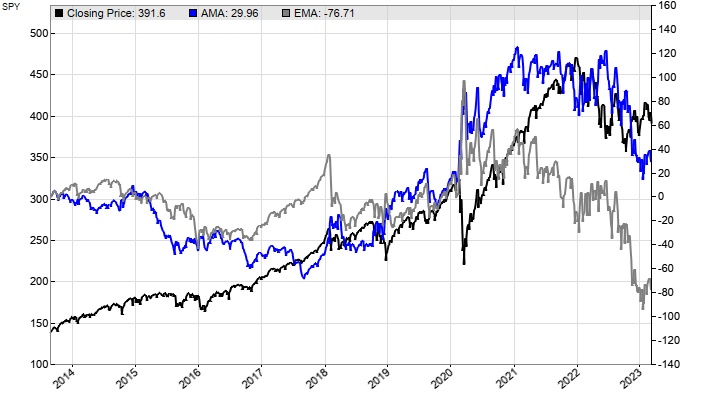
FIGURE 9: ZORRO PROJECT. This shows the equity curves for the example simple trading system. The blue line is the equity curve for the trading system using the AMA algo and the gray line is the equity curve for the trading system that uses the EMA algo.
In our simple system test, we can see that the AMA and EMA were head to head most of the time but the AMA beat the EMA at the end where the SPY became more volatile.
The AMA indicator and the EMA/AMA trading system can be downloaded from the 2023 script repository on https://financial-hacker.com. The Zorro software for C/C++ algo trading can be downloaded from https://zorro-project.com.
—Petra Volkova
The Zorro Project by oP group Germany
https://zorro-project.com
BACK TO LIST
Microsoft Excel: May 2023
In his article in the March 2023 issue, “An Adaptive Moving Average For Swing Trading,” Scott Cong presents an adaptive moving average and discusses his reasoning for the development of it. He works through the steps, leading him from Perry Kaufman’s earlier adaptive moving average, which uses the concept of direction over volatility to calculate an efficiency ratio smoothing coefficient, to his adaptive moving average, which uses the concept of result over effort.
The author defines “effort” in his article as the summation of Wilder’s “true range” for each of the bars in the lookback interval.
In his article, Cong shows us two possible ways to calculate a value for “result.” His first suggestion for result is “price displacement,” the absolute value of the difference between the price now and the price lookback bars in the past.
His second suggestion for result is the “maximum range” over the lookback interval, that is, the maximum high minus the maximum low.
Figure 10 replicates the first chart in Cong’s article comparing the results using a price displacement efficiency ratio to the maximum displacement ratio.

FIGURE 10: EXCEL. This shows comparing the CAMA using 30-bar price displacement with CAMA using 30-bar maximum range.
Figures 11, 12, and 13 replicate the corresponding figures from the article where Cong makes comparisons between the price displacement efficiency ratio AMA and the traditional EMA and SMAs of similar lookback periods.

FIGURE 11: EXCEL. This shows comparing a 30-bar price displacement CAMA to a 30-bar SMA and a 30-bar AMA.

FIGURE 12: EXCEL. This shows a 30-bar CAMA compared to 10- and 20-bar EMAs. You can change the lookback settings at the left of the chart and the changes will automatically be reflected in the series selection headings to the right of the chart and in the legend entries on the chart.
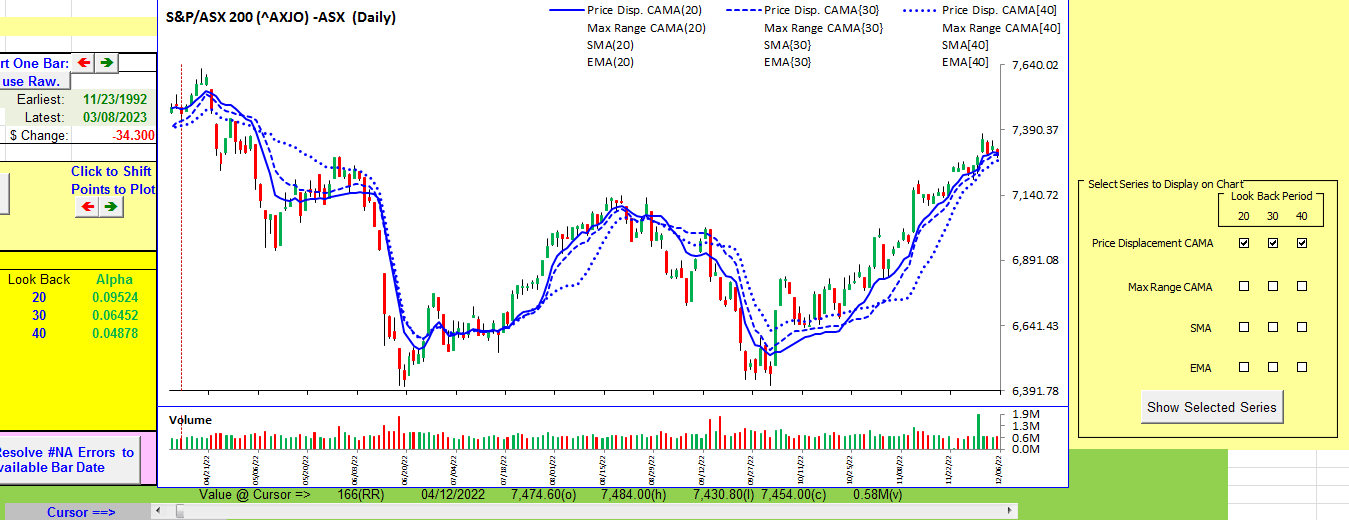
FIGURE 13: EXCEL. This shows comparing three lookback periods using price displacement CAMAs.
You can mix and match the series displayed on the chart at any given time by toggling (clicking) the checkboxes under “lookback periods” to the right of the chart. When you arrive at a combination of choice, click the “show selected series” button to update the chart display.
To download this spreadsheet: The spreadsheet file for this Traders’ Tip can be downloaded here. To successfully download it, follow these steps:
- Right-click on the Excel file link, then
- Select “save as” (or “save target as”) to place a copy of the spreadsheet file on your hard drive.
—Ron McAllister
Excel and VBA programmer
rpmac_xltt@sprynet.com
BACK TO LIST
Originally published in the May 2023 issue of
Technical Analysis of STOCKS & COMMODITIES magazine.
All rights reserved. © Copyright 2023, Technical Analysis, Inc.


