TRADERS’ TIPS
June 2023
For this month’s Traders’ Tips, the focus is Vitali Apirine’s article in this issue, “The Stochastic Distance Oscillator.” Here, we present the June 2023 Traders’ Tips code with possible implementations in various software.
You can right-click on any chart to open it in a new tab or window and view it at it’s originally supplied size, often much larger than the version printed in the magazine.
The Traders’ Tips section is provided to help the reader implement a selected technique from an article in this issue or another recent issue. The entries here are contributed by software developers or programmers for software that is capable of customization.
MetaQuotes: June 2023
In his article in this issue, Vitali Apirine introduces the stochastic distance oscillator (SDO). Here is coding for that indicator and for a function for use on the MetaQuotes platform. Figure 1 applies the SDO on a daily chart of EURUSD.
//+------------------------------------------------------------------+
//|                               Stochastic Distance Oscillator.mq5 |
//|                                    Copyright © 2023, Shaun Bosch |
//|                                              shadavbos@gmail.com |
//+------------------------------------------------------------------+
#property copyright "Copyright © 2023, Shaun Bosch"
#property link      "shadavbos@gmail.com"
#property version   "1.00"
#property indicator_separate_window
#property indicator_maximum 110
#property indicator_minimum -110
#property indicator_buffers 3
#property indicator_plots   1
//--- plot SDO
#property indicator_label1  "SDO"
#property indicator_type1   DRAW_LINE
#property indicator_color1  clrRed
#property indicator_style1  STYLE_SOLID
#property indicator_width1  1
//--- input parameters
input int      inp_lookback_period     = 200;      // Lookback Period
input int      inp_n_periods           = 12;       // n Periods
input int      inp_ema_length          = 3;        // EMA Length
//--- indicator buffers
double         SDOPlot[];
double         calc1[], calc2[];
//--- indicator variables
int            lookback_period;
int            n_periods;
int            ema_length;
//+------------------------------------------------------------------+
//| Custom indicator initialization function                         |
//+------------------------------------------------------------------+
int OnInit()
  {
//--- check input parameters
   lookback_period = inp_lookback_period < 1 ? 1 : inp_lookback_period;
   n_periods = inp_n_periods < 1 ? 1 : inp_n_periods;
   ema_length = inp_ema_length < 1 ? 1 : inp_ema_length;
//--- indicator buffers mapping
   SetIndexBuffer(0, SDOPlot, INDICATOR_DATA);
   SetIndexBuffer(1, calc1, INDICATOR_CALCULATIONS);
   SetIndexBuffer(2, calc2, INDICATOR_CALCULATIONS);
//--- set indicator accuracy
   IndicatorSetInteger(INDICATOR_DIGITS, 2);
//--- set indicator name display
   string short_name = "SDO (" + IntegerToString(lookback_period) + ", " + IntegerToString(n_periods) + ", " + IntegerToString(ema_length) + ")";
   IndicatorSetString(INDICATOR_SHORTNAME, short_name);
//--- sets drawing lines to empty value
   PlotIndexSetDouble(0, PLOT_EMPTY_VALUE, EMPTY_VALUE);
//--- set level values
   IndicatorSetInteger(INDICATOR_LEVELS, 3);
   IndicatorSetDouble(INDICATOR_LEVELVALUE, 0, 40.0);
   IndicatorSetDouble(INDICATOR_LEVELVALUE, 1, 0.0);
   IndicatorSetDouble(INDICATOR_LEVELVALUE, 2, -40.0);
//--- set level colors
   IndicatorSetInteger(INDICATOR_LEVELCOLOR, 0, clrDarkSlateGray);
   IndicatorSetInteger(INDICATOR_LEVELCOLOR, 1, clrDarkSlateGray);
   IndicatorSetInteger(INDICATOR_LEVELCOLOR, 2, clrDarkSlateGray);
//--- set level styles
   IndicatorSetInteger(INDICATOR_LEVELSTYLE, 0, STYLE_SOLID);
   IndicatorSetInteger(INDICATOR_LEVELSTYLE, 1, STYLE_DASHDOT);
   IndicatorSetInteger(INDICATOR_LEVELSTYLE, 2, STYLE_SOLID);
//--- initialization succeeded
   return(INIT_SUCCEEDED);
  }
//+------------------------------------------------------------------+
//| Custom indicator iteration function                              |
//+------------------------------------------------------------------+
int OnCalculate(const int rates_total,
                const int prev_calculated,
                const int begin,
                const double &price[])
  {
//--- bar index start
   int bar_index;
   if(prev_calculated == 0)
      bar_index = 0;
   else
      bar_index = prev_calculated - 1;
//--- main loop
   for(int i = bar_index; i < rates_total && !_StopFlag; i++)
      SDOPlot[i] = in_SDO(lookback_period, n_periods, ema_length, price, calc1, calc2, i);
//--- return value of prev_calculated for next call
   return(rates_total);
  }
//+------------------------------------------------------------------+
//| Stochastic Distance Oscillator (SDO)                             |
//+------------------------------------------------------------------+
double in_SDO(const int length_1, // Lookback Period - min val: 1; step val: 1; default val: 200
              const int length_2, // n Periods - min val: 1; step val: 1; default val: 12
              const int length_3, // EMA length - min val: 1; step val: 1; default val: 3
              const double &source[],
              double &calc_distance[], // External Dynamic Array 1
              double &calc_ema[], // External Dynamic Array 2
              const int bar)
  {
   double result = EMPTY_VALUE;
   calc_distance[bar] = 0.0;
   calc_ema[bar] = 0.0;
   if(bar >= length_1 + length_2 && length_1 > 0 && length_2 > 0 && length_3)
     {
      calc_distance[bar] = fabs(source[bar] - (MathIsValidNumber(source[bar - length_2]) ? source[bar - length_2] : 0.0));
      double hh = -DBL_MAX, ll = DBL_MAX;
      for(int i = 0; i < length_1; i++)
        {
         hh = (MathIsValidNumber(calc_distance[bar - i]) ? calc_distance[bar - i] : 0.0) > hh ? (MathIsValidNumber(calc_distance[bar - i]) ? calc_distance[bar - i] : 0.0) : hh;
         ll = (MathIsValidNumber(calc_distance[bar - i]) ? calc_distance[bar - i] : 0.0) < ll ? (MathIsValidNumber(calc_distance[bar - i]) ? calc_distance[bar - i] : 0.0) : ll;
        }
      double perc_d = source[bar] > (MathIsValidNumber(source[bar - length_2]) ? source[bar - length_2] : 0.0) ? ((hh - ll) != 0.0 ? (calc_distance[bar] - ll) / (hh - ll) : 0.0) : source[bar] < (MathIsValidNumber(source[bar - length_2]) ? source[bar - length_2] : 0.0) ? ((hh - ll) != 0.0 ? -1.0 * ((calc_distance[bar] - ll) / (hh - ll)) : 0.0) : 0.0;
      double alpha = 2.0 / (1.0 + double(length_3));
      calc_ema[bar] = perc_d * alpha + (MathIsValidNumber(calc_ema[bar - 1]) ? calc_ema[bar - 1] : 0.0) * (1.0 - alpha);
      result = calc_ema[bar] * 100.0;
     }
   return(result);
  }
//+------------------------------------------------------------------+
//+------------------------------------------------------------------+
//| Stochastic Distance Oscillator (SDO)                             |
//+------------------------------------------------------------------+
double in_SDO(const int length_1, // Lookback Period - min val: 1; step val: 1; default val: 200
              const int length_2, // n Periods - min val: 1; step val: 1; default val: 12
              const int length_3, // EMA length - min val: 1; step val: 1; default val: 3
              const double &source[],
              double &calc_distance[], // External Dynamic Array 1
              double &calc_ema[], // External Dynamic Array 2
              const int bar)
  {
   double result = EMPTY_VALUE;
   calc_distance[bar] = 0.0;
   calc_ema[bar] = 0.0;
   if(bar >= length_1 + length_2 && length_1 > 0 && length_2 > 0 && length_3)
     {
      calc_distance[bar] = fabs(source[bar] - (MathIsValidNumber(source[bar - length_2]) ? source[bar - length_2] : 0.0));
      double hh = -DBL_MAX, ll = DBL_MAX;
      for(int i = 0; i < length_1; i++)
        {
         hh = (MathIsValidNumber(calc_distance[bar - i]) ? calc_distance[bar - i] : 0.0) > hh ? (MathIsValidNumber(calc_distance[bar - i]) ? calc_distance[bar - i] : 0.0) : hh;
         ll = (MathIsValidNumber(calc_distance[bar - i]) ? calc_distance[bar - i] : 0.0) < ll ? (MathIsValidNumber(calc_distance[bar - i]) ? calc_distance[bar - i] : 0.0) : ll;
        }
      double perc_d = source[bar] > (MathIsValidNumber(source[bar - length_2]) ? source[bar - length_2] : 0.0) ? ((hh - ll) != 0.0 ? (calc_distance[bar] - ll) / (hh - ll) : 0.0) : source[bar] < (MathIsValidNumber(source[bar - length_2]) ? source[bar - length_2] : 0.0) ? ((hh - ll) != 0.0 ? -1.0 * ((calc_distance[bar] - ll) / (hh - ll)) : 0.0) : 0.0;
      double alpha = 2.0 / (1.0 + double(length_3));
      calc_ema[bar] = perc_d * alpha + (MathIsValidNumber(calc_ema[bar - 1]) ? calc_ema[bar - 1] : 0.0) * (1.0 - alpha);
      result = calc_ema[bar] * 100.0;
     }
   return(result);
  }
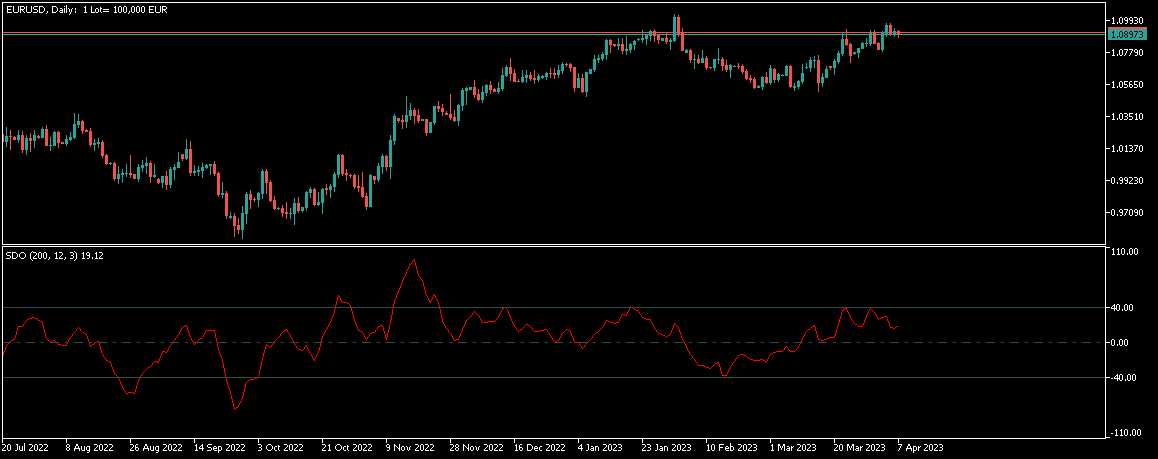
FIGURE 1: METAQUOTES. This demonstrates the stochastic distance oscillator (SDO) on a daily chart of EURUSD.
—Shaun Bosch
shadavbos@gmail.com
BACK TO LIST

TradeStation: June 2023
In his article in this issue, “The Stochastic Distance Oscillator” author Vitali Apirine offers a new variation on the classic stochastic oscillator, which he calls the stochastic distance oscillator (SDO). The SDO is a momentum study that shows the magnitude of the current distance relative to the maximum–minimum distance range over a set period. The study can be used with securities or indexes that trend but is also suitable for trading ranges. Overbought and oversold levels can help identify bull and bear trend changes.
Indicator: SDO

// TASC JUNE 2023
// The Stochastic Distance Oscillator (SDO)
//
// Vitali Apirine

inputs:
	LBPeriod( 200 ),
	Period( 12 ),
	Pds( 3 ),
	OverBought( 40 ),
	OverSold( -40 ),
	ShowZeroLine( true );

variables:
	DVal( 0 ),
	DDVal( 0 ),
	Dist( 0 ),
	SDOVal( 0 );

Dist = AbsValue(Close - Close[Period]);
DVal = (Dist - Lowest(Dist, Period))
 /(Highest(Dist, LBPeriod) - Lowest(Dist, LBPeriod));

if Close > Close[Period] then
	DDVal = DVal
else if Close < Close[Period] then
	DDVal = -DVal
else
	DDVal = 0;

SDOVal = XAverage(DDVal, Pds) * 100;

Plot1( SDOVal, "SDO" );
Plot2( OverBought, "OverBought" );
Plot3( OverSold, "OverSold" );
Plot4( 0, "Zero Line" );
A sample chart is shown in Figure 2.

FIGURE 2: TRADESTATION. This demonstrates the stochastic distance oscillator (SDO) on a daily chart of the S&P 500 ETF SPY on a portion of 2022 and 2023.
This article is for informational purposes. No type of trading or investment recommendation, advice, or strategy is being made, given, or in any manner provided by TradeStation Securities or its affiliates.
—John Robinson
TradeStation Securities, Inc.
www.TradeStation.com
BACK TO LIST

thinkorswim: June 2023
We put together a study based on the article by Vitali Apirine in this issue titled “The Stochastic Distance Oscillator.” We built the study referenced by using our proprietary scripting language, thinkscript. To ease the loading process, simply click https://tos.mx/kOU0lCw or enter it into the address via setup → open shared item from within thinkorswim, then choose view thinkScript study and name it “StochasticDistanceOscillator” or whatever you like and can identify. You can then add the study to your charts from the edit studies menu from within the charts tab and then selecting studies.
Figure 3 shows our version of the study on a daily chart of the Russel 2000 index. Please see Vitali Apirine’s article in this issue for how to interpret the indicator.
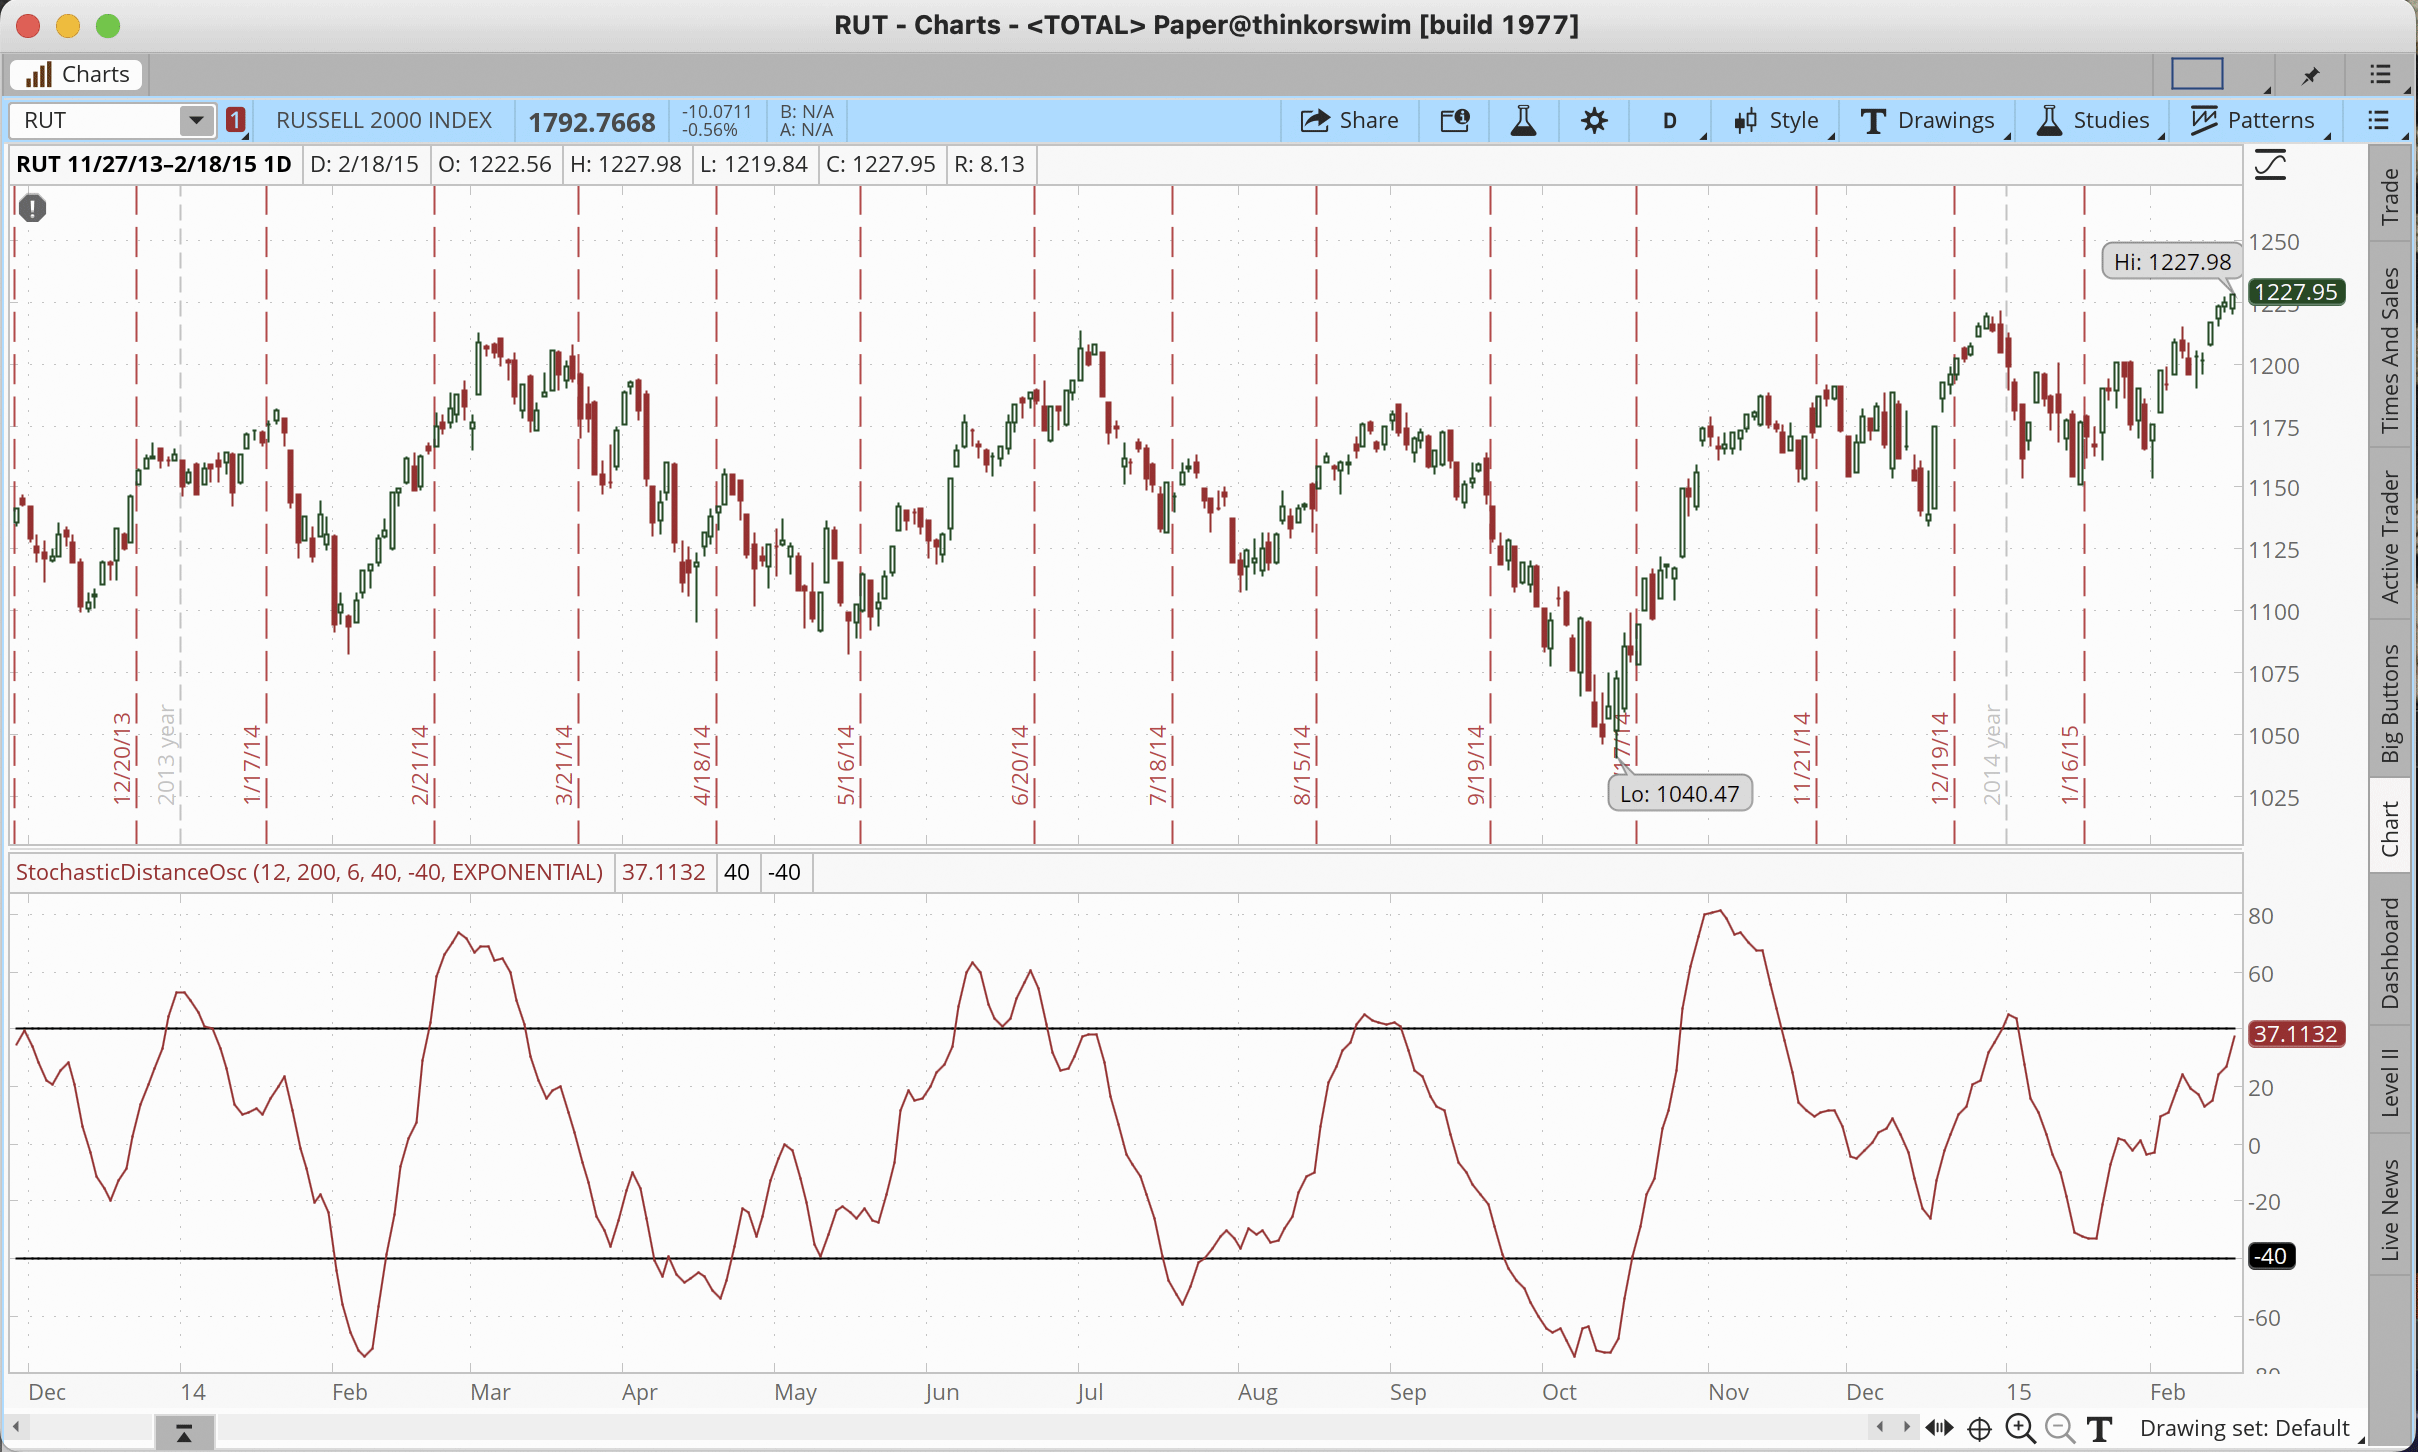
FIGURE 3: THINKORSWIM. This chart demonstrates an implementation of the study on a daily chart of the Russel 2000 index.
—thinkorswim
A division of TD Ameritrade, Inc.
www.thinkorswim.com
BACK TO LIST

Wealth-Lab.com: June 2023
In his article in this issue, “The Stochastic Distance Oscillator,” author Vitali Apirine offers an interesting take on the traditional stochastic oscillator that is based on price extremes over a range of bars. In addition to its ability to signal bull and bear trend changes, like its predecessor, it can naturally also be used in sideways trading.
Wealth-Lab 8 includes the stochastic distance oscillator (SDO) in its latest build. This indicator can be used universally throughout our program features, including in our Building Blocks feature (which offers users an easy way to create trading strategies without having to code them), our Indicator Profiler (which tells how much of an edge an indicator provides), and our Strategy Optimization feature.
Prototyping a trading system, including complex ideas, doesn’t take much effort with our point-and-click Building Blocks feature. The sample trading strategy we will present here, which can be created with the Building Blocks feature (Figure 4), is based on SDO crossing above and below its thresholds, with an extra rule: The price has to trade below the medium-term EMA to make an entry. See Figure 5 for a demonstration of this sample trading strategy based on the stochastic distance oscillator.
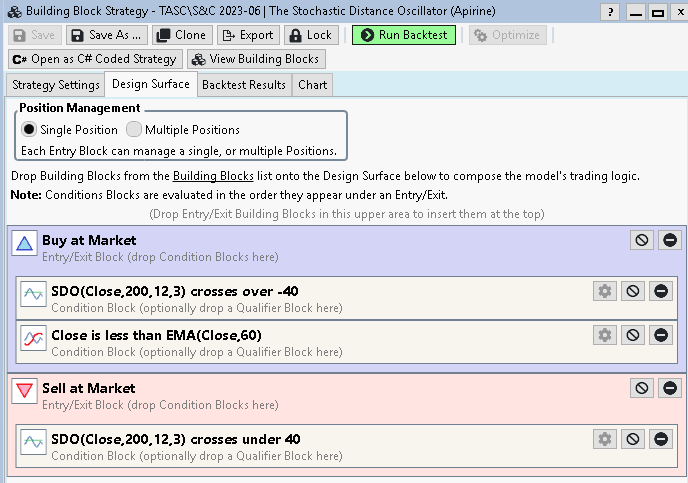
FIGURE 4: WEALTH-LAB. Here’s an example of prototyping or setting up a trading strategy by using the Building Blocks feature in Wealth-Lab. The trading strategy demonstrated is based on the stochastic distance oscillator (SDO).
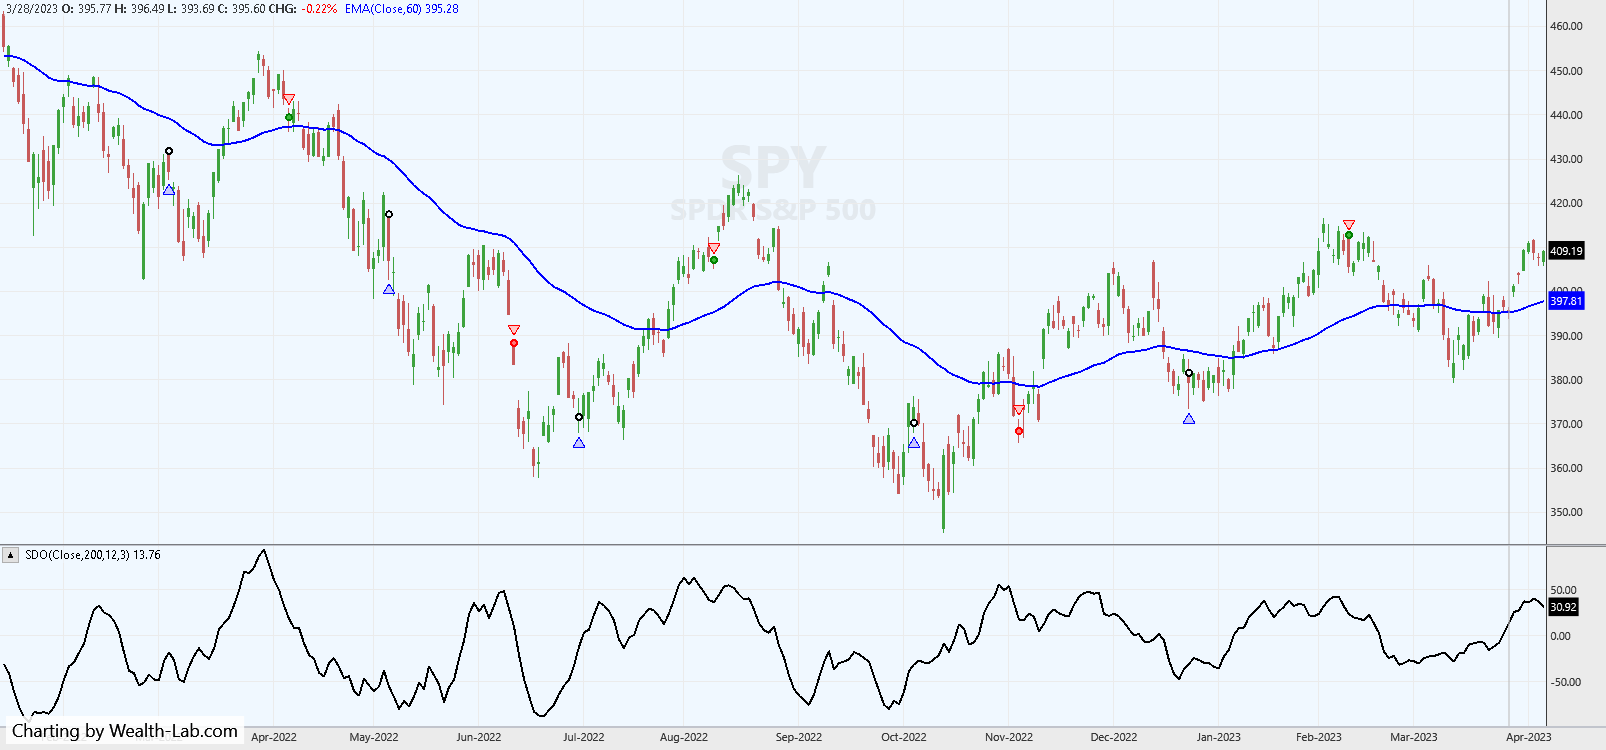
FIGURE 5: WEALTH-LAB. This demonstrates a sample trading strategy based on the stochastic distance oscillator thresholds as applied to the SPY on the daily chart. Here, you see sample trade signals during some recent sideways movement in SPY. Data provided by Wealth-Data.
For those not familiar with Wealth-Lab, our web-based backtesting engine is free to use. Users can design a trading system in a user-friendly interface and run backtests of your strategy right in the browser. As a natural next step, your strategy will become instantly available in the Wealth-Lab desktop application for in-depth use. And if you find that your strategy works well, you can opt to publish it for the benefit of other users in the Wealth-Lab community.
This sample strategy based on the SDO indicator can be downloaded from our “published strategies” listing at: https://www.wealth-lab.com/Strategy/PublishedStrategies.
—Gene Geren (Eugene)
Wealth-Lab team
www.wealth-lab.com
BACK TO LIST

NinjaTrader: June 2023
The stochastic distance oscillator, which is introduced in “The Stochastic Distance Oscillator” in this issue by Vitali Apirine, is available for download at the following link for NinjaTrader 8:
Once the file is downloaded, you can import the indicator into NinjaTrader 8 from within the control center by selecting Tools → Import → NinjaScript Add-On and then selecting the downloaded file for NinjaTrader 8.
You can review the indicator source code in NinjaTrader 8 by selecting the menu New → NinjaScript Editor → Indicators folder from within the control center window and selecting the SDO file.
A sample chart displaying the indicator is shown in Figure 6.

FIGURE 6: NINJATRADER. Here you see the SDO (200, 40, 3) indicator displayed in the upper panel with a daily SPY chart from May 2005 to February 2007 in the lower panel.
NinjaScript uses compiled DLLs that run native, not interpreted, to provide you with the highest performance possible.
—Emily Christoph
NinjaTrader, LLC
www.ninjatrader.com
BACK TO LIST

TradingView: June 2023
Here is TradingView Pine Script code implementing Vitali Apirine’s stochastic distance oscillator, which is a momentum indicator based on the classic stochastic oscillator.
//  TASC Issue: June 2023 - Vol. 41, Issue 7
//     Article: The Stochastic Distance Oscillator
//  Article By: Vitali Apirine
//    Language: TradingView's Pine Script™ v5
// Provided By: PineCoders, for tradingview.com


//@version=5
string title = 'TASC 2023.06 Stochastic Distance Oscillator'
string stitle = 'SDO'
indicator(title, stitle, false)


// @function Stochastic Distance Oscillator (SDO)
// @param lookbackLength    int   . Lookback period.
// @param length            int   . Indicator Period.
// @param smoothingLength   int   . Smoothing period.
// @param source       float . Source data, default=`close`.
// @returns float. Smoothed series data.
stochDistanceOsc(
int   lookbackLength  = 200   ,
int   length          = 12    ,
int   smoothingLength = 3     ,
float source          = close) =>
   float distance = math.abs(source - nz(source[length]))
   float lld      = ta.lowest(distance, lookbackLength)
   float hhd      = ta.highest(distance, lookbackLength)
   float ddo      = nz((distance - lld) / (hhd - lld), 0)
   float sd       = source > nz(source[length]) ? ddo :
                    source < nz(source[length]) ? -ddo : 0
   float result   = ta.ema(sd, smoothingLength) * 100
   result


string is0 = 'Lookback period'
string is1 = 'N periods'
string is2 = 'Smoothing EMA length'
string is3 = 'Threshold'


int lookbackLength  = input.int(200, is0, 1)
int length          = input.int(12,  is1, 1)
int smoothingLength = input.int(3,   is2, 1)
int level           = input.int(40,  is3, 1)
float sdo = stochDistanceOsc(
            lookbackLength, length, smoothingLength)


plot(sdo, 'SDO', #f43a3a, 2)
hline( level)
hline(-level)
hline(0, '', #0000002f)
hline( 100,'',#00000000)
hline(-100,'',#00000000)
The code is available on TradingView in the PineCodersTASC account: https://www.tradingview.com/u/PineCodersTASC/#published-scripts.
An example chart is shown in Figure 7.
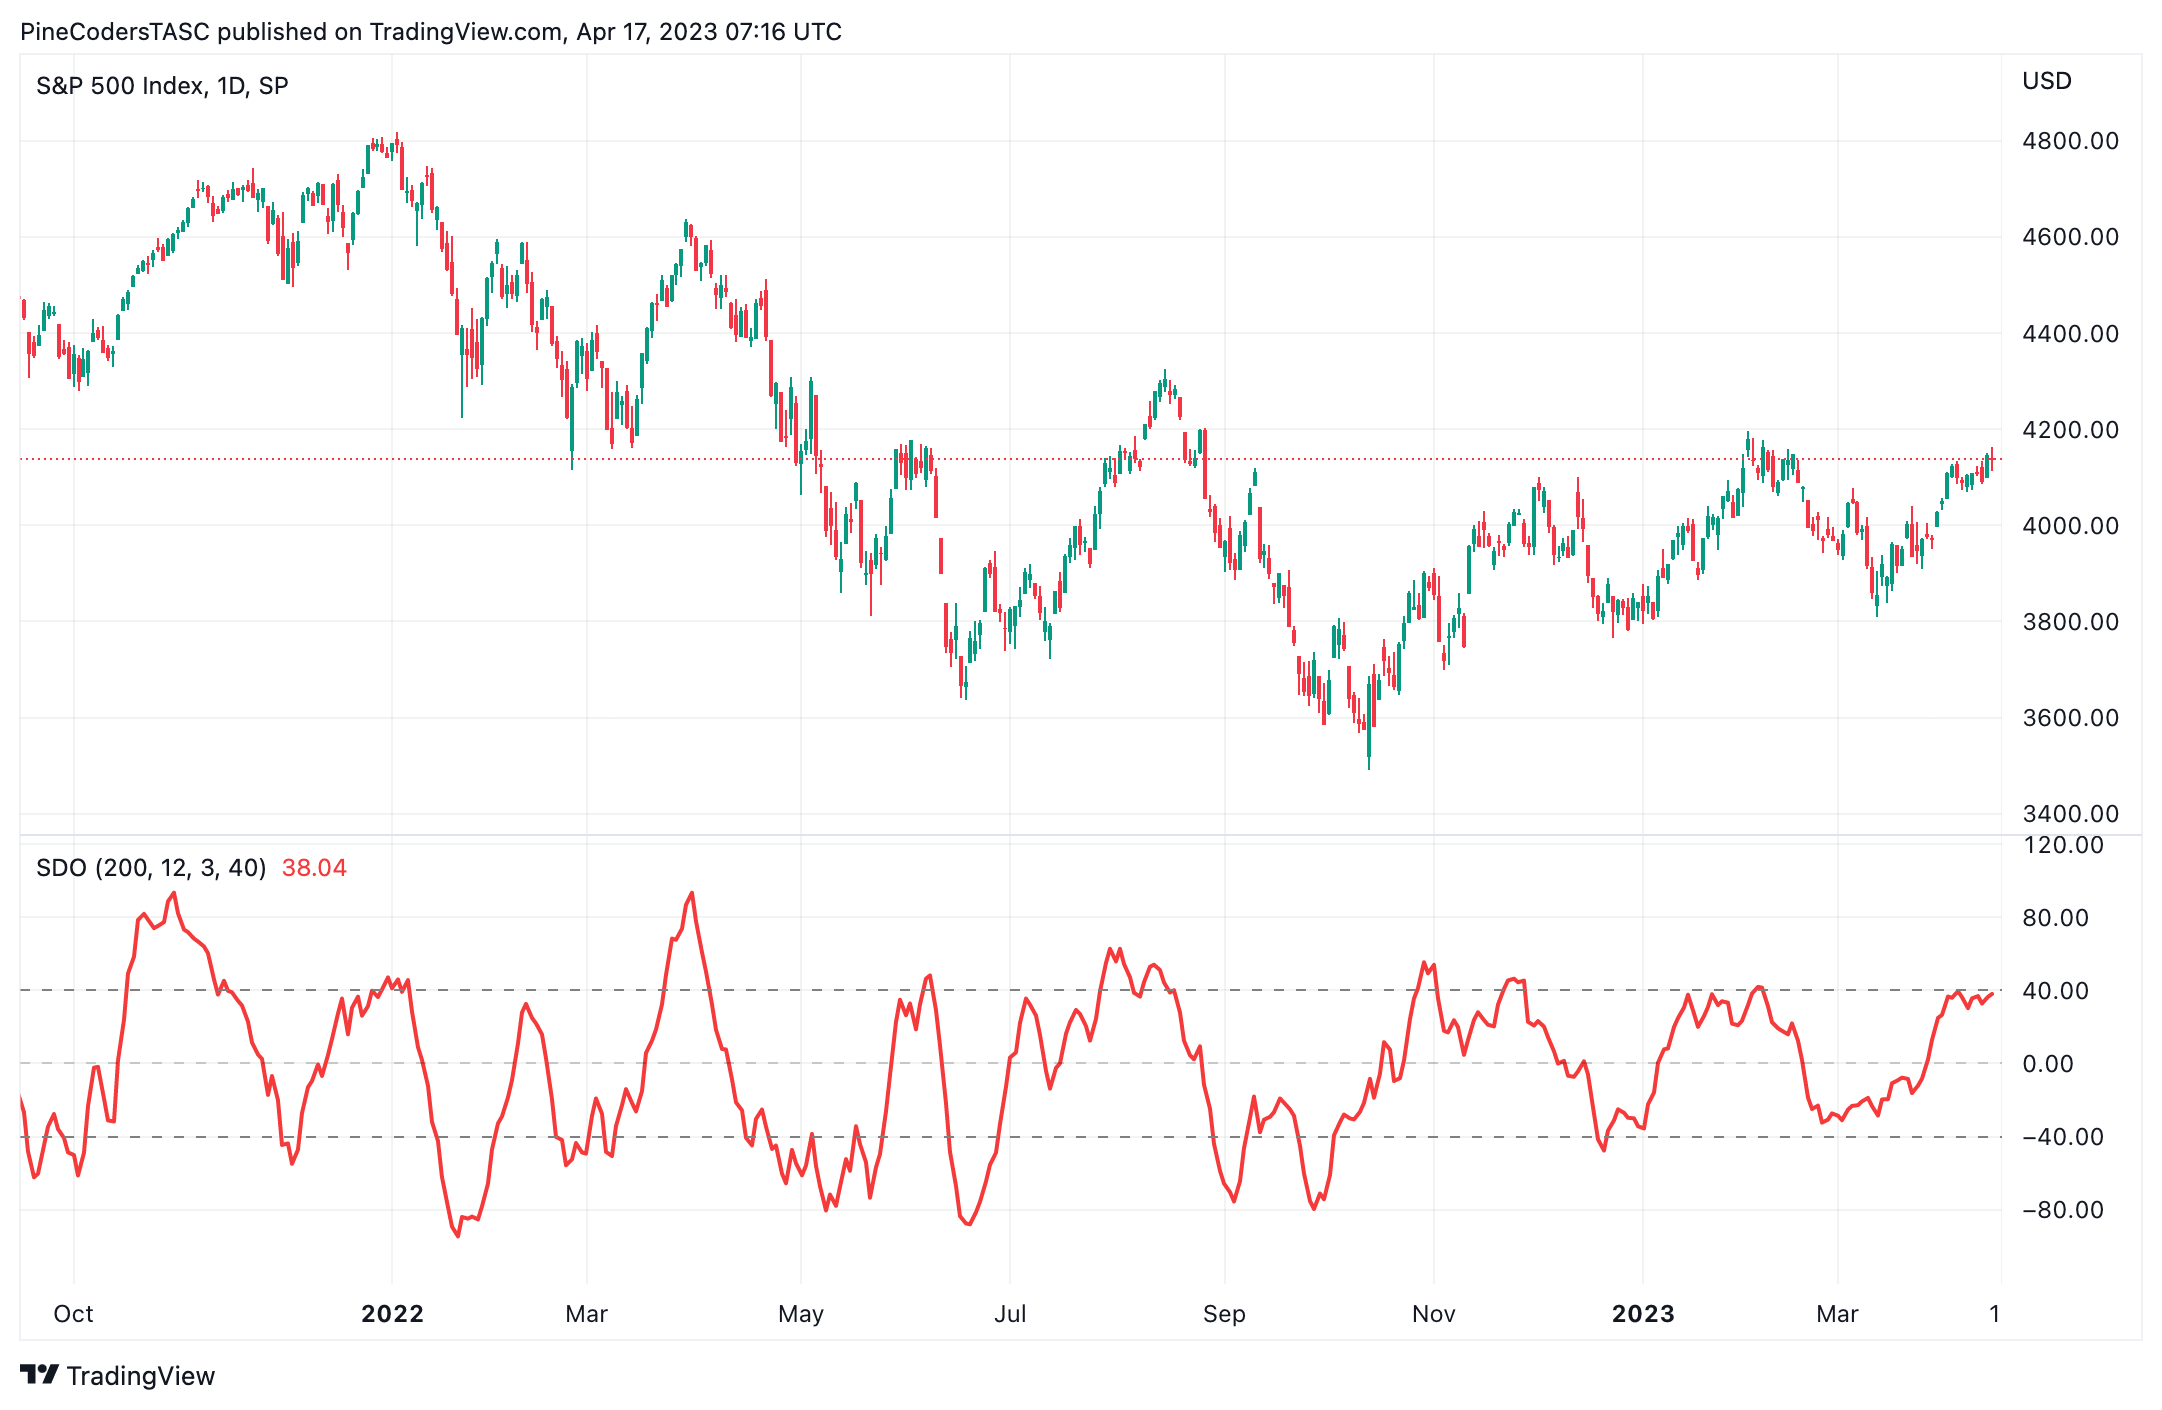
FIGURE 7: TRADINGVIEW. This shows an example of Vitali Apirine’s stochastic distance oscillator applied to a chart of the S&P 500 index.
—PineCoders, for TradingView
www.TradingView.com
BACK TO LIST

Neuroshell Trader: June 2023
The stochastic distance oscillator introduced by Vitali Apirine in his article in this issue can be easily implemented in NeuroShell Trader by selecting new indicator from the insert menu and using the indicator wizard to set up the following indicators:
Change	Momentum(Close,12)
Stoch	SimpleStoch%K(Abs(Change), 200)
SDO	ExpAvg( IfThenElseIfThen(A>B(Change,0), Stoch,A<B(Change,0), Neg(Stoch), 0) )
Users of NeuroShell Trader can go to the Stocks & Commodities section of the NeuroShell Trader free technical support website to download a copy of this or any previous Traders’ Tips. The DynamicExpAvg is a dynamic rate exponential moving average (EMA) custom indicator available for download on the free technical support website along with the Traders’ Tip.

FIGURE 8: NEUROSHELL TRADER. This NeuroShell Trader chart shows the stochastic distance oscillator applied to the SPY.
—Ward Systems Group, Inc.
sales@wardsystems.com
www.neuroshell.com
BACK TO LIST

Optuma: June 2023
Here is an Optuma script formula for Vitali Apirine’s article in this issue, “Stochastic Distance Oscillator.”
$LBPeriod=200;

$Period=40;

$Pds=3;

Dist1 = ABS(CLOSE()-CLOSE(OFFSET=$Period));

D1=(Dist1-LOWESTLOW(Dist1, BARS=$LBPeriod)) / (HIGHESTHIGH(Dist1, BARS=$LBPeriod) - LOWESTLOW(Dist1, BARS=$LBPeriod));

DD1=IF(CLOSE()>CLOSE(OFFSET=$Period),D1, IF(CLOSE()<CLOSE(OFFSET=$Period),D1*-1,0));

MA(DD1, STYLE=Exponential, BARS=$Pds)*100
See Figure 9 for a plot of the stochastic distance oscillator on the SPY. The chart has been colored to highlight the trend: green when the SDO crosses above 40, turning to red when it crosses below −40.
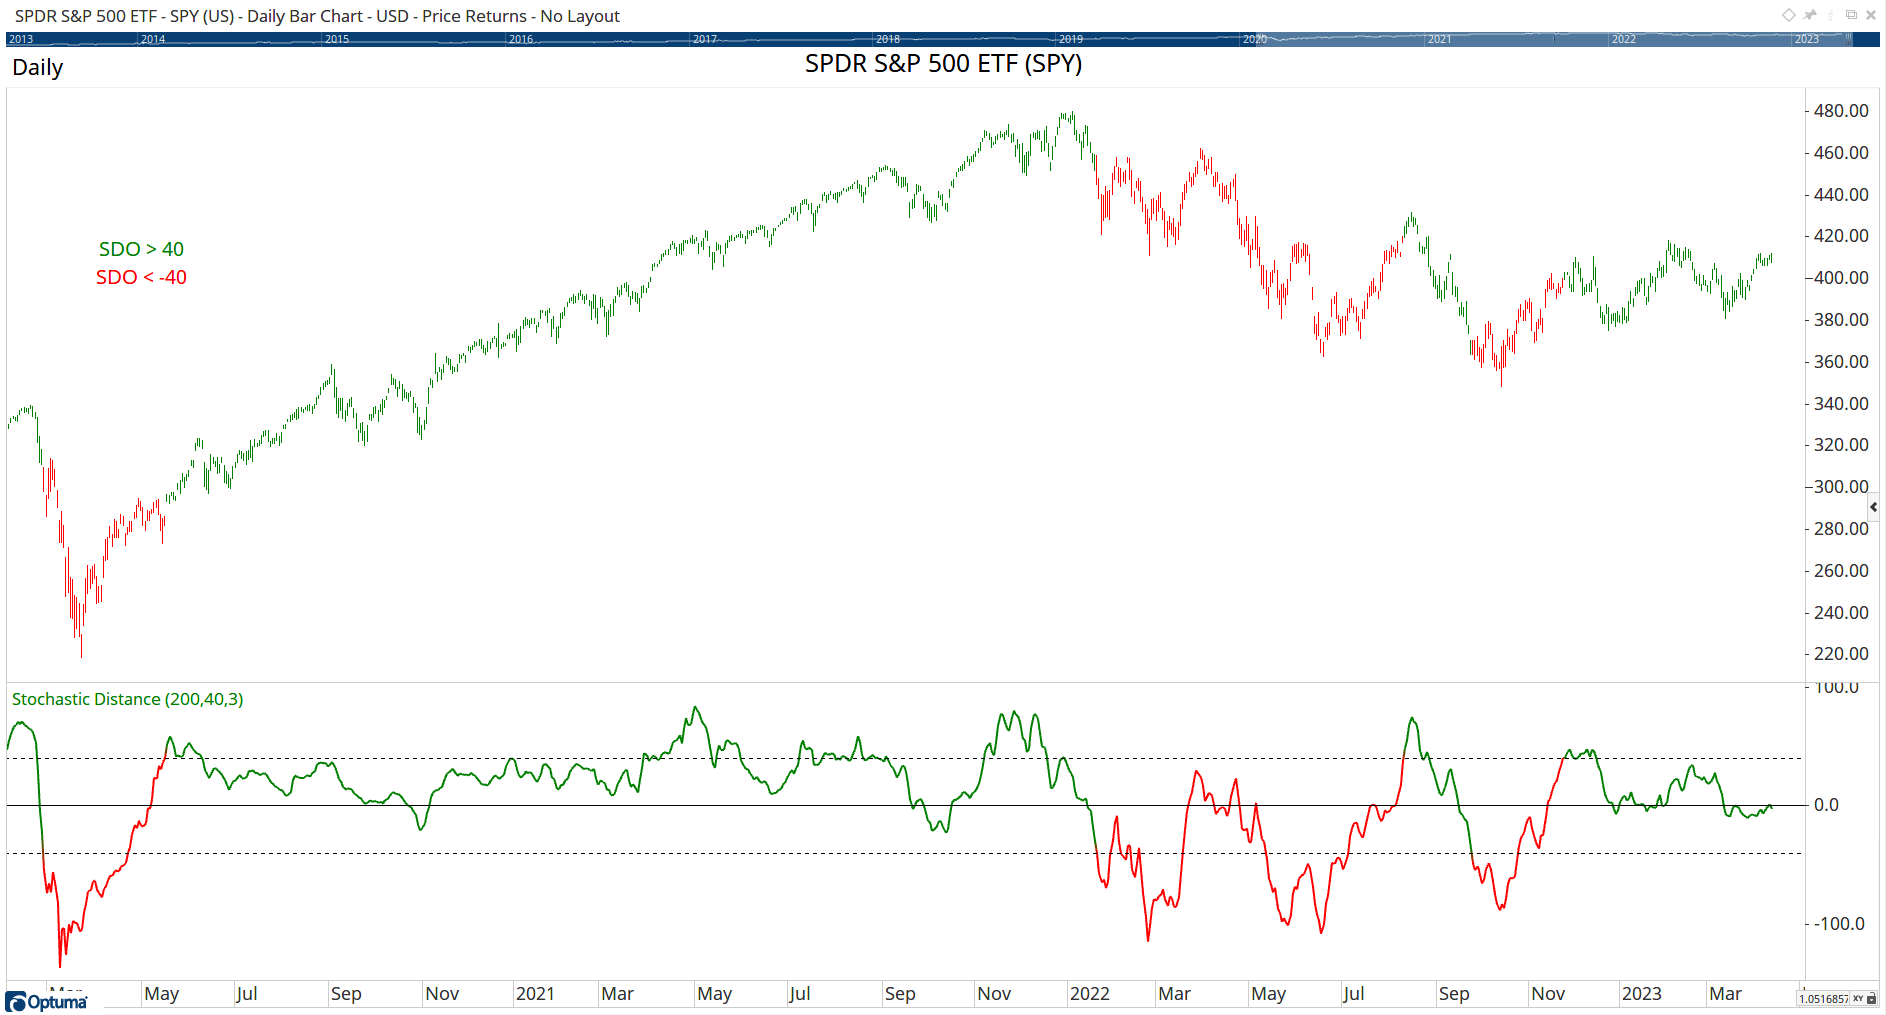
FIGURE 9: OPTUMA. This sample chart displays the stochastic distance oscillator. The chart has been colored to highlight the trend: green when the SDO crosses above 40, turning to red when it crosses below −40.
—support@optuma.com
BACK TO LIST

The Zorro Project: June 2023
In his article in this issue, “Stochastic Distance Oscillator,” Vitali Apirine presents a variation on the classic stochastic oscillator. His stochastic distance oscillator (SDO) compares short-term momentum with a long-term price range, and then filters the result with an EMA. Here is coding for the indicator in C:
var SDO(int LBPeriod,int Period,int Pds)
{
  var Dist = priceC(0)-priceC(Period);
  vars Dists = series(abs(Dist));
  var D = (Dists[0]-MinVal(Dists,LBPeriod))/fix0(MaxVal(Dists,LBPeriod)-MinVal(Dists,LBPeriod));
  return EMA(series(sign(Dist)*D),Pds)*100;
}
Figure 10 replicates one of the author’s charts from his article. It demonstrates on the Zorro platform the SDO(200,40,3) applied to SPY from 2004–2007. The author assumes overbought or oversold conditions where the SDO crosses the −40 / +40 threshold lines.
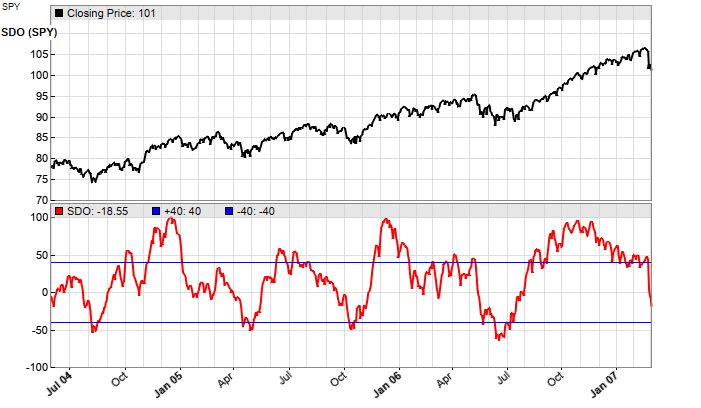
FIGURE 10: ZORRO PROJECT. Here is the SDO(200,40,3) applied to SPY from 2004–2007. The −40/+40 threshold lines are the SDO’s indications of overbought/oversold conditions.
The SDO indicator can be downloaded from the 2023 script repository on https://financial-hacker.com. The Zorro software can be downloaded from https://zorro-project.com.
—Petra Volkova
The Zorro Project by oP group Germany
https://zorro-project.com
BACK TO LIST

Aiq: June 2023
The importable AIQ EDS file based on Vitali Apirine’s article in this issue, “The Stochastic Distance Oscillator,” can be obtained on request via email to info@TradersEdgeSystems.com.
Code for the author’s indicator is set up in the AIQ EDS code file. The code is also shown below. Figure 11 shows a chart of the NASDAQ 100 index (NDX) with the SDO[200,12,3] indicator (green jagged line).
!The Stochastic Distance Oscillator
!Author: Vitali Apirine, TASC June 2023
!Coded by: Richard Denning, 4/15/2023

LBPeriod is 200.
Period is 12.
Pds is 3.
C is [close].
Dist is abs(C-valresult(C,period)).
D is (Dist - lowresult(Dist,LBPeriod))/
       (highresult(Dist,LBPeriod)-lowresult(Dist,LBPeriod)).
DD is iff(C>valresult(C,Period),D,iff(C<valresult(C,Period),-D,0)).
SDO is expavg(DD,Pds)*100.

FIGURE 11: AIQ. Here, the stochastic distance oscillator (SDO) indicator is shown on a chart of the NASDAQ 100 index (NDX). The SDO[200,12,3] indicator is the green jagged line.
—Richard Denning
rdencpa@gmail.com
for AIQ Systems
BACK TO LIST

Trade Navigator: June 2023
We have created a special file to make it easy to download the library in Trade Navigator that is based on the article in this issue, “Stochastic Distance Oscillator” by Vitali Apirine.
The file name is “SC202306.” To download this library, click on Trade Navigator’s file dropdown menu, then select update data. Next, select download special file, then erase the word “upgrade” and type in “SC202306.” Then click the start button. When prompted to upgrade, click the yes button. If prompted to close all software, click on the continue button. Your library will now download. This library contains the indicator named the “stochastic distance oscillator.”
To add the indicator to your chart in Trade Navigator: Open the charting dropdown menu, select the add to chart command, then on the indicators tab, find your named indicator, select it, then click the add button. Repeat this procedure for additional indicators if you wish.
If you need assistance with adding or using the indicator in Trade Navigator, our friendly technical support staff will be happy to help via phone at 719 284-1616 or via the live chat feature at our website.
—Genesis Financial Data
Tech support 719 284-1616
www.TradeNavigator.com
BACK TO LIST
Microsoft Excel: June 2023
In his article in this issue, “Stochastic Distance Oscillator,” Vitali Apirine presents an indicator of price momentum. The indicator is based on the classic stochastic oscillator.
Calculating the stochastic distance oscillator is simple and direct. The base element is “distance,” defined as the absolute difference between the close of the current bar and the close “x” bars in the past.
Step 1: Take the standard stochastic oscillator formulation and replace “closing price” everywhere it appears with “distance” as defined above. You wind up with a value that ranges from 0 to 100
Step 2: We need to take into account that the difference between the close of the current bar and the close “x” bars in the past (before taking the absolute value) could have been positive (an upward slope) or negative (a downward slope). We use this to set the sign of our current “distance” stochastic value.
The result is an indicator that can range from −100 to +100.
Plus and minus 40 are suggested as the thresholds for oversold and overbought levels, comparable to the 20 and 80 typically used with the standard stochastic oscillator.
Figure 12 shows a 12-bar distance with the min and max of distance over the preceding 200 bars. Figure 13 plots the stochastic distance oscillator (SDO), a momentum indicator.

FIGURE 12: EXCEL. This demonstrates a 12-bar “distance” with the min and max of distance over the preceding 200 bars.

FIGURE 13: EXCEL. This shows an example of the stochastic distance oscillator (SDO), a momentum indicator.
To download this spreadsheet: The spreadsheet file for this Traders’ Tip can be downloaded here. To successfully download it, follow these steps:
- Right-click on the Excel file link, then
- Select “save as” (or “save target as”) to place a copy of the spreadsheet file on your hard drive.
—Ron McAllister
Excel and VBA programmer
rpmac_xltt@sprynet.com
BACK TO LIST
Originally published in the June 2023 issue of
Technical Analysis of STOCKS & COMMODITIES magazine.
All rights reserved. © Copyright 2023, Technical Analysis, Inc.


