TRADERS’ TIPS
July 2023

For this month’s Traders’ Tips, the focus is Barbara Star’s article in this issue, “Stay On Track With The Supertrend Indicator.” Here, we present the July 2023 Traders’ Tips code with possible implementations in various software.
You can right-click on any chart to open it in a new tab or window and view it at it’s originally supplied size, often much larger than the version printed in the magazine.
The Traders’ Tips section is provided to help the reader implement a selected technique from an article in this issue or another recent issue. The entries here are contributed by software developers or programmers for software that is capable of customization.

TradeStation: July 2023
In her article in this issue, “Stay On Track With The Supertrend Indicator,” author Barbara Star describes the supertrend indicator and how it can be used as means for traders to stay in sync with the larger trend. She explains how J. Welles Wilder’s average true range (ATR) forms a foundation for supertrend calculations. The ATR does not measure price direction, but rather provides a measure of volatility over a specified period. The supertrend indicator, on the other hand, provides a wider viewpoint into trend direction. Additionally, the indicator provides price levels where a change in trend would occur.
The EasyLanguage version of the indicator provided here can be adjusted to plot either one line or two lines by adjusting the input NumPlotLines_1_or_2.
Indicator: Supertrend

// TASC JUL 2023
// Supertrend
// Barbara Star

inputs:
	UpColor( Green ),
	DownColor( Red ),
	ATRLength( 10 ),
	Multiplier( 3 ),
	NumPlotLines_1_or_2( 1 );

variables:
	ATRValue( 0 ),
	BTop( 0 ),
	Top( 0 ),
	BBottom( 0 ),
	Bottom( 0 ),
	ST( 0 ),
	PlotColor( 0 );

ATRValue = AvgTrueRange(ATRLength);

BTop = MedianPrice + Multiplier * ATRValue;
BBottom = MedianPrice - Multiplier * ATRValue;

Top = Iff(BTop < Top[1]
 or Close[1] > Top[1], BTop, Top[1]);

Bottom = Iff(BBottom > Bottom[1]
 or Close[1] < Bottom[1], BBottom, Bottom[1]);

if Close < ST[1] then
begin
	ST = Top;
	PlotColor = DownColor;
end
else
begin
	ST = Bottom;
	PlotColor = UpColor;
end;

if NumPlotLines_1_or_2 = 2 then
begin
	Plot1(Top, "Upper Line", PlotColor);
	Plot2(Bottom, "Lower Line", PlotColor);
end
else
begin
	Plot3(ST, "Supertrend", PlotColor);
end;
A sample chart is shown in Figure 1.

FIGURE 1: TRADESTATION. This daily chart of the S&P 500 ETF SPY shows a portion of 2022 and 2023 with the supertrend indicator applied with an ATR length of 10 and a multiplier of 3.
This article is for informational purposes. No type of trading or investment recommendation, advice, or strategy is being made, given, or in any manner provided by TradeStation Securities or its affiliates.
—John Robinson
TradeStation Securities, Inc.
www.TradeStation.com
BACK TO LIST
MetaQuotes: July 2023
In “Stay On Track With The Supertrend Indicator” in this issue, Barbara Star discusses the supertrend indicator. Shown here is coding to implement the indicator on the MetaQuotes platform.
In addition to coding for the indicator, I am also providing coding for a function.
//+------------------------------------------------------------------+
//|                                                   Supertrend.mq5 |
//|                               Copyright © July 2023, Shaun Bosch |
//|                                              shadavbos@gmail.com |
//+------------------------------------------------------------------+
#property copyright "Copyright © July 2023, Shaun Bosch"
#property link      "shadavbos@gmail.com"
#property version   "1.00"
#property indicator_chart_window
#property indicator_buffers 11
#property indicator_plots   4
//--- plot Filling
#property indicator_label1  "Up Trend;Down Trend"
#property indicator_type1   DRAW_FILLING
#property indicator_color1  clrGreen,clrRed
#property indicator_style1  STYLE_SOLID
#property indicator_width1  1
//--- plot Supertrend Line
#property indicator_label2  "Supertrend"
#property indicator_type2   DRAW_COLOR_LINE
#property indicator_color2  clrDodgerBlue,clrMagenta
#property indicator_style2  STYLE_SOLID
#property indicator_width2  2
//--- plot Buy Signal
#property indicator_label3  "Buy Signal"
#property indicator_type3   DRAW_ARROW
#property indicator_color3  clrDodgerBlue
#property indicator_style3  STYLE_SOLID
#property indicator_width3  1
//--- plot Sell Signal
#property indicator_label4  "Sell Signal"
#property indicator_type4   DRAW_ARROW
#property indicator_color4  clrMagenta
#property indicator_style4  STYLE_SOLID
#property indicator_width4  1
//--- enumerations
enum ENUM_RATES_LIST
  {
   RATES_OPEN,                // Open O
   RATES_HIGH,                // High H
   RATES_LOW,                 // Low L
   RATES_CLOSE,               // Close C
   RATES_MEDIAN,              // Median (H+L)/2
   RATES_TYPICAL,             // Typical (H+L+C)/3
   RATES_WEIGHTED,            // Weighted (H+L+C+C)/4
   RATES_AVERAGE,             // Average (O+H+L+C)/4
   RATES_MEDIAN_BODY,         // Median Body (O+C)/2
   RATES_TREND_BIAS,          // Trend Bias if C > O then (H+C)/2 else (L+C)/2
   RATES_EXTREME_TREND_BIAS   // Extreme Trend Bias if C > O then H else L
  };
enum ENUM_PLOT_LIST
  {
   PLOT_LINE_ONLY,            // Line Only
   PLOT_FILLING_ONLY,         // Filling Only
   PLOT_ARROWS_ONLY,          // Arrows Only
   PLOT_LINE_FILLING,         // Line and Filling
   PLOT_LINE_ARROWS,          // Line and Arrows
   PLOT_FILLING_ARROWS,       // Filling and Arrows
   PLOT_ALL                   // All
  };
//--- input parameters
input int               inp_atr_period             = 10;             // ATR Period (min val: 1; step val: 1)
input double            inp_atr_multiplier         = 3.0;            // ATR Multiplier (min val: 0.1; step val: 0.1)
input int               inp_shift                  = 0;              // Shift Indicator along Time Axis (Bars)
input ENUM_RATES_LIST   inp_rates                  = RATES_MEDIAN;   // Price Source
input ENUM_PLOT_LIST    inp_plot_style             = PLOT_ALL;       // Plot Styling
//--- indicator buffers
double                  filling_up[];
double                  filling_down[];
double                  supertrend_line[];
double                  supertrend_colors[];
double                  signal_buy[];
double                  signal_sell[];
double                  rates[];
double                  supertrend_calc[];
double                  temp1[], temp2[], temp3[];
//--- indicator variables
int                     atr_period;
double                  atr_multiplier;
//+------------------------------------------------------------------+
//| Custom indicator initialization function                         |
//+------------------------------------------------------------------+
int OnInit()
  {
//--- check input parameters
   atr_period = inp_atr_period < 1 ? 1 : inp_atr_period;
   atr_multiplier = inp_atr_multiplier < 0.1 ? 0.1 : NormalizeDouble(inp_atr_multiplier, 1);
//--- indicator buffers mapping
   SetIndexBuffer(0, filling_up, INDICATOR_DATA);
   SetIndexBuffer(1, filling_down, INDICATOR_DATA);
   SetIndexBuffer(2, supertrend_line, INDICATOR_DATA);
   SetIndexBuffer(3, supertrend_colors, INDICATOR_COLOR_INDEX);
   SetIndexBuffer(4, signal_buy, INDICATOR_DATA);
   SetIndexBuffer(5, signal_sell, INDICATOR_DATA);
   SetIndexBuffer(6, rates, INDICATOR_CALCULATIONS);
   SetIndexBuffer(7, supertrend_calc, INDICATOR_CALCULATIONS);
   SetIndexBuffer(8, temp1, INDICATOR_CALCULATIONS);
   SetIndexBuffer(9, temp2, INDICATOR_CALCULATIONS);
   SetIndexBuffer(10, temp3, INDICATOR_CALCULATIONS);
//--- accuracy of drawing of indicator values
   IndicatorSetInteger(INDICATOR_DIGITS, _Digits);
//--- setting a code from the Wingdings charset as the property of PLOT_ARROW
   PlotIndexSetInteger(2, PLOT_ARROW, 164);
   PlotIndexSetInteger(3, PLOT_ARROW, 164);
//--- Set the vertical shift of arrows in pixels
   PlotIndexSetInteger(2, PLOT_ARROW_SHIFT, 0);
   PlotIndexSetInteger(3, PLOT_ARROW_SHIFT, -0);
//--- set indicator name display
   string rates_name = inp_rates == RATES_OPEN ? "Open" : inp_rates == RATES_HIGH ? "High" : inp_rates == RATES_LOW ? "Low" : inp_rates == RATES_CLOSE ? "Close" : inp_rates == RATES_MEDIAN ? "Median" : inp_rates == RATES_TYPICAL ? "Typical" : inp_rates == RATES_WEIGHTED ? "Weighted" : inp_rates == RATES_AVERAGE ? "Average" : inp_rates == RATES_MEDIAN_BODY ? "Median Body" : inp_rates == RATES_TREND_BIAS ? "Trend Bias" : inp_rates == RATES_EXTREME_TREND_BIAS ? "Extreme Trend Bias" : " ";
   string short_name = "SUPERTREND (" + IntegerToString(atr_period) + ", " + DoubleToString(atr_multiplier, 1) + ", " + rates_name + ")";
   IndicatorSetString(INDICATOR_SHORTNAME, short_name);
//--- show indicator name on screen
   Comment(short_name);
//--- shift of indicator plotting along the time axis in bars
   PlotIndexSetInteger(0, PLOT_SHIFT, inp_shift);
   PlotIndexSetInteger(1, PLOT_SHIFT, inp_shift);
   PlotIndexSetInteger(2, PLOT_SHIFT, inp_shift);
   PlotIndexSetInteger(3, PLOT_SHIFT, inp_shift);
//--- an empty value for plotting, for which there is no drawing
   PlotIndexSetDouble(0, PLOT_EMPTY_VALUE, EMPTY_VALUE);
   PlotIndexSetDouble(1, PLOT_EMPTY_VALUE, EMPTY_VALUE);
   PlotIndexSetDouble(2, PLOT_EMPTY_VALUE, EMPTY_VALUE);
   PlotIndexSetDouble(3, PLOT_EMPTY_VALUE, EMPTY_VALUE);
//--- display candlestick / bar / line chart above all indicators
   ChartSetInteger(0, CHART_BRING_TO_TOP, 0, true);
//--- successful initialization
   return(INIT_SUCCEEDED);
  }
//+------------------------------------------------------------------+
//| Custom indicator deinitialization function                       |
//+------------------------------------------------------------------+
void OnDeinit(const int reason)
  {
   Comment(""); // clear the chart from comments after deleting the indicator
  }
//+------------------------------------------------------------------+
//| Custom indicator iteration function                              |
//+------------------------------------------------------------------+
int OnCalculate(const int rates_total,
                const int prev_calculated,
                const datetime &time[],
                const double &open[],
                const double &high[],
                const double &low[],
                const double &close[],
                const long &tick_volume[],
                const long &volume[],
                const int &spread[])
  {
//--- populate rates buffer
   fu_RATES(rates_total, prev_calculated, inp_rates, open, high, low, close, rates);
//--- populate supertrend calculation buffer
   on_SUPERTREND(rates_total, prev_calculated, atr_period, atr_multiplier, rates, high, low, close, temp1, temp2, temp3, supertrend_calc);
//--- bar index start
   int bar_index;
   if(prev_calculated == 0)
      bar_index = 0;
   else
      bar_index = prev_calculated - 1;
//--- main loop
   for(int i = bar_index; i < rates_total && !_StopFlag; i++)
     {
      if(i < atr_period)
        {
         filling_up[i] = EMPTY_VALUE;
         filling_down[i] = EMPTY_VALUE;
         supertrend_line[i] = EMPTY_VALUE;
         supertrend_colors[i] = EMPTY_VALUE;
         signal_buy[i] = EMPTY_VALUE;
         signal_sell[i] = EMPTY_VALUE;
        }
      else
        {
         filling_up[i] = inp_plot_style == PLOT_FILLING_ONLY || inp_plot_style == PLOT_LINE_FILLING || inp_plot_style == PLOT_FILLING_ARROWS || inp_plot_style == PLOT_ALL ? close[i] : EMPTY_VALUE;
         filling_down[i] = inp_plot_style == PLOT_FILLING_ONLY || inp_plot_style == PLOT_LINE_FILLING || inp_plot_style == PLOT_FILLING_ARROWS || inp_plot_style == PLOT_ALL ? supertrend_calc[i] : EMPTY_VALUE;
         supertrend_line[i] = inp_plot_style == PLOT_LINE_ONLY || inp_plot_style == PLOT_LINE_FILLING || inp_plot_style == PLOT_LINE_ARROWS || inp_plot_style == PLOT_ALL ? supertrend_calc[i] : EMPTY_VALUE;
         supertrend_colors[i] = inp_plot_style == PLOT_LINE_ONLY || inp_plot_style == PLOT_LINE_FILLING || inp_plot_style == PLOT_LINE_ARROWS || inp_plot_style == PLOT_ALL ? rates[i] > supertrend_calc[i] ? 0.0 : 1.0 : EMPTY_VALUE;
         signal_buy[i] = inp_plot_style == PLOT_ARROWS_ONLY || inp_plot_style == PLOT_LINE_ARROWS || inp_plot_style == PLOT_FILLING_ARROWS || inp_plot_style == PLOT_ALL ? rates[i] > supertrend_calc[i] && rates[i - 1] < supertrend_calc[i - 1] ? supertrend_calc[i] : EMPTY_VALUE : EMPTY_VALUE;
         signal_sell[i] = inp_plot_style == PLOT_ARROWS_ONLY || inp_plot_style == PLOT_LINE_ARROWS || inp_plot_style == PLOT_FILLING_ARROWS || inp_plot_style == PLOT_ALL ? rates[i] < supertrend_calc[i] && rates[i - 1] > supertrend_calc[i - 1] ? supertrend_calc[i] : EMPTY_VALUE : EMPTY_VALUE;
        }
     }
//--- return value of prev_calculated for next call
   return(rates_total);
  }
//+------------------------------------------------------------------+
//| Get Rates from ENUM_RATES_LIST (RATES)                           |
//+------------------------------------------------------------------+
//           //--- System bar_index references:
int fu_RATES(const int rates_total,
             const int prev_calculated,
             //--- Input variables and arrays:
             const ENUM_RATES_LIST rates_list,
             const double &open[], // Open Price
             const double &high[], // High Price
             const double &low[], // Low Price
             const double &close[], // Close Price
             //--- Output arrays:
             double &result[])
  {
//--- bar index start
   int bar_index;
   if(prev_calculated == 0)
      bar_index = 0;
   else
      bar_index = prev_calculated - 1;
//--- main loop
   for(int i = bar_index; i < rates_total && !_StopFlag; i++)
     {
      switch(rates_list)
        {
         case RATES_OPEN:
            result[i] = open[i];
            break;
         case RATES_HIGH:
            result[i] = high[i];
            break;
         case RATES_LOW:
            result[i] = low[i];
            break;
         case RATES_CLOSE:
            result[i] = close[i];
            break;
         case RATES_MEDIAN:
            result[i] = (high[i] + low[i]) / 2.0;
            break;
         case RATES_TYPICAL:
            result[i] = (high[i] + low[i] + close[i]) / 3.0;
            break;
         case RATES_WEIGHTED:
            result[i] = (high[i] + low[i] + close[i] + close[i]) / 4.0;
            break;
         case RATES_AVERAGE:
            result[i] = (open[i] + high[i] + low[i] + close[i]) / 4.0;
            break;
         case RATES_MEDIAN_BODY:
            result[i] = (open[i] + close[i]) / 2.0;
            break;
         case RATES_TREND_BIAS:
            if(close[i] > open[i])
               result[i] = (high[i] + close[i]) / 2.0;
            else
               result[i] = (low[i] + close[i]) / 2.0;
            break;
         case RATES_EXTREME_TREND_BIAS:
            if(close[i] > open[i])
               result[i] = high[i];
            else
               result[i] = low[i];
            break;
        }
     }
   return(rates_total);
  }
//+------------------------------------------------------------------+
//| Supertrend Indicator - Single Line (SUPERTREND)                  |
//+------------------------------------------------------------------+
//--- by Barbara Star (TASC Magazine July 2023)
//                //--- System bar_index references:
int on_SUPERTREND(const int rates_total,
                  const int prev_calculated,
                  //--- Input variables and arrays:
                  const int atr_length, // ATR Period (min val: 1; step val: 1; default val: 10)
                  const double atr_multi, // ATR Multiplier (min val: 0.1; step val: 0.1; default val: 3.0)
                  const double &source[], // Source
                  const double &high[], // High Price
                  const double &low[], // Low Price
                  const double &close[], // Close Price
                  //--- Calculation arrays (3):
                  double &atr[],
                  double &top[],
                  double &bot[],
                  //--- Output arrays:
                  double &result[])
  {
//--- bar index start
   int bar_index;
   if(prev_calculated == 0)
      bar_index = 0;
   else
      bar_index = prev_calculated - 1;
//--- main loop
   for(int i = bar_index; i < rates_total && !_StopFlag; i++)
     {
      if(i < atr_length)
        {
         atr[i] = 0.0;
         top[i] = 0.0;
         bot[i] = 0.0;
         result[i] = EMPTY_VALUE;
        }
      else
        {
         double alpha = 1.0 / double(atr_length);
         atr[i] = fmax(high[i] - low[i], fmax(fabs(high[i] - close[i - 1]), fabs(low[i] - close[i - 1]))) * alpha + (MathIsValidNumber(atr[i - 1]) ? atr[i - 1] : 0.0) * (1.0 - alpha);
         double dis = atr_multi * atr[i];
         double btop = source[i] + dis;
         double bbot = source[i] - dis;
         top[i] = btop < (MathIsValidNumber(result[i - 1]) ? result[i - 1] : 0.0) || close[i - 1] > (MathIsValidNumber(result[i - 1]) ? result[i - 1] : 0.0) ? btop : (MathIsValidNumber(result[i - 1]) ? result[i - 1] : 0.0);
         bot[i] = bbot > (MathIsValidNumber(result[i - 1]) ? result[i - 1] : 0.0) || close[i - 1] < (MathIsValidNumber(result[i - 1]) ? result[i - 1] : 0.0) ? bbot : (MathIsValidNumber(result[i - 1]) ? result[i - 1] : 0.0);
         result[i] = (MathIsValidNumber(result[i - 1]) ? result[i - 1] : 0.0) == top[i - 1] ? close[i] <= top[i] ? top[i] : bot[i] : (MathIsValidNumber(result[i - 1]) ? result[i - 1] : 0.0) == bot[i - 1] ? close[i] >= bot[i] ? bot[i] : top[i] : top[i];
        }
     }
   return(rates_total);
  }
//+------------------------------------------------------------------+
//+------------------------------------------------------------------+
//| Supertrend Indicator - Single Line (SUPERTREND)                  |
//+------------------------------------------------------------------+
//--- by Barbara Star (TASC Magazine July 2023)
//                //--- System bar_index references:
int on_SUPERTREND(const int rates_total,
                  const int prev_calculated,
                  //--- Input variables and arrays:
                  const int atr_length, // ATR Period (min val: 1; step val: 1; default val: 10)
                  const double atr_multi, // ATR Multiplier (min val: 0.1; step val: 0.1; default val: 3.0)
                  const double &source[], // Source
                  const double &high[], // High Price
                  const double &low[], // Low Price
                  const double &close[], // Close Price
                  //--- Calculation arrays (3):
                  double &atr[],
                  double &top[],
                  double &bot[],
                  //--- Output arrays:
                  double &result[])
  {
//--- bar index start
   int bar_index;
   if(prev_calculated == 0)
      bar_index = 0;
   else
      bar_index = prev_calculated - 1;
//--- main loop
   for(int i = bar_index; i < rates_total && !_StopFlag; i++)
     {
      if(i < atr_length)
        {
         atr[i] = 0.0;
         top[i] = 0.0;
         bot[i] = 0.0;
         result[i] = EMPTY_VALUE;
        }
      else
        {
         double alpha = 1.0 / double(atr_length);
         atr[i] = fmax(high[i] - low[i], fmax(fabs(high[i] - close[i - 1]), fabs(low[i] - close[i - 1]))) * alpha + (MathIsValidNumber(atr[i - 1]) ? atr[i - 1] : 0.0) * (1.0 - alpha);
         double dis = atr_multi * atr[i];
         double btop = source[i] + dis;
         double bbot = source[i] - dis;
         top[i] = btop < (MathIsValidNumber(result[i - 1]) ? result[i - 1] : 0.0) || close[i - 1] > (MathIsValidNumber(result[i - 1]) ? result[i - 1] : 0.0) ? btop : (MathIsValidNumber(result[i - 1]) ? result[i - 1] : 0.0);
         bot[i] = bbot > (MathIsValidNumber(result[i - 1]) ? result[i - 1] : 0.0) || close[i - 1] < (MathIsValidNumber(result[i - 1]) ? result[i - 1] : 0.0) ? bbot : (MathIsValidNumber(result[i - 1]) ? result[i - 1] : 0.0);
         result[i] = (MathIsValidNumber(result[i - 1]) ? result[i - 1] : 0.0) == top[i - 1] ? close[i] <= top[i] ? top[i] : bot[i] : (MathIsValidNumber(result[i - 1]) ? result[i - 1] : 0.0) == bot[i - 1] ? close[i] >= bot[i] ? bot[i] : top[i] : top[i];
        }
     }
   return(rates_total);
  }
Figures 2 through 4 show the input menus for the indicator. Figure 2 shows the dropdown menu for the plot styling. Figures 3 and 4 shows the dropdown menu for the price source. Figure 5 shows an example of the indicator plotted on a daily chart of EURUSD.
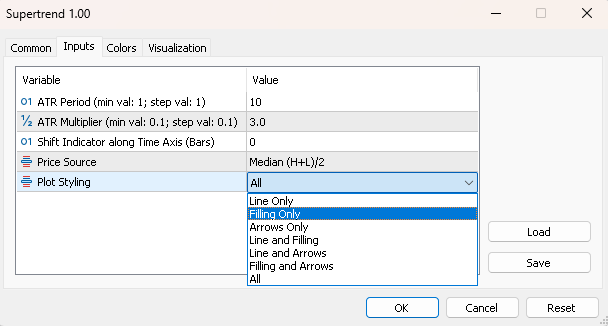
FIGURE 2: METAQUOTES INPUTS—PLOT STYLING
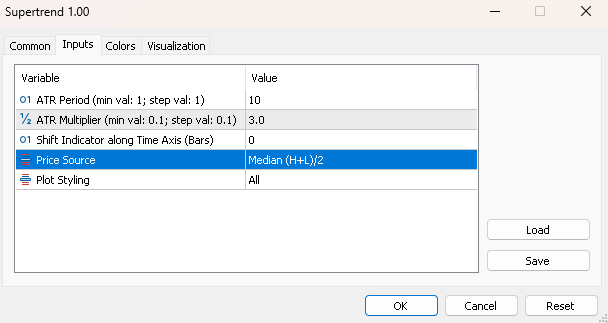
FIGURE 3: METAQUOTES—PRICE SOURCE
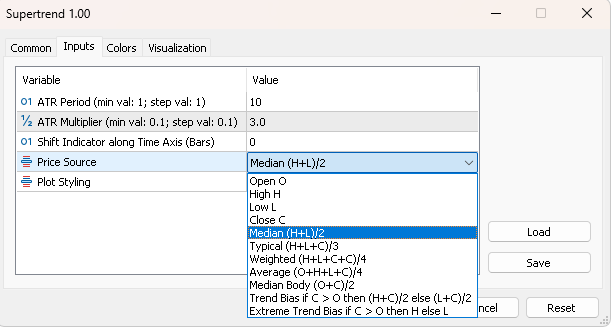
FIGURE 4: METAQUOTES—PRICE SOURCE
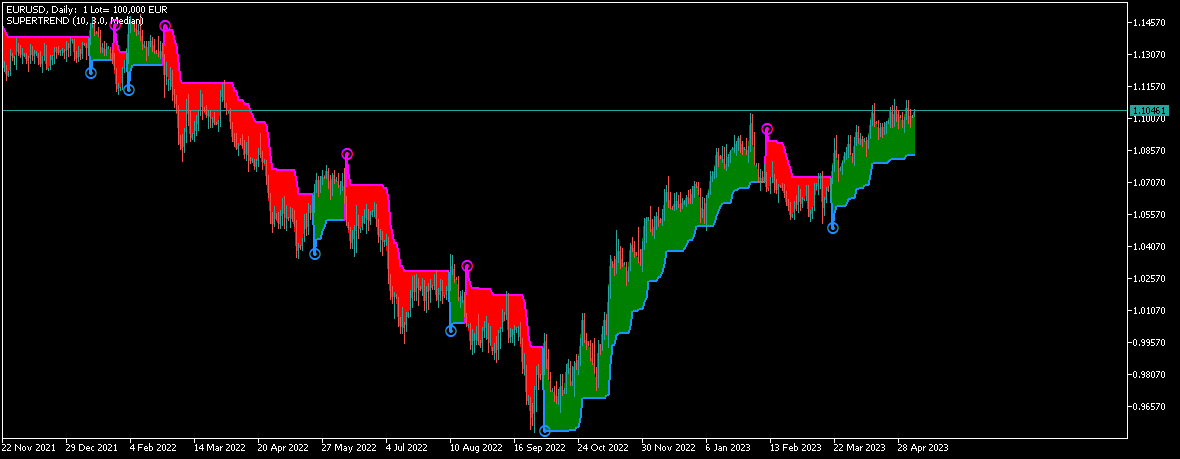
FIGURE 5: METAQUOTES. This demonstrates the supertrend indicator on a daily chart of EURUSD.
—Shaun Bosch
shadavbos@gmail.com
BACK TO LIST

Wealth-Lab.com: July 2023
Wealth-Lab aims to please the trader looking to implement a trailing exit, offering different flavors of them such as the chandelier exit, the NRTR, or ATRTrail. For users of the supertrend indicator, we’ve got you covered: just install the PowerPack extension.
Barbara Star’s article in this issue, “Stay On Track With The Supertrend Indicator,” brings some thought-provoking ideas to explore. Here, we’re going to focus on trading during consolidations. We can observe that while the indicator forms a horizontal line, prices have begun moving sideways.
One tactic for when price begins to consolidate is to stand aside or simply stick to a long position. As an improvement, a second system can be added to support the trend-following system while the supertrend trailing stop hasn’t been breached. For example, here are two sets of rules that could be used to take both long and short trades during a consolidation:
Pullback system (long):
- If the close is above the supertrend and its line on the chart is horizontal, wait for two or more declining highs to buy on a stop tomorrow at today’s high.
- If the close is below the supertrend, sell the long position (trend change).
- Sell at limit of the entry price + 2 × 10-day ATR.
- Sell at stop of the two-day’s lowest low.
Countertrend system (short):
- If the close is above the supertrend and its line on the chart is horizontal, wait for two or more rising lows to short on a stop tomorrow at today’s low.
- If the close is above the supertrend, cover the short position (trend change).
- Cover at limit of the entry price − 2 × 10-day ATR.
- Cover at stop of the two-day’s highest high.
See Figure 6 for some sample trades from the indicator on a daily chart of SPY, which shows some recent sideways movement. A transparent blue vertical wash illustrates the areas of price consolidations. This example confirms the low exposure to the market that was seen in backtested results. On average, a trade is held for four days.

FIGURE 6: WEALTH-LAB. A transparent blue vertical wash on a chart of SPY with the supertrend indicator illustrates areas of price consolidations. Data provided by Wealth-Data.
using WealthLab.PowerPack;
using WealthLab.Backtest;
using System;
using WealthLab.Core;
using WealthLab.Data;
using WealthLab.Indicators;
using System.Collections.Generic;

namespace WealthScript1
{
    public class MyStrategy : UserStrategyBase
    {
		UpDown ud;
		SuperTrend st;

        public override void Initialize( BarHistory bars)
        {
			st = SuperTrend.Series(bars, 10,3.00);
			ud = UpDown.Series(st, 1,0.00);

			PlotIndicator( st, WLColor.FromArgb(255, 220, 20, 60), PlotStyle.Dots);
			PlotIndicator( ud, WLColor.FromArgb(255,220,20,60), PlotStyle.ThickHistogram);
        }

        public override void Execute( BarHistory bars, int idx)
        {
			double atr = ATR.Series(bars, 10)[idx];
			bool bullishConsolidation = (bars.Close[idx] > st[idx]) && ud[idx] == 0;
			bool bearishConsolidation = (bars.Close[idx] < st[idx]) && ud[idx] == 0;
			bool decline = ConsecDown.Series(bars.High, 1)[idx] >= 2;
			bool rise = ConsecUp.Series(bars.Low, 1)[idx] >= 2;
			if(bullishConsolidation)
				SetBackgroundColor(bars, idx,WLColor.FromArgb(15, WLColor.Blue));

			/* long trades */
			if (! HasOpenPosition (bars, PositionType.Long))
			{
				if(bullishConsolidation && decline)
					PlaceTrade( bars, TransactionType.Buy, OrderType.Stop, bars.High[idx]);
			}
			else
			{
				if(!bullishConsolidation && (bars.Close[idx] < st[idx]))
					PlaceTrade( bars, TransactionType.Sell, OrderType.Market, 0, "Trend change");
				else
				{
					PlaceTrade( bars, TransactionType.Sell, OrderType.Limit, LastPosition.EntryPrice + 2.0 * atr, "Fast track");
					PlaceTrade( bars, TransactionType.Sell, OrderType.Stop, Lowest.Series(bars.Low, 2)[idx], "Stop");
				}
			}

			/* short trades */
			if (! HasOpenPosition (bars, PositionType.Short))
			{
				if (bullishConsolidation && rise)
					PlaceTrade( bars, TransactionType.Short, OrderType.Stop, bars.Low[idx]);
			}
			else
			{
				if(!bullishConsolidation && (bars.Close[idx] > st[idx]))
					PlaceTrade( bars, TransactionType.Cover, OrderType.Market, 0, "Trend strenghening");
				else
				{
					PlaceTrade( bars, TransactionType.Cover, OrderType.Limit, LastPosition.EntryPrice - 2.0 * atr, "Fast track");
					PlaceTrade( bars, TransactionType.Cover, OrderType.Stop, Highest.Series(bars.High, 2)[idx], "Stop");
				}
			}
		}
    }
}
—Gene Geren (Eugene)
Wealth-Lab team
www.wealth-lab.com
BACK TO LIST

NinjaTrader: July 2023
The supertrend indicator, which is described in “Stay On Track With The Supertrend Indicator” in this issue by Barbara Star, is available for download at the following link for NinjaTrader 8:
Once the file is downloaded, you can import the indicator into NinjaTrader 8 from within the control center by selecting Tools → Import → NinjaScript Add-On and then selecting the downloaded file for NinjaTrader 8.
You can review the indicator source code in NinjaTrader 8 by selecting the menu New → NinjaScript Editor → Indicators folder from within the control center window and selecting the file.
A sample chart displaying the supertrend indicator is shown in Figure 7.

FIGURE 7: NINJATRADER. The supertrend indicator is shown on a daily chart of the emini S&P (ES) in recent months.
—NinjaTrader, LLC
www.ninjatrader.com
BACK TO LIST

TradingView: July 2023
Here is TradingView Pine Script code for plotting the supertrend indicator as a single plotline, following the approach demonstrated in the article by Barbara Star in this issue, “Stay On Track With The Supertrend Indicator.” Additionally, our code enhances the visualization by dynamically coloring the supertrend line in green when the price is above it, indicating an uptrend, and in red otherwise.
//  TASC Issue: July 2023 - Vol. 41, Issue 8
//     Article: Stay On Track With
//              The Supertrend Indicator
//  Article By: Barbara Star, PhD
//    Language: TradingView's Pine Script® v5
// Provided By: PineCoders, for tradingview.com


//@version=5
string title  = 'TASC 2023.07 Supertrend Indicator'
string stitle = 'Supertrend'
indicator(title, stitle, true)


float multi  = input.float(3.0, 'Atr Multiplier:')
int   length = input.int(   10, 'Atr Length:')


string cT = 'Colors:'
color cUp = input.color(#ff5252ff, '', '', cT, cT)
color cLo = input.color(#4caf50ff, '', '', cT, cT)


[st, dir] = ta.supertrend(multi, length)


color col = dir > 0 ? cUp : cLo


ps1 = plot.style_stepline
plot(st, 'Supertrend' , col, 3, ps1)
The indicator is available on TradingView from the PineCodersTASC account: https://www.tradingview.com/u/PineCodersTASC/#published-scripts
An example chart is shown in Figure 8.
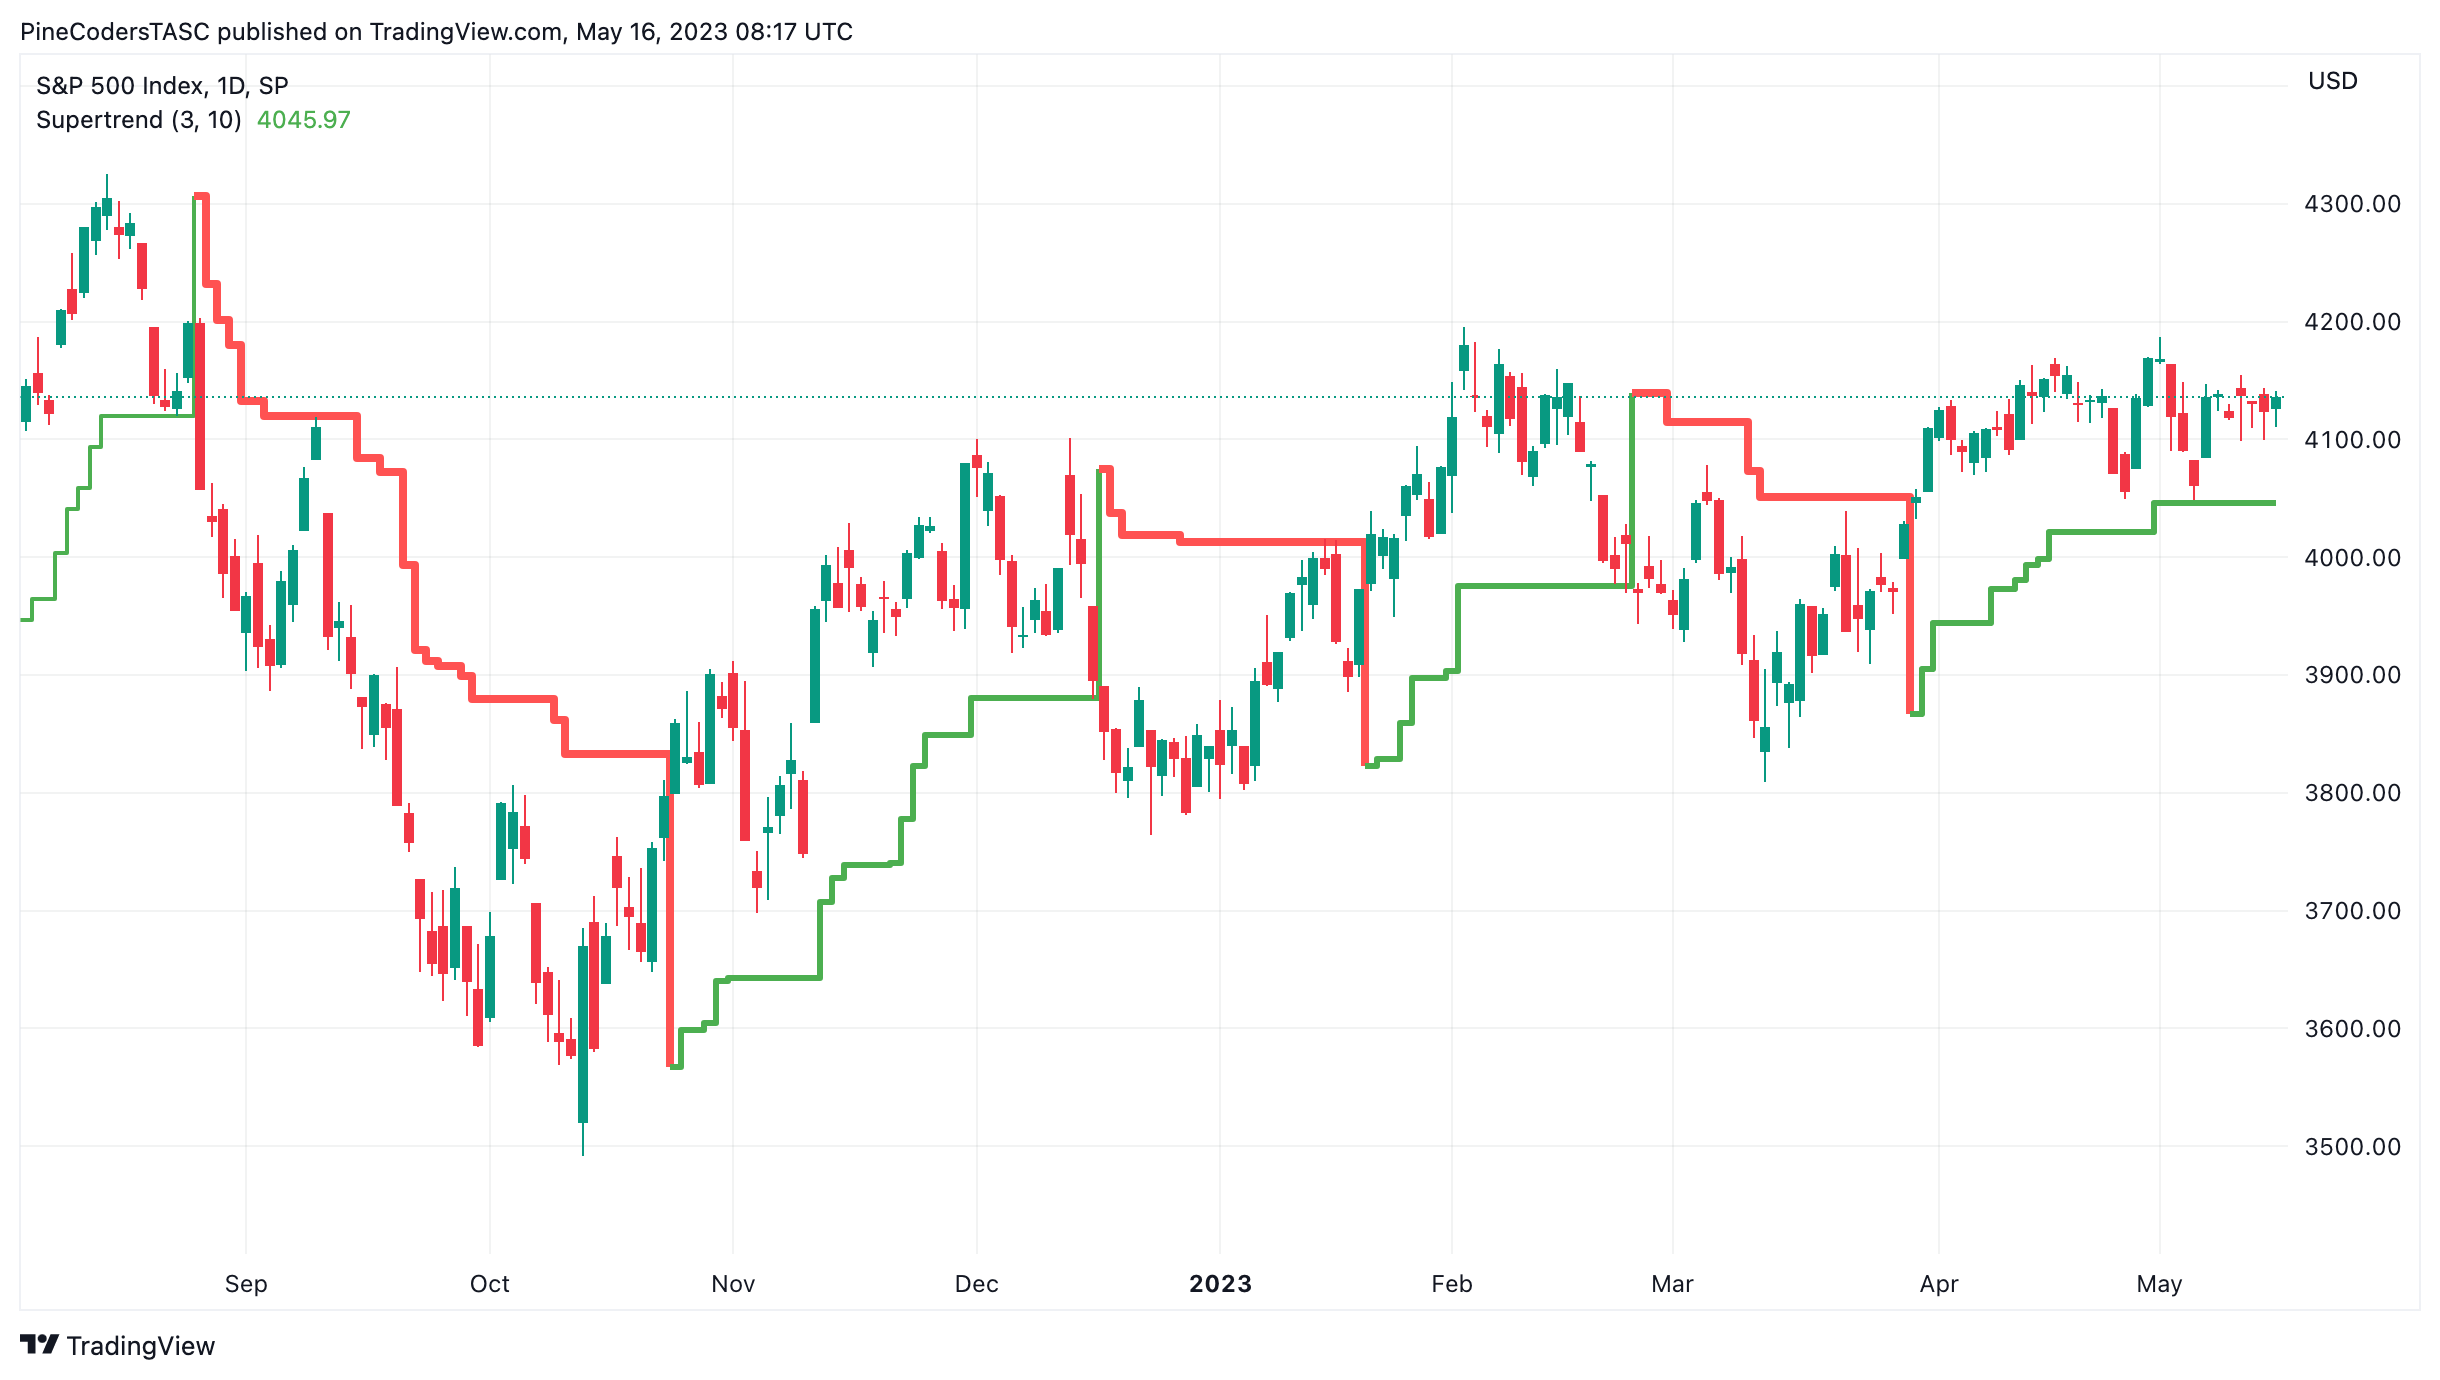
FIGURE 8: TRADINGVIEW. Shown here is an example of the supertrend indicator (3,10) plotted on a daily chart of the S&P 500 index for a portion of 2022 and 2023. The supertrend line is colored in green when price is above it, indicating an uptrend, and colored in red when price is below it.
—PineCoders, for TradingView
www.TradingView.com
BACK TO LIST

Neuroshell Trader: July 2023
A trading system based on the supertrend indicator can be easily implemented in NeuroShell Trader by combining some of NeuroShell Trader’s 800+ indicators. To implement a reversal trading system based on the supertrend indicator, select new strategy from the insert menu and use the trading strategy wizard to create the following strategy:
Long trailing stop prices:
     TrailPriceATR(Trading Strategy,10,3)

Short trailing prices:
     TrailPriceATR(Trading Strategy,10,3)
Users of NeuroShell Trader can go to the Stocks & Commodities section of the NeuroShell Trader free technical support website to download a copy of this or any previous Traders’ Tips.

FIGURE 9: NEUROSHELL TRADER. This demonstrates a reversal trading system based on the supertrend indicator on a chart of Blackrock (BLK).
—Ward Systems Group, Inc.
sales@wardsystems.com
www.neuroshell.com
BACK TO LIST

Optuma: July 2023
The supertrend indicator is a default tool in Optuma and is available for all clients, so there’s no need to code it. The 10/3 default settings can be easily adjusted in the tool’s properties, and signals/tests can be created using the ST() function, for example, CLOSE() CrossesAbove ST() for when the supertrend switches to long.
An example of using the supertrend’s signals for ETF trading is shown in Figure 10.
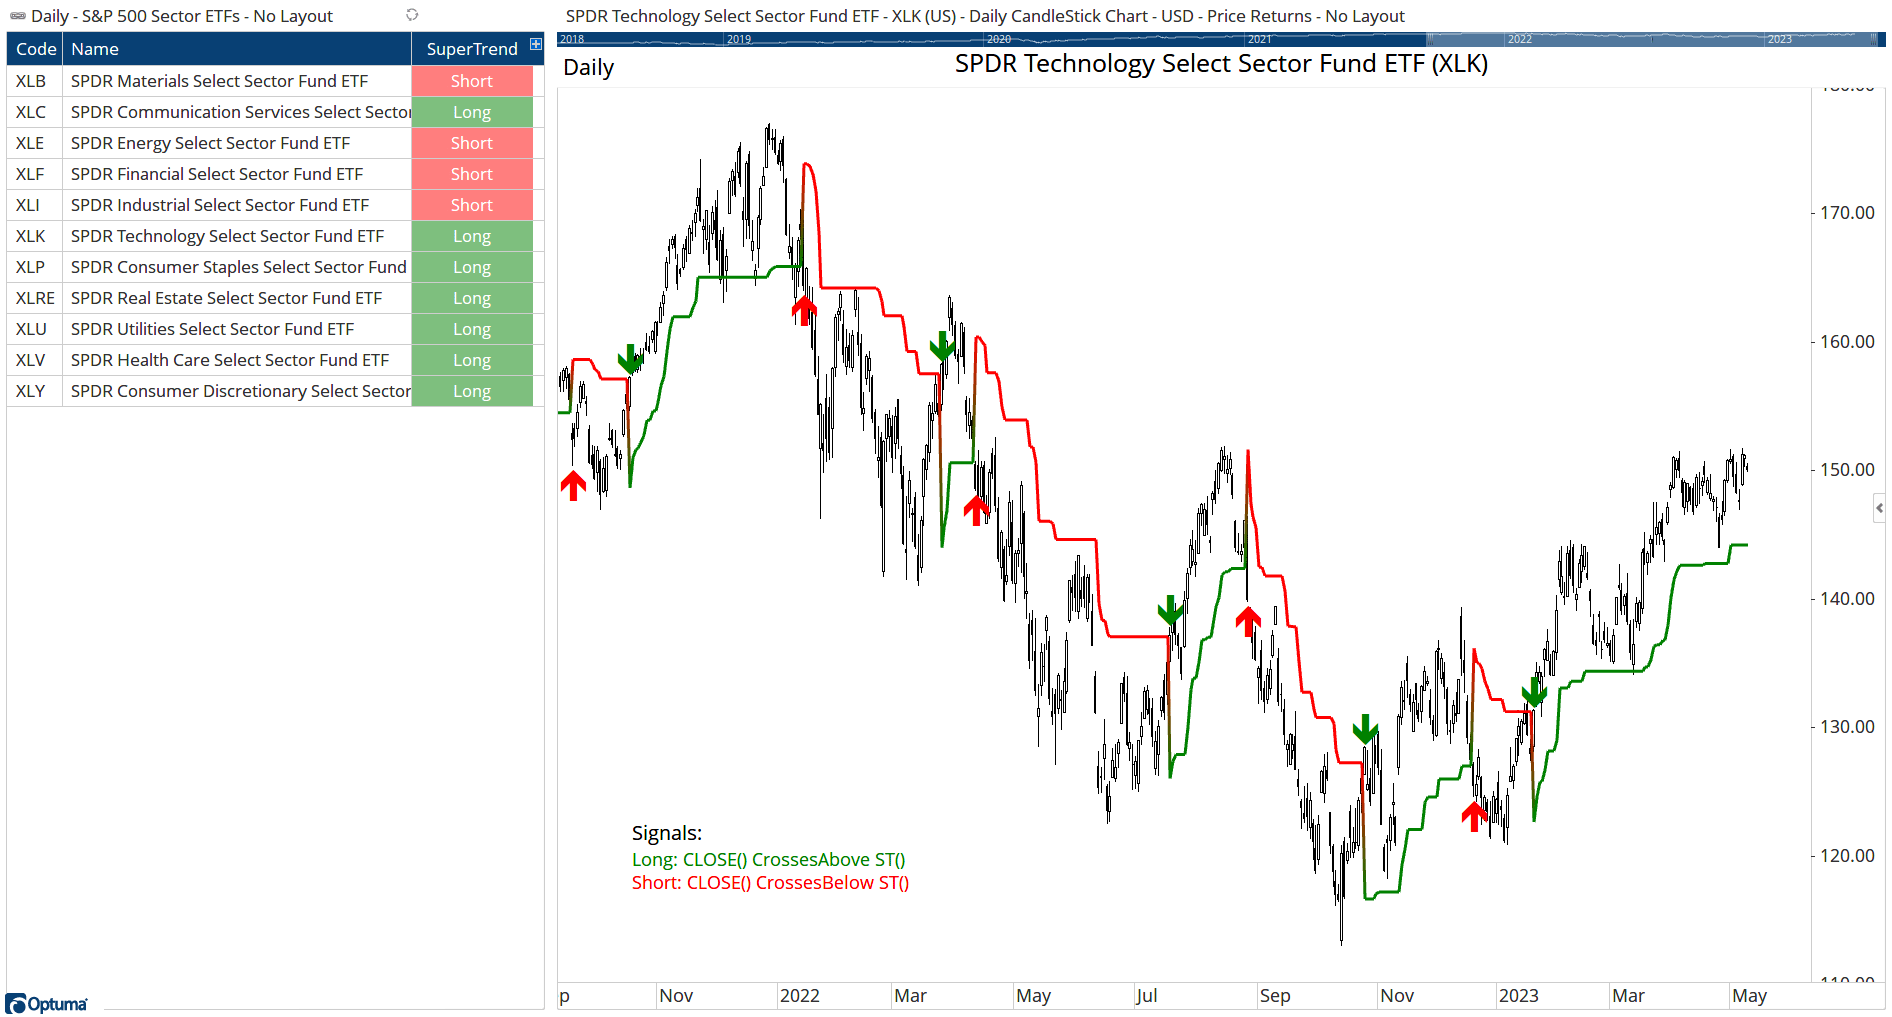
FIGURE 10: OPTUMA. This shows an example of using Optuma’s built-in supertrend indicator to trade sector ETFs.
—support@optuma.com
BACK TO LIST

The Zorro Project: July 2023
In “Stay On Track With The Supertrend Indicator” in this issue, Barbara Star discusses the indicator named the supertrend indicator (STI).
Here is a direct translation of the MetaStock code provided in the article’s sidebar to C:
var STI(int Periods, var Mult)
{
  var Dis = Mult * ATR(Periods);
  var Top = MedPrice() + Dis;
  var Bot = MedPrice() - Dis;
  vars Tops = series(Top,2),
    Bots = series(Bot,2),
    Stis = series(priceC(0),2);
  Tops[0] = ifelse(Top < Tops[1] || priceC(1) > Tops[1],Top,Tops[1]);
  Bots[0] = ifelse(Bot > Bots[1] || priceC(1) < Bots[1],Bot,Bots[1]);
  return Stis[0] = ifelse(Stis[1] == Tops[1],
    ifelse(priceC(0) <= Tops[0],Tops[0],Bots[0]),
    ifelse(Stis[1] == Bots[1],
      ifelse(priceC(0) >= Bots[0],
        Bots[0],Tops[0]),Tops[0]));
}
Figure 11 shows the STI(10,3) and STI (10,2) applied on chart of GE, replicating the chart in the article.
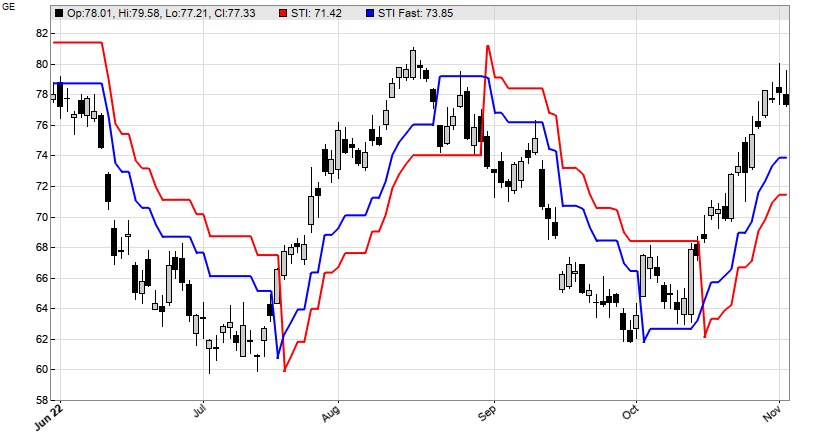
FIGURE 11: ZORRO. This shows the supertrend indicator with parameters STI(10,3) and STI(10,2) applied to a chart of GE.
You can use the following coding if you want to put the supertrend indicator to the test. The coding uses crossings above the indicator to create a simple trading system that enters a long position in an upward trend change, and reverses the position on a downward trend change. The code is in C:
void run()
{
  BarPeriod = 1440;
  StartDate = 2010;
  EndDate = 2023;
  assetAdd("GE","STOOQ:*");
  asset("GE");
  vars Signals1 = series(STI(10,3));
  vars Signals2 = series(STI(10,2));
  if(crossOver(Signals2,Signals1))
    enterLong();
  if(crossUnder(Signals2,Signals1))
    enterShort();
}
The resulting equity curve for this simple trading system is shown in Figure 12. We can see that the supertrend indicator detects trend changes quite well in 2010 through 2014 but quite poorly in 2014 through 2016. However, this example trading system is only the simplest possible approach to using the indicator in a trading system. Walk-forward optimization and some filtering could likely improve it. We leave that to the reader to experiment with.
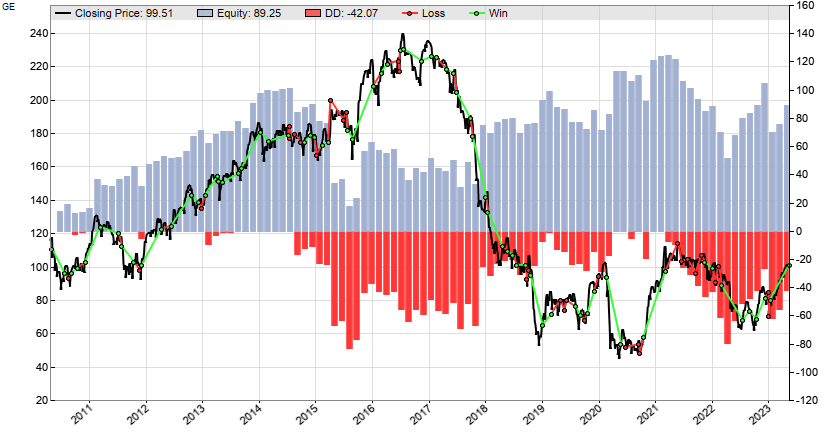
FIGURE 12: ZORRO. Shown here is an equity curve for a very simple trading system based on the supertrend indicator.
The supertrend indicator and the example simple trading system can be downloaded from the 2023 script repository on https://financial-hacker.com. The Zorro platform for C/C++ algo trading can be downloaded from https://zorro-project.com.
—Petra Volkova
The Zorro Project by oP group Germany
https://zorro-project.com
BACK TO LIST

Trade Navigator: July 2023
The supertrend indicator, which is discussed in the article “Stay On Track With The Supertrend Indicator” in this issue by Barbara Star, is already an existing indicator in Trade Navigator.
To add the indicator to a chart in Trade Navigator, open the charting dropdown menu and select the add to chart command. On the indicators tab, scroll down to find the supertrend indicator, click to select, then click add. This will plot the indicator in its own pane under the price chart. Repeat to add a second supertrend indicator. You can then click on the indicator name in the lower pane and drag it into the price pane.
Once you have them in the price pane, open the chart settings window by hitting the “E” key on your keyboard. Click on the indicator name in pane 1: price. Adjust the settings for the indicator on the right-hand side of the window.
If you need assistance, our friendly technical support staff will be happy to help via phone or via live chat through our website.
FIGURE 13: TRADE NAVIGATOR. This shows an example of the supertrend indicator on a daily chart of GE.
—Genesis Financial Data
Tech support 719 884-0245
www.TradeNavigator.com
BACK TO LIST
Microsoft Excel: July 2023
In “Stay On Track With The Supertrend Indicator” in this issue, Barbara Star discusses a trend-following indicator to overlay on a price chart. She notes that the supertrend indicator (STI) behaves somewhat like a chandelier stop-loss in that it tracks upward trends from below and downward trends from above (see Figure 14).

FIGURE 14: EXCEL. The supertrend indicator shifts to uptrend when the close exceeds the previous bar supertrend indicator value and shifts to downtrend when the close falls below the previous bar supertrend indicator value.
Two simple user specifications allow us to dial in the sensitivity of this indicator to changes in trend. Having played with this indicator a bit in testing, I will say that the user-defined ATR lookback period is a contributor.
However, small changes to the user-specified ATR multiplier make far more significant differences in the sensitivity of the indicator. This ATR multiplier is where you will have the most control over what you are willing to allow as price “breathing room” before the indicator signals a trend change (Figure 15).

FIGURE 15: EXCEL. The second superrtrend indicator (dots) uses an ATR multiplier of 4 and generally sits farther away from the price bars. Price has to exhibit a larger up or down excursion to intercept the indicator and signal a trend change.
The calculations to derive the STI, as demonstrated in the article’s sidebar code, are quite simple. So I thought it might be interesting to graphically work through the layers of this calculation.
The basis of the supertrend calculation is the ATR (average true range). As shown in Figure 16, an ATR with a shorter lookback shows wider, sharper swings. But those sharper swings align well with the high and low points of a longer, smoother ATR.

FIGURE 16: EXCEL. ATR(10) has sharper swings than ATR(30) but the peaks and valleys tend to align. And the resulting STI plots are nearly identical.
The next step is building upper and lower bands (bTop and bBot in the article sidebar’s code) around the median price of each bar by adding or subtracting a “distance” calculated as a user-specified multiple of the ATR at that bar. While not easy to see in Figure 17, the width of the basic bands varies with the value of the ATR at each price bar.

FIGURE 17: EXCEL. Basic bands located the same ATR-x-multiplier distance above and below the median price of each bar.
Next, we need to derive some tighter limits to help us see when a price excursion should be called a trend turning point.
In Figure 18, the upper green band is derived from the upper basic band using the following rules:
- If the close price is above the previous bar’s value of the upper green band, then step the green band all the way up to the value of the upper basic band (a sudden jump up).
- If the upper basic band falls below the previous bar value of the green band, then step the green band value down to the upper basic band value (the green tracking basic band).
- Otherwise, hold the upper green bar value (the horizontal upper green segment).

FIGURE 18: EXCEL. This shows the supertrend bands as derived from the basic distance bands.
The lower green band inverts these rules by using a close price below the lower green band to move to the lower basic band value and subsequently track the lower basic band as it rises.
In Figure 19 we see that the supertrend indicator pictured in Figure 14 is actually an overlay of appropriately chosen segments of the upper and lower green supertrend bands.

FIGURE 19: EXCEL. The supertrend indicator tracks the upper or lower supertrend band per trend reversal determination.
The beginning of an uptrend is signaled when the current bar close is greater than the previous bar value of the upper supertrend band. Here we begin tracking the lower supertrend band.
The beginning of a downtrend occurs when the close of the current bar is lower than the previous bar value of the lower supertrend band. In the downtrend, we track the upper band.
In closing: The user controls area on the left and the charting selection checkboxes on the right will allow you to put up to two different supertrend indicators along with your choices of their pieces and parts on the price chart at the same time.
Pick your favorite symbol and play a bit with longer and shorter ATRs and with full and fractional ATR multipliers above and below 3.
To download this spreadsheet: The spreadsheet file for this Traders’ Tip can be downloaded here. To successfully download it, follow these steps:
- Right-click on the Excel file link, then
- Select “save as” (or “save target as”) to place a copy of the spreadsheet file on your hard drive.
—Ron McAllister
Excel and VBA programmer
rpmac_xltt@sprynet.com
BACK TO LIST

AIQ: July 2023
The importable AIQ EDS file based on Barbara Star’s article in this issue, “Stay On Track With The Supertrend Indicator,” can be obtained on request via email to info@TradersEdgeSystems.com.
Code for the author’s indicator is set up in the AIQ EDS code file. The code is also shown below. Figure 20 shows a chart of the NASDAQ 100 index (NDX) with the supertrend indicator overlayed.

FIGURE 20: AIQ. This shows an example of the supertrend indicator on a daily chart of the NASDAQ 100 index (NDX).
! THE SUPERTREND INDICATOR
! Author: Barbara Star, TASC July 2023
! Coded by: Richard Denning, 5/18/2023

!INPUTS:
a1 is 2*10-1. !Convert exponential avg to Wilder avg
a2 is 3.

!AVERAGE TRUE RANGE CODE:
Dailyrange is [high]-[low].
YcloseL is abs(val([close],1)-[low]).
YcloseH is abs(val([close],1)-[high]).
Trange is Max(Dailyrange,Max(YcloseL,YcloseH)).
ATR is ExpAvg(Trange,a1).

!INDICATOR CODE:
dis is a2 * ATR.
mp is ([high] + [low]) / 2.
bTop is mp + dis.
bBot is mp - dis.

!CODE TO PLOT BANDS:
daysInto is ReportDate() - RuleDate().
stop if daysInto > 30.
stopTop is iff(stop,[close], Top).
Top is iff( bTop < valresult(stopTop,1)
   or val([close],1) > valresult(stopTop,1), bTop,
   valresult(stopTop,1) ).
stopBot is iff(stop,[close], Bot).
Bot is iff( bBot > valresult(stopBot,1)
   or val([close],1) < valresult(stopBot,1), bBot,
   valresult(stopBot,1) ).

BreakUP if  [close] >= Top and valrule([close]<Top,1).
BreakDN if [close] <= Bot and valrule([close]>Bot,1).
stopSti is iff(stop,[close], sti).
OSD is offsettodate(month(),day(),year()).
barsBup is scanany(BreakUP,100) then OSD.
barsBdn is scanany(BreakDN,100) then OSD.

STI is iff(^barsBup < ^barsBdn,Bot,Top).
—Richard Denning
rdencpa@gmail.com
for AIQ Systems
BACK TO LIST
Originally published in the July 2023 issue of
Technical Analysis of STOCKS & COMMODITIES magazine.
All rights reserved. © Copyright 2023, Technical Analysis, Inc.


