TRADERS’ TIPS
August 2023
For this month’s Traders’ Tips, the focus is Stella Osoba’s article in the 2023 Bonus issue, “Using Price Channels.” Here, we present the August 2023 Traders’ Tips code with possible implementations in various software.
You can right-click on any chart to open it in a new tab or window and view it at it’s originally supplied size, often much larger than the version printed in the magazine.
The Traders’ Tips section is provided to help the reader implement a selected technique from an article in this issue or another recent issue. The entries here are contributed by software developers or programmers for software that is capable of customization.

TradeStation: August 2023
In her article “Using Price Channels” in the 2023 Bonus Issue, author Stella Osoba describes why many analysis techniques are based on the concept of price channels. In her explanation of Donchian channels, she explains that they are used to help you see the trend and that prices for the most recent period are not used in the calculations.
The EasyLanguage version presented here allows the user to optionally include the most recent period. To not include the most recent period, set the IncludeRecentPeriod input to false.
// TASC AUGUST 2023
// Using Price Channels
// Indicator: Richard Donchian
// Article Author: Stella Osoba

inputs:
	Length( 20 ),
	IncludeRecentPeriod( true ),
	IncludeMiddleLine( true );

variables:
	UpperBand( 0 ),
	LowerBand( 0 ),
	MiddleLine( 0 ),
	Displace( IFF( IncludeRecentPeriod, 0, 1 ) );

UpperBand = Highest(High, Length)[Displace];
LowerBand = Lowest(Low, Length)[Displace];
MiddleLine = (UpperBand + LowerBand) * 0.5;

Plot1[Displace](UpperBand, "Donchian High");
Plot2[Displace](LowerBand, "Donchian Low");
if IncludeMiddleLine then
	Plot3[Displace](MiddleLine, "Donchian Avg");
A sample chart is shown in Figure 1.

FIGURE 1: TRADESTATION. Here is a daily chart of the S&P 500 ETF SPY showing a portion of 2022 and 2023 with Donchian channels.
This article is for informational purposes. No type of trading or investment recommendation, advice, or strategy is being made, given, or in any manner provided by TradeStation Securities or its affiliates.
—John Robinson
TradeStation Securities, Inc.
www.TradeStation.com
BACK TO LIST
MetaQuotes: August 2023
The code provided here can be used as a regular Donchian channel or you can use the change in slope of the middle line to determine the direction of the trend.
The indicator includes buy/sell arrows and a color-changing middle line to indicate the change in trend. Arrows can be turned off or on; the default setting is on. See Figure 2.
//+------------------------------------------------------------------+
//|                                            Donchian Channels.mq5 |
//|                             Copyright © August 2023, Shaun Bosch |
//|                                              shadavbos@gmail.com |
//+------------------------------------------------------------------+
#property copyright "Copyright © August 2023, Shaun Bosch"
#property link      "shadavbos@gmail.com"
#property version   "1.00"
#property indicator_chart_window
#property indicator_buffers 6
#property indicator_plots   5
//--- plot Upper Band
#property indicator_label1  "Upper Band"
#property indicator_type1   DRAW_LINE
#property indicator_color1  clrYellow
#property indicator_style1  STYLE_SOLID
#property indicator_width1  1
//--- plot Middle Line
#property indicator_label2  "Middle Line"
#property indicator_type2   DRAW_COLOR_LINE
#property indicator_color2  clrGreen,clrRed
#property indicator_style2  STYLE_SOLID
#property indicator_width2  2
//--- plot Lower Band
#property indicator_label3  "Lower Band"
#property indicator_type3   DRAW_LINE
#property indicator_color3  clrYellow
#property indicator_style3  STYLE_SOLID
#property indicator_width3  1
//--- plot Buy Signal
#property indicator_label4  "Buy Signal"
#property indicator_type4   DRAW_ARROW
#property indicator_color4  clrDodgerBlue
#property indicator_style4  STYLE_SOLID
#property indicator_width4  1
//--- plot Sell Signal
#property indicator_label5  "Sell Signal"
#property indicator_type5   DRAW_ARROW
#property indicator_color5  clrMagenta
#property indicator_style5  STYLE_SOLID
#property indicator_width5  1
//--- input parameters
input int               inp_period           = 20;          // Lookback Period (min val: 1; step val: 1)
input bool              inp_show_arrw        = true;        // Show Arrows?
//--- indicator buffers
double                  upper_channel[];
double                  mid_line[];
double                  mid_line_col[];
double                  lower_channel[];
double                  buy_signal[];
double                  sell_signal[];

//--- indicator variables
int                     period;
//+------------------------------------------------------------------+
//| Custom indicator initialization function                         |
//+------------------------------------------------------------------+
int OnInit()
  {
//--- check input parameters
   period = inp_period < 1 ? 1 : inp_period;
//--- indicator buffers mapping
   SetIndexBuffer(0, upper_channel, INDICATOR_DATA);
   SetIndexBuffer(1, mid_line, INDICATOR_DATA);
   SetIndexBuffer(2, mid_line_col, INDICATOR_COLOR_INDEX);
   SetIndexBuffer(3, lower_channel, INDICATOR_DATA);
   SetIndexBuffer(4, buy_signal, INDICATOR_DATA);
   SetIndexBuffer(5, sell_signal, INDICATOR_DATA);
//--- setting a code from the Wingdings charset as the property of PLOT_ARROW
   PlotIndexSetInteger(3, PLOT_ARROW, 225);
   PlotIndexSetInteger(4, PLOT_ARROW, 226);
//--- Set the vertical shift of arrows in pixels
   PlotIndexSetInteger(3, PLOT_ARROW_SHIFT, 15);
   PlotIndexSetInteger(4, PLOT_ARROW_SHIFT, -15);
//--- accuracy of drawing of indicator values
   IndicatorSetInteger(INDICATOR_DIGITS, _Digits);
//--- set indicator name display
   string short_name = "DONCHIAN CHANNELS (" + IntegerToString(period) + ")";
   IndicatorSetString(INDICATOR_SHORTNAME, short_name);
//--- show indicator name on screen
   Comment(short_name);
//--- an empty value for plotting, for which there is no drawing
   PlotIndexSetDouble(0, PLOT_EMPTY_VALUE, EMPTY_VALUE);
   PlotIndexSetDouble(1, PLOT_EMPTY_VALUE, EMPTY_VALUE);
   PlotIndexSetDouble(2, PLOT_EMPTY_VALUE, EMPTY_VALUE);
   PlotIndexSetDouble(3, PLOT_EMPTY_VALUE, EMPTY_VALUE);
   PlotIndexSetDouble(4, PLOT_EMPTY_VALUE, EMPTY_VALUE);
//--- display candlestick / bar / line chart above all indicators
   ChartSetInteger(0, CHART_BRING_TO_TOP, 0, true);
//--- successful initialization
   return(INIT_SUCCEEDED);
  }
//+------------------------------------------------------------------+
//| Custom indicator deinitialization function                       |
//+------------------------------------------------------------------+
void OnDeinit(const int reason)
  {
   Comment(""); // clear the chart from comments after deleting the indicator
  }
//+------------------------------------------------------------------+
//| Custom indicator iteration function                              |
//+------------------------------------------------------------------+
int OnCalculate(const int rates_total,
                const int prev_calculated,
                const datetime &time[],
                const double &open[],
                const double &high[],
                const double &low[],
                const double &close[],
                const long &tick_volume[],
                const long &volume[],
                const int &spread[])
  {
//--- populate donchian channel buffers
   on_DONCHIAN_CHANNELS(rates_total, prev_calculated, period, high, low, upper_channel, lower_channel, mid_line);
//--- bar index start
   int bar_index;
   if(prev_calculated == 0)
      bar_index = 0;
   else
      bar_index = prev_calculated - 1;
//--- main loop
   for(int i = bar_index; i < rates_total && !_StopFlag; i++)
     {
      if(i < period)
        {
         mid_line_col[i] = EMPTY_VALUE;
         buy_signal[i] = EMPTY_VALUE;
         sell_signal[i] = EMPTY_VALUE;
        }
      else
        {
         mid_line_col[i] = mid_line[i] - mid_line[i - 1] > 0.0 ? 0.0 : mid_line[i] - mid_line[i - 1] < 0.0 ? 1.0 : mid_line_col[i - 1];
         buy_signal[i] = inp_show_arrw == false ? EMPTY_VALUE : (mid_line_col[i] == 0.0 && mid_line_col[i - 1] == 1.0 ? lower_channel[i] : EMPTY_VALUE);
         sell_signal[i] = inp_show_arrw == false ? EMPTY_VALUE : (mid_line_col[i] == 1.0 && mid_line_col[i - 1] == 0.0 ? upper_channel[i] : EMPTY_VALUE);
        }
     }
//--- return value of prev_calculated for next call
   return(rates_total);
  }
//+------------------------------------------------------------------+
//| Donchian Channels                                                |
//+------------------------------------------------------------------+
//--- by Richard Donchian
//                       //--- System bar_index references:
int on_DONCHIAN_CHANNELS(const int rates_total,
                         const int prev_calculated,
                         //--- Input variables and arrays:
                         const int length, // DC Period (min val: 1; step val: 1; default val: 20)
                         const double &high[], // High Price
                         const double &low[], // Low Price
                         //--- Output arrays:
                         double &result_upper[],
                         double &result_lower[],
                         double &result_mid[])
  {
//--- bar index start
   int bar_index;
   if(prev_calculated == 0)
      bar_index = 0;
   else
      bar_index = prev_calculated - 1;
//--- main loop
   for(int i = bar_index; i < rates_total && !_StopFlag; i++)
     {
      if(i < length)
        {
         result_upper[i] = EMPTY_VALUE;
         result_lower[i] = EMPTY_VALUE;
         result_mid[i] = EMPTY_VALUE;
        }
      else
        {
         result_upper[i] = high[i];
         result_lower[i] = low[i];
         for(int j = 0; j < length; j++)
           {
            result_upper[i] = high[i - j] > result_upper[i] ? high[i - j] : result_upper[i];
            result_lower[i] = low[i - j] < result_lower[i] ? low[i - j] : result_lower[i];
           }
         result_mid[i] = (result_upper[i] + result_lower[i]) / 2.0;
        }
     }
   return(rates_total);
  }
//+------------------------------------------------------------------+
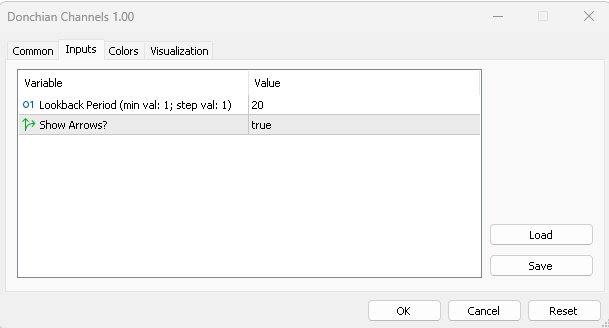
FIGURE 2: METAQUOTES. This shows setting up a 20-day Donchian channel in MetaQuotes.
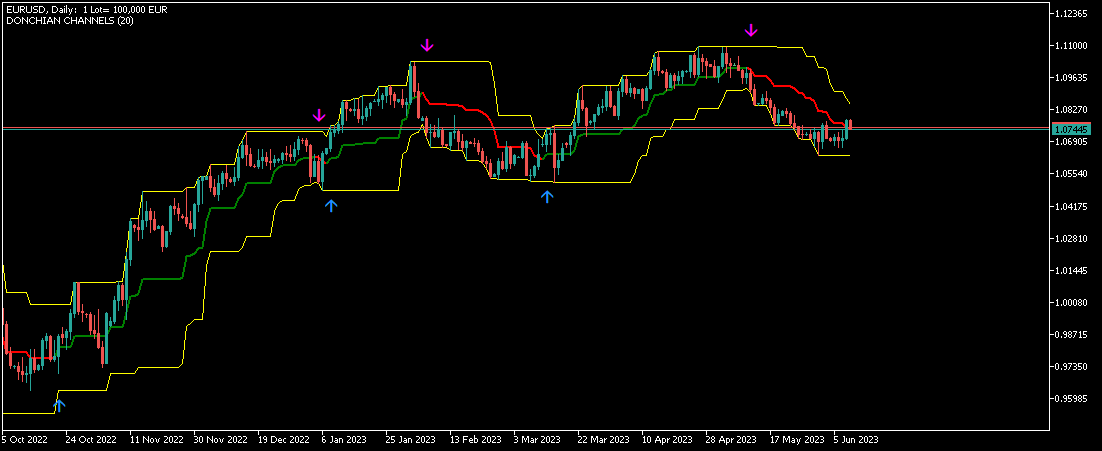
FIGURE 3: METAQUOTES. This demonstrates Donchian price channels on a dail chart of EURUSD from October 2022 through early June 2023.
—Shaun Bosch
shadavbos@gmail.com
BACK TO LIST

MetaStock: August 2023
Stella Osoba’s article “Using Price Channels” explains Donchian channels and offers a system to trade them. The MetaStock platform includes Donchian channels in its list of built-in indicators but uses a different formula for the center band. Provided here are MetaStock formulas for the version described by Osoba. Also included are the suggested entry signals and middle band exit formulas.
Indicator:
x:= Input("periods",2,100,20);
Ref(HHV(H,x), -1);
Ref(LLV(L,x), -1);
Ref(HHV(H,x)+LLV(L,x), -1)/2

Buy Signal:
x:= 20;
Cross( H, Ref(HHV(H,x), -1) )

Sell Signal:
x:= 20;
Cross( Ref(HHV(H,x)+LLV(L,x), -1)/2, L)

Sell Short Signal:
x:= 20;
Cross( Ref(LLV(L,x), -1), L )

Buy to Cover Signal:
x:= 20;
Cross( H, Ref(HHV(H,x)+LLV(L,x), -1)/2 )
—William Golson
MetaStock Technical Support
www.MetaStock.com
BACK TO LIST

Wealth-lab.com: August 2023
Wealth-Lab is all set when it comes to trading price channels. Without any programming to do, creating a Donchian channel trading system is a matter of dropping a pair of “buy(short) at limit or stop” and “sell(cover) at limit or stop” building blocks onto a design surface. (See Figure 4.)
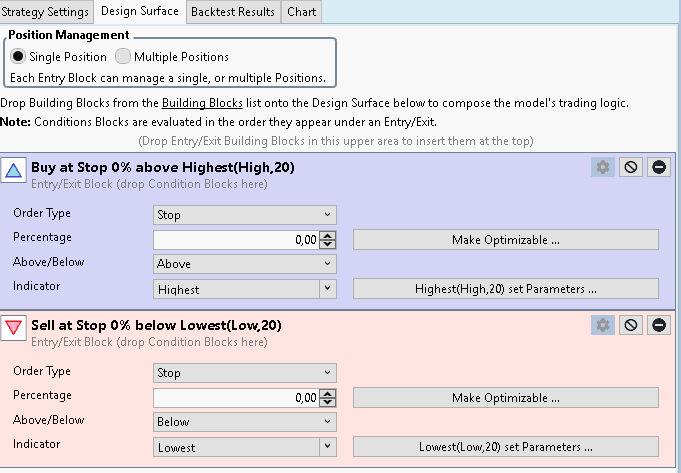
FIGURE 4: WEALTH-LAB. Here is an example of setting up a Donchian channel system using the building blocks feature in Wealth-Lab, without requiring the user to create any coding.
When you’re ready to add a twist, open the “Dual Donchian Breakout” system straight in Wealth-Lab. A dual Donchian band strategy uses the longer band to determine trend direction and the shorter one for trade decisions. For example, it buys after a breakout of the 120-day highest high, and thereafter only takes buys when the market breaks the 20-day high. See Figure 5 for an example implementation of the dual Donchian breakout system.
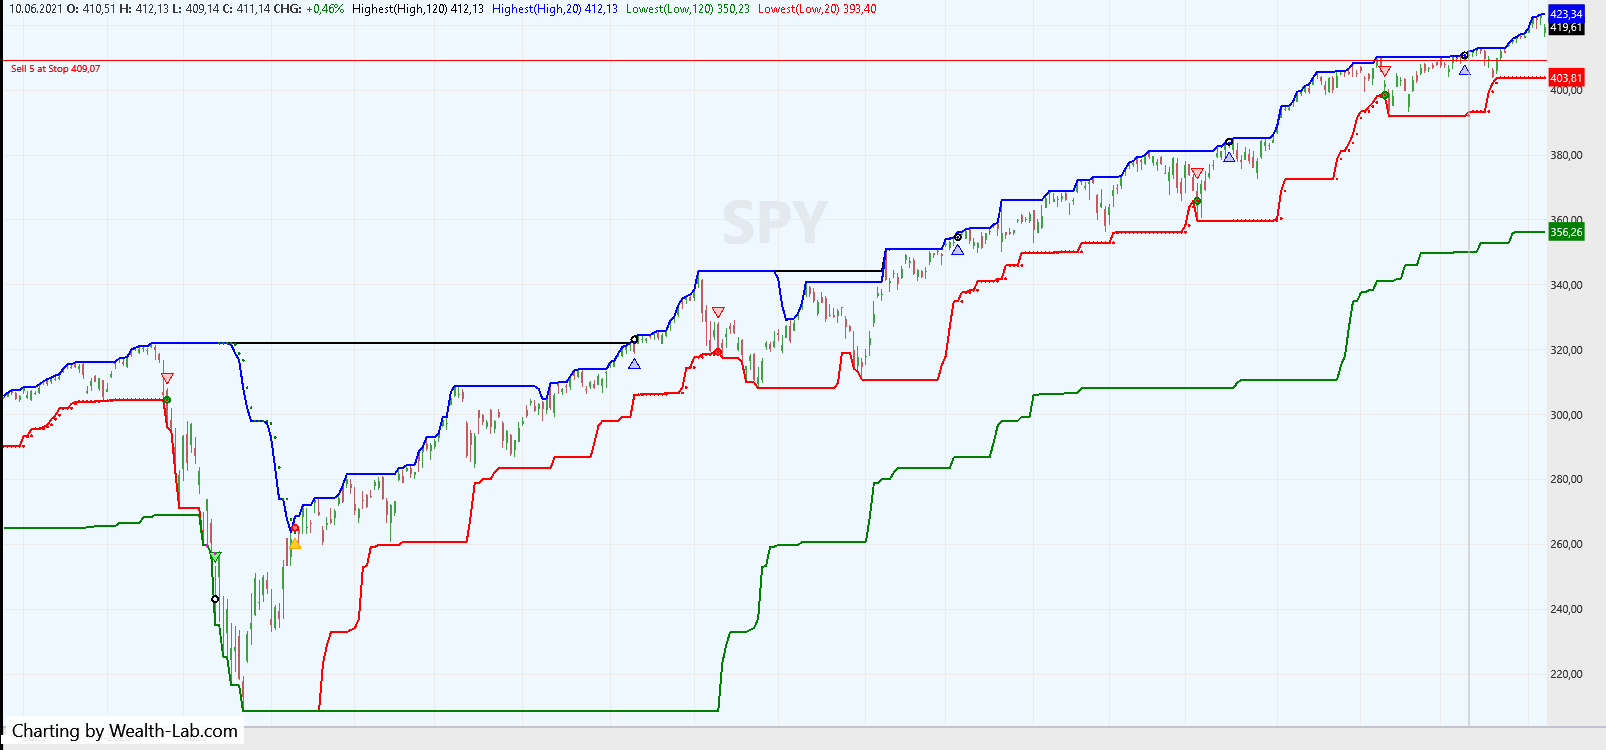
FIGURE 5: WEALTH-LAB. This shows an implementation of the example Donchian channel system from Figure 4 on a chart. A long trade in SPY is entered by the dual channel system only after the downtrend has finally reversed its course with a new 120-day high.
—Gene Geren (Eugene)
Wealth-Lab team
www.wealth-lab.com
BACK TO LIST

TradingView: August 2023
Here is TradingView Pine Script code demonstrating an approach to using Donchian channels, as discussed in Stella Osoba’s articles “Using Price Channels” and “The Savvy Technician: Markets And News.”
//  TASC Issue: August 2023 - Vol. 41, Issue 9
//     Article: Channeling Your Inner Chartist
//              Using Price Channels
//  Article By: Stella Osoba, CMT
//    Language: TradingView's Pine Script™ v5
// Provided By: PineCoders, for tradingview.com


//@version=5
string title = 'TASC 2023.08 Donchian Channel'
string stitle = 'DC'
indicator(title, stitle, true)


//#region   Inputs:
float srcH = input.source(high, 'High Source:')
float srcL = input.source(low, 'Low Source:')
int length = input.int(50, 'Length:')
string cT = 'Colors:'
color cUp = input.color(#ff5252ff, '', '', cT, cT)
color cLo = input.color(#4caf50ff, '', '', cT, cT)
color cMi = input.color(#8b8b8bff, '', '', cT, cT)
//#endregion


//#region   Calculations:
// Calculate the Donchian channel.
float upper  = ta.highest(srcH, length)
float lower  = ta.lowest(srcL, length)
float middle = math.avg(upper, lower)
//#endregion


//#region   Output:
ps1 = plot.style_circles
ps2 = plot.style_line
plot(middle, 'Middle', cMi, 1, ps1)
plot(upper , 'Upper' , cUp, 1, ps2)
plot(lower , 'Lower' , cLo, 1, ps2)
//#endregion


//#region   Signals:
var bool isUpCycle = false
var bool isLoCycle = false
int dir = 0
// Look for the start of a new cycle.
switch
  not isUpCycle =>
      if high >= upper
          isUpCycle := true
          isLoCycle := false
          dir := 1
  not isLoCycle =>
      if low <= lower
          isUpCycle := false
          isLoCycle := true
          dir := -1
float sigUp = dir > 0 ? upper : na
float sigLo = dir < 0 ? lower : na


sUp = shape.triangleup
sLo = shape.triangledown
loc = location.absolute
plotshape(sigUp, 'Up Signal', sLo,loc,cLo,size=size.small)
plotshape(sigLo, 'Lo Signal', sUp,loc,cUp,size=size.small)
//#endregion
The indicator is available on TradingView from the PineCodersTASC account: https://www.tradingview.com/u/PineCodersTASC/#published-scripts
An example chart is shown in Figure 6.
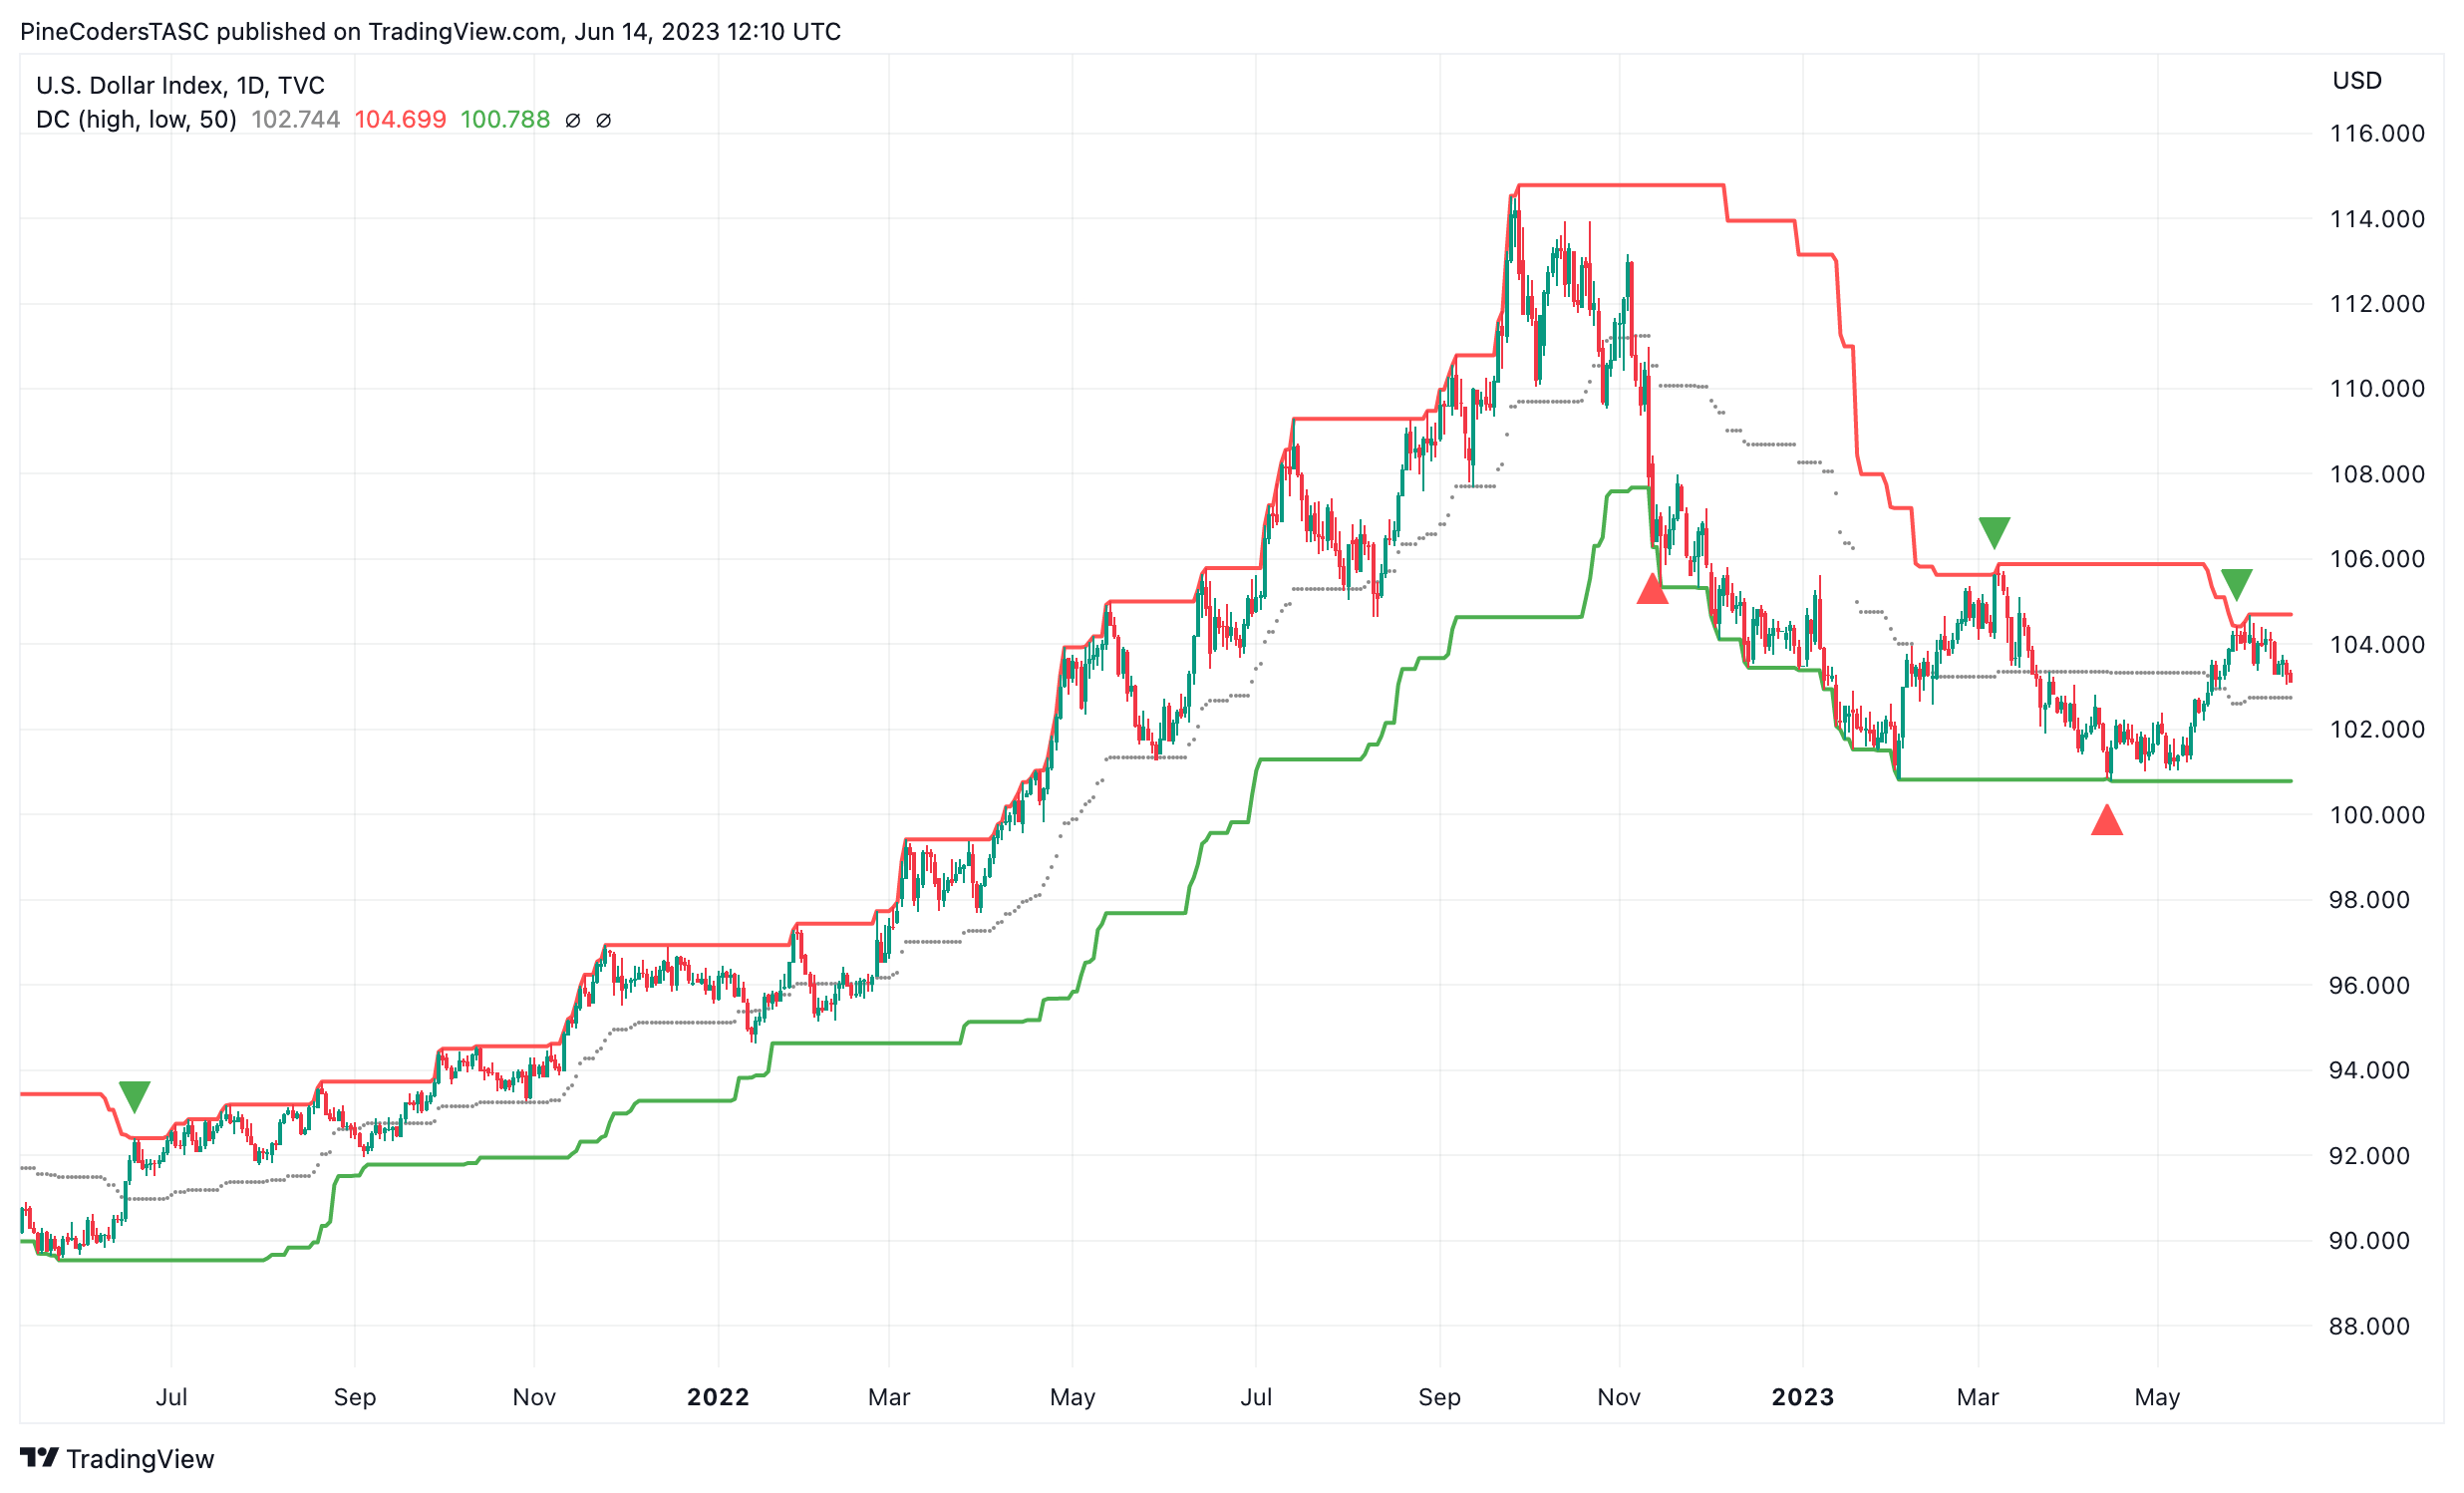
FIGURE 6: TRADINGVIEW. This demonstrates a daily chart of the US Dollar Index with Donchian price channels and buy/sell signals based on the channels.
—PineCoders, for TradingView
www.TradingView.com
BACK TO LIST

Neuroshell Trader: August 2023
Donchian channels can be easily implemented with a few of NeuroShell Trader’s 800+ indicators. Simply select “new indicator” from the insert menu and use the indicator wizard to create the following indicators:
UpperBand:	Lag( PriceHigh( High, 20 ), 1 )
MiddleBand:	PriceMidPoint( High, Low, 20 ), 1 )
LowerBand:	Lag(PriceLow( Low, 20 ), 1 )
To implement a Donchian channel reversal trading system, select “new strategy” from the insert menu and use the trading strategy wizard to create the following strategy:
BUY LONG CONDITIONS:
     CrossAbove(High,Lag(PriceHigh(High,20),1))

SELL SHORT CONDITIONS:
     CrossBelow(Low,Lag(PriceLow(Low,20),1))

FIGURE 7: NEUROSHELL TRADER. This NeuroShell Trader chart demonstrates Donchian bands and a trading system based on Donchian bands.
Users of NeuroShell Trader can go to the Stocks & Commodities section of the NeuroShell Trader free technical support website to download a copy of this or any previous Traders’ Tips.
—Ward Systems Group, Inc.
sales@wardsystems.com
www.neuroshell.com
BACK TO LIST

Optuma: August 2023
Here are a few examples of using a 20-day Donchian price channel, as discussed in Stella Osoba’s article “Using Price Channels” in the 2023 Bonus Issue, and additionally in “Markets And News” in this issue.
The chart of the S&P 500 index in Figure 8 shows the changes in the long/short Donchian channel regime. The index enters a long regime when the upper line of the Donchian channel changes to an upward direction (green arrow), until the lower line moves down, causing a short signal (red arrow). The bars and analysis box are colored accordingly.
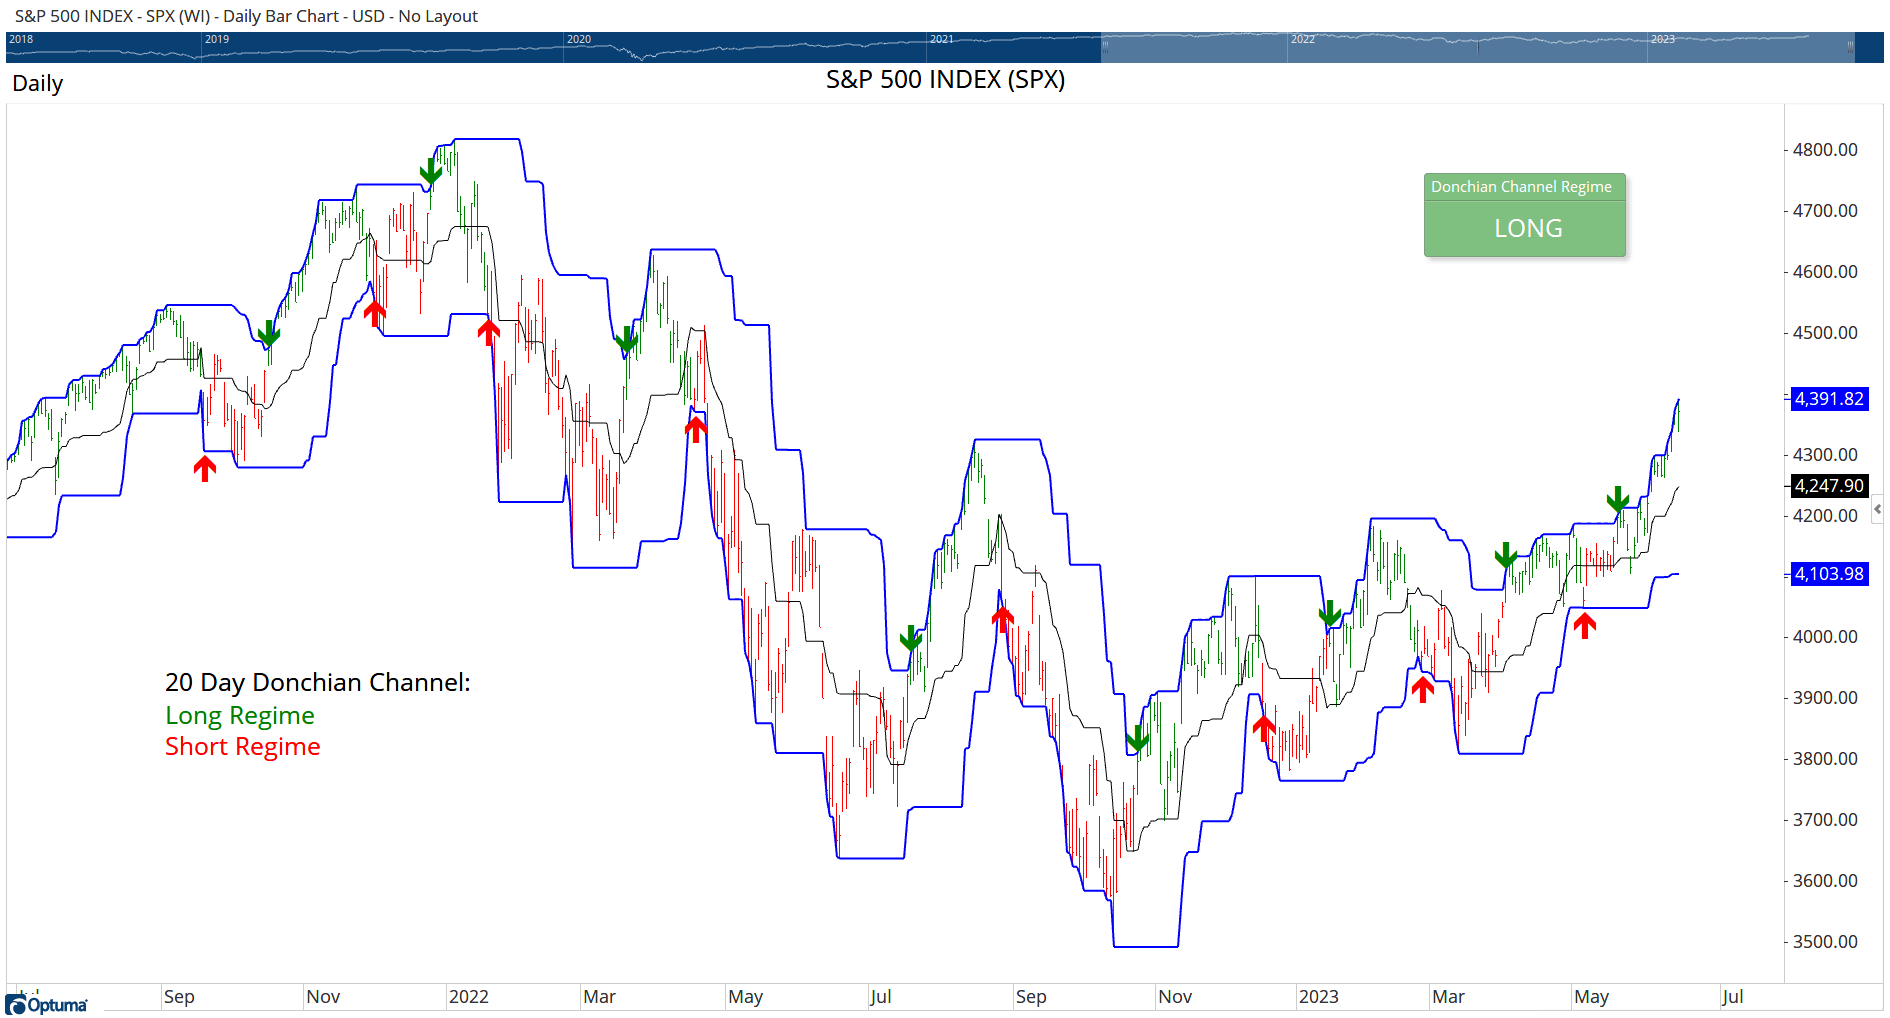
FIGURE 8: OPTUMA. This chart of the S&P 500 index shows the changes in the long/short Donchian channel regime. The index enters a long regime when the upper line of the Donchian channel changes to an upward direction (green arrow) until the lower line moves down, causing a short signal (red arrow). The bars and analysis box are colored accordingly.
This watchlist table (Figure 9) shows the recent Donchian channel regime for the major US indexes and sectors. At time of this writing, the Nasdaq 100 index signaled long on March 17 (62 trading days ago as of this writing) and is trading above the Donchian centerline. On a sector level, only Consumer Staples is trading below the centerline, and has had a short signal since May 18.
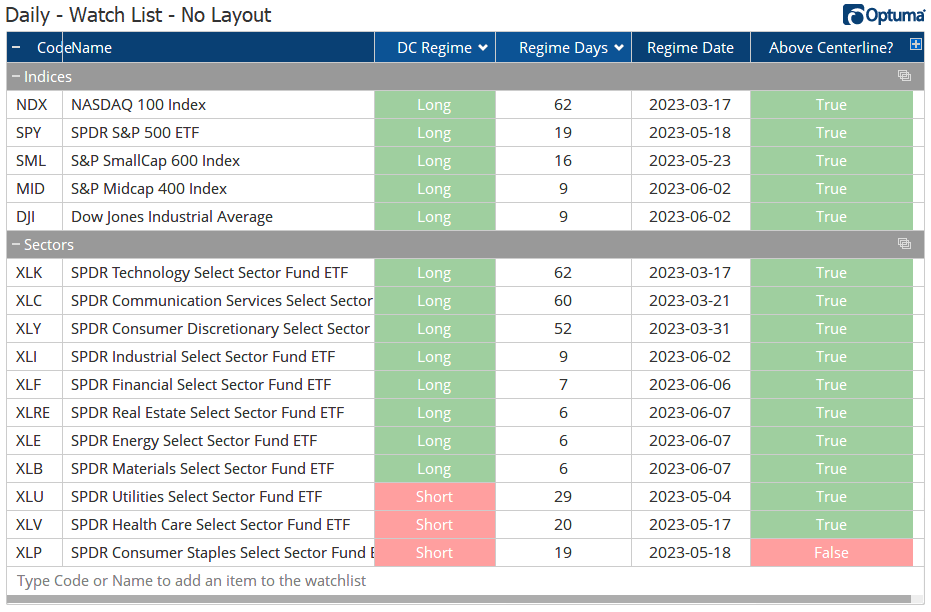
FIGURE 9: OPTUMA. A watchlist shows the Donchian channel regime for major US indexes and sectors. Here, the Nasdaq 100 index signals long on March 17 and is trading above the Donchian centerline. On a sector level, only Consumer Staples is trading below the centerline and saw a short signal on May 18 onward.
Optuma clients can get the formulas and download workbooks from our scripting forum: https://forum.optuma.com/topic/stocks-commodities-magazine-traders-tips.
—support@optuma.com
BACK TO LIST

AIQ: August 2023
The importable AIQ EDS file based on Stella Osoba’s article “Using Price Channels” can be obtained on request via rdencpa@gmail.com. The code is also shown below.
Code for the author’s indicator is set up in the AIQ EDS code file. Figure 10 shows Donchian channels plotted on a chart of Apple, Inc (AAPL).
!Using Price Channels
!Author: Stella Osoba, Aug 2023
!Coded by: Richard Denning, 6/13/23

!INPUT:
Len is 20.

UpDon is hival([high],Len).
DnDon is loval([low],Len).
MdDon is (UpDon - DnDon) / 2 + DnDon.

FIGURE 10: AIQ. This chart demonstrates Donchian price channels plotted on a chart of Apple, Inc. (AAPL).
—Richard Denning
rdencpa@gmail.com
for AIQ Systems
BACK TO LIST
Originally published in the August 2023 issue of
Technical Analysis of STOCKS & COMMODITIES magazine.
All rights reserved. © Copyright 2023, Technical Analysis, Inc.


