TRADERS’ TIPS
September 2023

For this month’s Traders’ Tips, the focus is Andrea Unger’s article in the August 2023 issue, “The Weekly Factor Pattern.” Here, we present the September 2023 Traders’ Tips code with possible implementations in various software.
You can right-click on any chart to open it in a new tab or window and view it at it’s originally supplied size, often much larger than the version printed in the magazine.
The Traders’ Tips section is provided to help the reader implement a selected technique from an article in this issue or another recent issue. The entries here are contributed by software developers or programmers for software that is capable of customization.

TradeStation: September 2023
In the August 2023 article “The Weekly Factor Pattern,” author Andrea Unger discusses trade entry filtering as a means to improve trade selection quality. The weekly factor aims to mark areas in the market where compressed price periods may lead to price expansion, such as a breakout.
Coding for the strategy given here is an adaptation of the strategy given in Unger’s article and is intended to be educational only to allow for further exploration of the ideas discussed in the article.
The RangeFilter input can be optimized as a percentage of the previous five-session range.
Strategy: The Weekly Factor

// TASC SEPTEMBER 2023
// The Weekly Factor
//
// Andrea Unger

inputs:
	RangeFilter( 1 ); // 1 = 100%

variables:
	CS( 0 ),
	BarCount ( 0 ),
	DayCount( 0 ),
	SessionListHigh( 0 ),
	SessionListLow( 0 ),
	WeeklyFactor( false );

CS = CurrentSession( 0 );

SessionListHigh = MaxList( HighSession(0, 1),
 HighSession(0, 2),
 HighSession(0, 3),
 HighSession(0, 4),
 HighSession(0, 5) );

SessionListLow = MinList( LowSession(0, 1),
 LowSession(0, 2),
 LowSession(0, 3),
 LowSession(0, 4),
 LowSession(0, 5) );

WeeklyFactor = AbsValue(OpenSession(0, 5) - CloseSession(0, 1))
 < RangeFilter * (SessionListHigh - SessionListLow);

if CS <> CS[1] then
	BarCount = 1
else
	BarCount += 1;

if WeeklyFactor and BarCount > 1 and BarCount < 91 then
begin
	Buy ("BrkOut_LE") next bar at HighSession(0, 1) stop;
	Sellshort ("BrkOut_SE") next bar at LowSession(0, 1) stop;
end;

SetExitOnClose;
A sample chart is shown in Figure 1.

FIGURE 1: TRADESTATION. Here, a TradeStation 15-minute chart of the crude oil continuous contract showing a portion of 2023 demonstrates the strategy applied with a RangeFilter of 0.8.
This article is for informational purposes. No type of trading or investment recommendation, advice, or strategy is being made, given, or in any manner provided by TradeStation Securities or its affiliates.
—John Robinson
TradeStation Securities, Inc.
www.TradeStation.com
BACK TO LIST
MetaQuotes: September 2023
In the August 2023 issue, Andrea Unger presented “The Weekly Factor Pattern.” I’ve converted the author’s idea into an indicator I call the five-period range filter, for the simple reason that it will only be a weekly factor on the daily timeframe.
The indicator is displayed as a series of gray and gold dots, gray indicating a period of consolidation or, as per the author, a period of indecision, and gold for a period of trending or, as per the author, a period of expansion.
For linking this indicator to an expert advisor (EA), the buffer number to be used is 1. Buffer number 1 gives information about the color of the indicator. A result of 0 indicates the gray (consolidation) and a result of 1 is the gold (trending). Figure 2 shows the input tab when setting up the five-period range filter. Figure 3 shows the common tab.
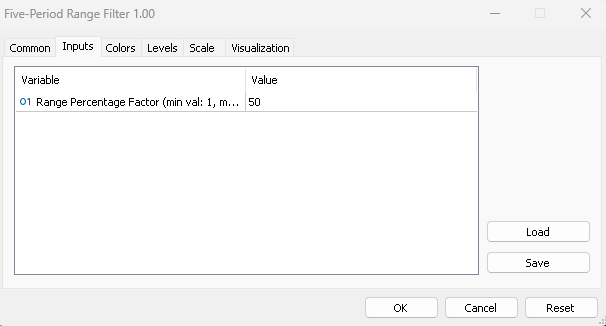
FIGURE 2: METAQUOTES INPUTS TAB
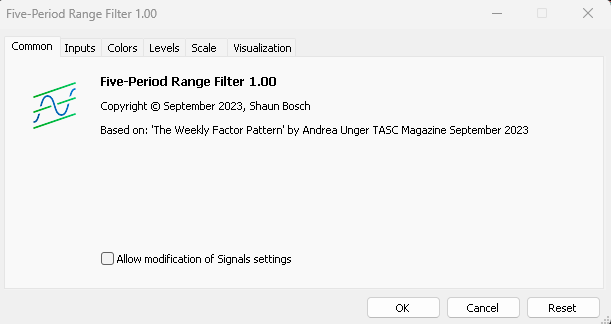
FIGURE 3: METAQUOTES COMMON TAB
This is a nondirectional indicator, hence perfect for a confirmation indicator to your algo.
Figure 4 displays an example of the range filter on a chart of EURUSD.
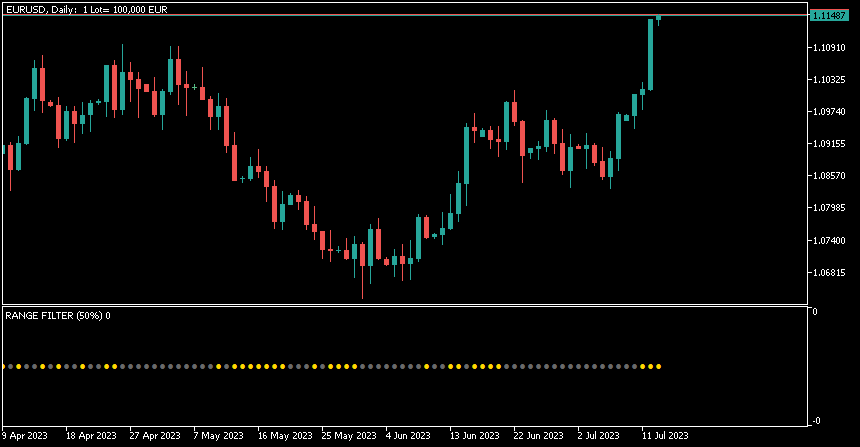
FIGURE 4: METAQUOTES. The five-period range filter is demonstrated here on a daily chart of EURUSD. In the lower pane, gray dots indicate a period of consolidation, and gold dots represent a period of trending.
The “.mq5” file I am providing can be opened in a normal document viewer.
//+------------------------------------------------------------------+
//|                                     Five-Period Range Filter.mq5 |
//|                          Copyright © September 2023, Shaun Bosch |
//|                                              shadavbos@gmail.com |
//+------------------------------------------------------------------+
#property copyright "Copyright © September 2023, Shaun Bosch"
#property link      "shadavbos@gmail.com"
#property version   "1.00"
#property description "Based on: 'The Weekly Factor Pattern' by Andrea Unger TASC Magazine September 2023"
#property indicator_separate_window
#property indicator_buffers 2
#property indicator_plots   1
#property indicator_maximum 0.1
#property indicator_minimum -0.1
//--- plot settings
#property indicator_type1   DRAW_COLOR_ARROW
#property indicator_color1  clrDimGray,clrGold
#property indicator_style1  STYLE_SOLID
#property indicator_width1  1
//--- input parameters
input int      inp_range_filter     = 50;       // Range Percentage Factor (min val: 1, max val: 100)
//--- indicator buffers
double         wf_value[];
double         wf_colors[];
//--- indicator variables
int            range_filter;
//+------------------------------------------------------------------+
//| Custom indicator initialization function                         |
//+------------------------------------------------------------------+
int OnInit()
  {
//--- check input parameters
   range_filter = inp_range_filter < 1 ? 1 : inp_range_filter > 100 ? 100 : inp_range_filter;
//--- indicator buffers mapping
   SetIndexBuffer(0, wf_value, INDICATOR_DATA);
   SetIndexBuffer(1, wf_colors, INDICATOR_COLOR_INDEX);
//--- setting a code from the Wingdings charset as the property of PLOT_ARROW
   PlotIndexSetInteger(0, PLOT_ARROW, 159);
//--- accuracy of drawing of indicator values
   IndicatorSetInteger(INDICATOR_DIGITS, 0);
//--- set indicator name display
   string short_name = "RANGE FILTER (" + IntegerToString(range_filter) + "%" + ")";
   IndicatorSetString(INDICATOR_SHORTNAME, short_name);
//--- an empty value for plotting, for which there is no drawing
   PlotIndexSetDouble(0, PLOT_EMPTY_VALUE, EMPTY_VALUE);
//--- successful initialization
   return(INIT_SUCCEEDED);
  }
//+------------------------------------------------------------------+
//| Custom indicator iteration function                              |
//+------------------------------------------------------------------+
int OnCalculate(const int rates_total,
                const int prev_calculated,
                const datetime &time[],
                const double &open[],
                const double &high[],
                const double &low[],
                const double &close[],
                const long &tick_volume[],
                const long &volume[],
                const int &spread[])
  {
//--- populate weekly factor color buffer
   wi_WF(rates_total, prev_calculated, range_filter, open, high, low, close, wf_colors);
//--- bar index start
   int bar_index;
   if(prev_calculated == 0)
      bar_index = 0;
   else
      bar_index = prev_calculated - 1;
//--- main loop
   for(int i = bar_index; i < rates_total && !_StopFlag; i++)
     {
      if(i < 5)
         wf_value[i] = EMPTY_VALUE;
      else
         wf_value[i] = 0.0;
     }
//--- return value of prev_calculated for next call
   return(rates_total);
  }
//+------------------------------------------------------------------+
//| Five-Period Range Filter / Weekly Factor (WF)                    |
//+------------------------------------------------------------------+
//--- by Andrea Unger TASC Magazine September 2023
//        //--- System bar_index references:
int wi_WF(const int rates_total,
          const int prev_calculated,
          //--- Input variables and arrays:
          const int rng_flt, // Range Percentage Filter (min val: 1, max val: 100, default val: 50)
          const double &open[], // Open Price
          const double &high[], // High Price
          const double &low[], // Low Price
          const double &close[], // Close Price
          //--- Output arrays:
          double &res[])
  {
//--- bar index start
   int bar_index;
   if(prev_calculated == 0)
      bar_index = 0;
   else
      bar_index = prev_calculated - 1;
//--- main loop
   for(int i = bar_index; i < rates_total && !_StopFlag; i++)
     {
      if(i < 5)
         res[i] = EMPTY_VALUE;
      else
         res[i] = fabs(open[i - 5] - close[i - 1]) < (double(rng_flt) / 100.0) * (fmax(high[i - 1], fmax(high[i - 2], fmax(high[i - 3], fmax(high[i - 4], high[i - 5])))) - fmin(low[i - 1], fmin(low[i - 2], fmin(low[i - 3], fmin(low[i - 4], low[i - 5]))))) ? 0.0 : 1.0;
      //--- res[i] = 0.0 is compression / ranging
      //--- res[i] = 1.0 is expansion / trending
     }
   return(rates_total);
  }
//+------------------------------------------------------------------+
—Shaun Bosch
shadavbos@gmail.com
BACK TO LIST

Wealth-Lab.com: September 2023
The article “The Weekly Factor Pattern” in the August 2023 issue by Andrea Unger uses the notion of a 5-day trading week in determining the “weekly factor.” While this is usually not an issue for futures markets, which the article caters to, in stock markets, incomplete trading weeks tend to occur several times a year, with some countries enjoying market holidays more often than others. A recent example is the July 4th US holiday, which is the week I happen to be writing this. Considering the holiday, the Wealth-Lab C# code presented here compresses data into the true weekly scale even while applied to an intraday chart. We hope that taking partial weeks into account by using the trading range of 3 or 4 days—when required due to shortened trading weeks—will benefit stock traders interested in applying the “weekly factor” filter to their own systems.
Figure 5 shows a handful of long trades made by the simple breakout system given in Unger’s article applied to an intraday chart of Brent oil. The factor value is configurable through a parameter slider. On the bottom pane you can see the synthetic weekly bar compressed from the 60-minute data of the week before. The bluish background indicates that the system is in an active state (the weekly factor = 0.4 and the pattern has triggered), ready to issue new signals during trading day. And as does the author’s code in the article, this code for Wealth-Lab will exit on the last bar of the day.

FIGURE 5: WEALTH-LAB. The weekly factor filter is demonstrated here in a breakout system applied to an intraday chart of Brent oil.
using WealthLab.Backtest;
using System;
using WealthLab.Core;
using WealthLab.Data;
using WealthLab.Indicators;
using System.Collections.Generic;
using System.Linq;

namespace WealthScript
{
	public class WeeklyFactor : UserStrategyBase
	{
		public WeeklyFactor()
		{
			AddParameter("Range Factor", ParameterType.Double, 0.5, 0.1, 1.0, 0.1);
		}

        public override void Initialize(BarHistory bars)
        {
			rangeFactor = Parameters[0].AsDouble;
			StartIndex = 5;

			weekly = BarHistoryCompressor.ToWeeklyStartDate( bars, DayOfWeek.Monday);
			weekly = BarHistorySynchronizer.Synchronize( weekly, bars);
			PlotBarHistory(weekly, "weekly");
		}

        public override void Execute(BarHistory bars, int idx)
        {
			bool WeeklyFactor = Math.Abs(weekly.Open[idx] - weekly.Close[idx]) < rangeFactor * (weekly.High[idx] - weekly.Low[idx]);
			if (WeeklyFactor)
			{
				SetBackgroundColor(weekly, idx, WLColor.FromArgb( 20, WLColor.Blue), "weekly");

				if (!HasOpenPosition(bars, PositionType.Long))
					PlaceTrade( bars, TransactionType.Buy, OrderType.Stop, weekly.High[idx]);
				else if (!HasOpenPosition(bars, PositionType.Short))
					PlaceTrade( bars, TransactionType.Short, OrderType.Stop, weekly.Low[idx]);
			}

			/* close everything before end of day */
			if (bars.IsLastBarOfDay(idx + 1) && bars.Market.IsOpenMarketTime(bars.DateTimes[idx]))
				ClosePosition( LastPosition, OrderType.Market, 0, "Exit before market close");
        }

		double rangeFactor;
		BarHistory weekly;
    }
}
—Gene Geren (Eugene)
Wealth-Lab team
www.wealth-lab.com
BACK TO LIST

NinjaTrader: September 2023
The weekly factor pattern, introduced by Andrea Unger in the August 2023 issue, is available for download at the following link for NinjaTrader 8:
Once the file is downloaded, you can import the indicator into NinjaTrader 8 from within the control center by selecting Tools → Import → NinjaScript Add-On and then selecting the downloaded file for NinjaTrader 8.
You can review the indicator source code in NinjaTrader 8 by selecting the menu New → NinjaScript Editor → Indicators folder from within the control center window and selecting the weekly factor file.
A sample chart displaying the weekly factor is shown in Figure 6.

FIGURE 6: NINJATRADER. This demonstrates using the example strategy that is based on the weekly factor on a 15-minute chart of the gold futures contract (GC).
—NinjaTrader, LLC
www.ninjatrader.com
BACK TO LIST

TradingView: September 2023
Here is TradingView Pine Script code implementing the sample trading strategy given in the August 2023 article “The Weekly Factor Pattern” by Andrea Unger. The strategy, intended for educational purposes only, demonstrates how the equity curve can be improved by filtering trade entries using the weekly factor metric.
//  TASC Issue: September 2023 - Vol. 41, Issue 10
//     Article: Finding Compression And Expansion
//              The Weekly Factor Pattern
//  Article By: Andrea Unger
//    Language: TradingView's Pine Script™ v5
// Provided By: PineCoders, for tradingview.com


//@version=5
string title = 'TASC 2023.09 The Weekly Factor'
string stitle = 'TWF'
strategy(title, stitle, true)
if not (timeframe.isminutes and timeframe.period == '15')
    runtime.error('This strategy is designed for a bar' +
     'period of 15 minutes')


//#region Inputs:
string rangeFilterTooltip = 'Limiting ratio of the 5-day' +
     'body versus the 5-day high-low range.'          +
     'A lower range filter reduces the number of trades.'
float rangeFilter = input.float(0.5, 'Range Filter:',
     0.0, 1.0, 0.1, tooltip=rangeFilterTooltip)
//#endregion


//#region Week and Session properties:
// @type Holds the Session/Week OHLC value.
type OHLC
    float o
    float h
    float l
    float c


method isNewSession (OHLC s) =>
    s.c != s.c[1]


method calcBody (OHLC s) =>
    math.abs(s.o - s.c)


method calcFactor (OHLC s, float rangeFilter=1.0) =>
    s.calcBody() < rangeFilter*(s.h - s.l)


getOHLCValues (int length = 5) =>
    float _o = open[length-1]
    float _h = ta.highest(length)
    float _l = ta.lowest(length)
    float _c = close
    OHLC  _s = request.security(
     symbol     = syminfo.tickerid ,
     timeframe  = 'D' ,
     expression = OHLC.new(_o, _h, _l, _c) )


// Weekly OHLC and Weekly Factor (WF)
OHLC    W = getOHLCValues(5)
bool   WF = W.calcFactor(rangeFilter)


LB__  = plot.style_linebr
lineO = plot(W.o, 'Five-day Open' , color.aqua, 1, LB__)
lineH = plot(W.h, 'Five-day High' , color.blue, 1, LB__)
lineL = plot(W.l, 'Five-day Low' , color.blue, 1, LB__)
lineC = plot(W.c, 'Five-day Close', color.navy, 1, LB__)
fill(lineO, lineC, color.new(color.aqua, 90))
//#endregion


//#region Strategy
OHLC S            = getOHLCValues(1)
bool isNewSession = S.isNewSession()


plotshape(isNewSession and WF ? S.c : na, 'WF',
 shape.diamond, location.absolute, color.aqua,
 size=size.small)


var int BarCounter = 0
var int DayCounter = 0


if isNewSession
    // exit any previous trades
    strategy.close_all()
    BarCounter := 1
else
    BarCounter += 1


if WF
    if BarCounter > 1 and BarCounter < 91 // day 1?
        if close > S.h
            strategy.entry('long', strategy.long)
        if close < S.l
            strategy.entry('short', strategy.short)


float MP = strategy.position_size
bool isNewPosition = ta.change(MP) != 0.0 and MP != 0.0


if isNewPosition
    DayCounter := 0
if isNewSession
    DayCounter += 1
if DayCounter > 1 and strategy.openprofit > 0
    strategy.close_all()
//#endregion
The code is available at TradingView in the PineCodersTASC account: https://www.tradingview.com/u/PineCodersTASC/#published-scripts
An example chart is shown in Figure 7.
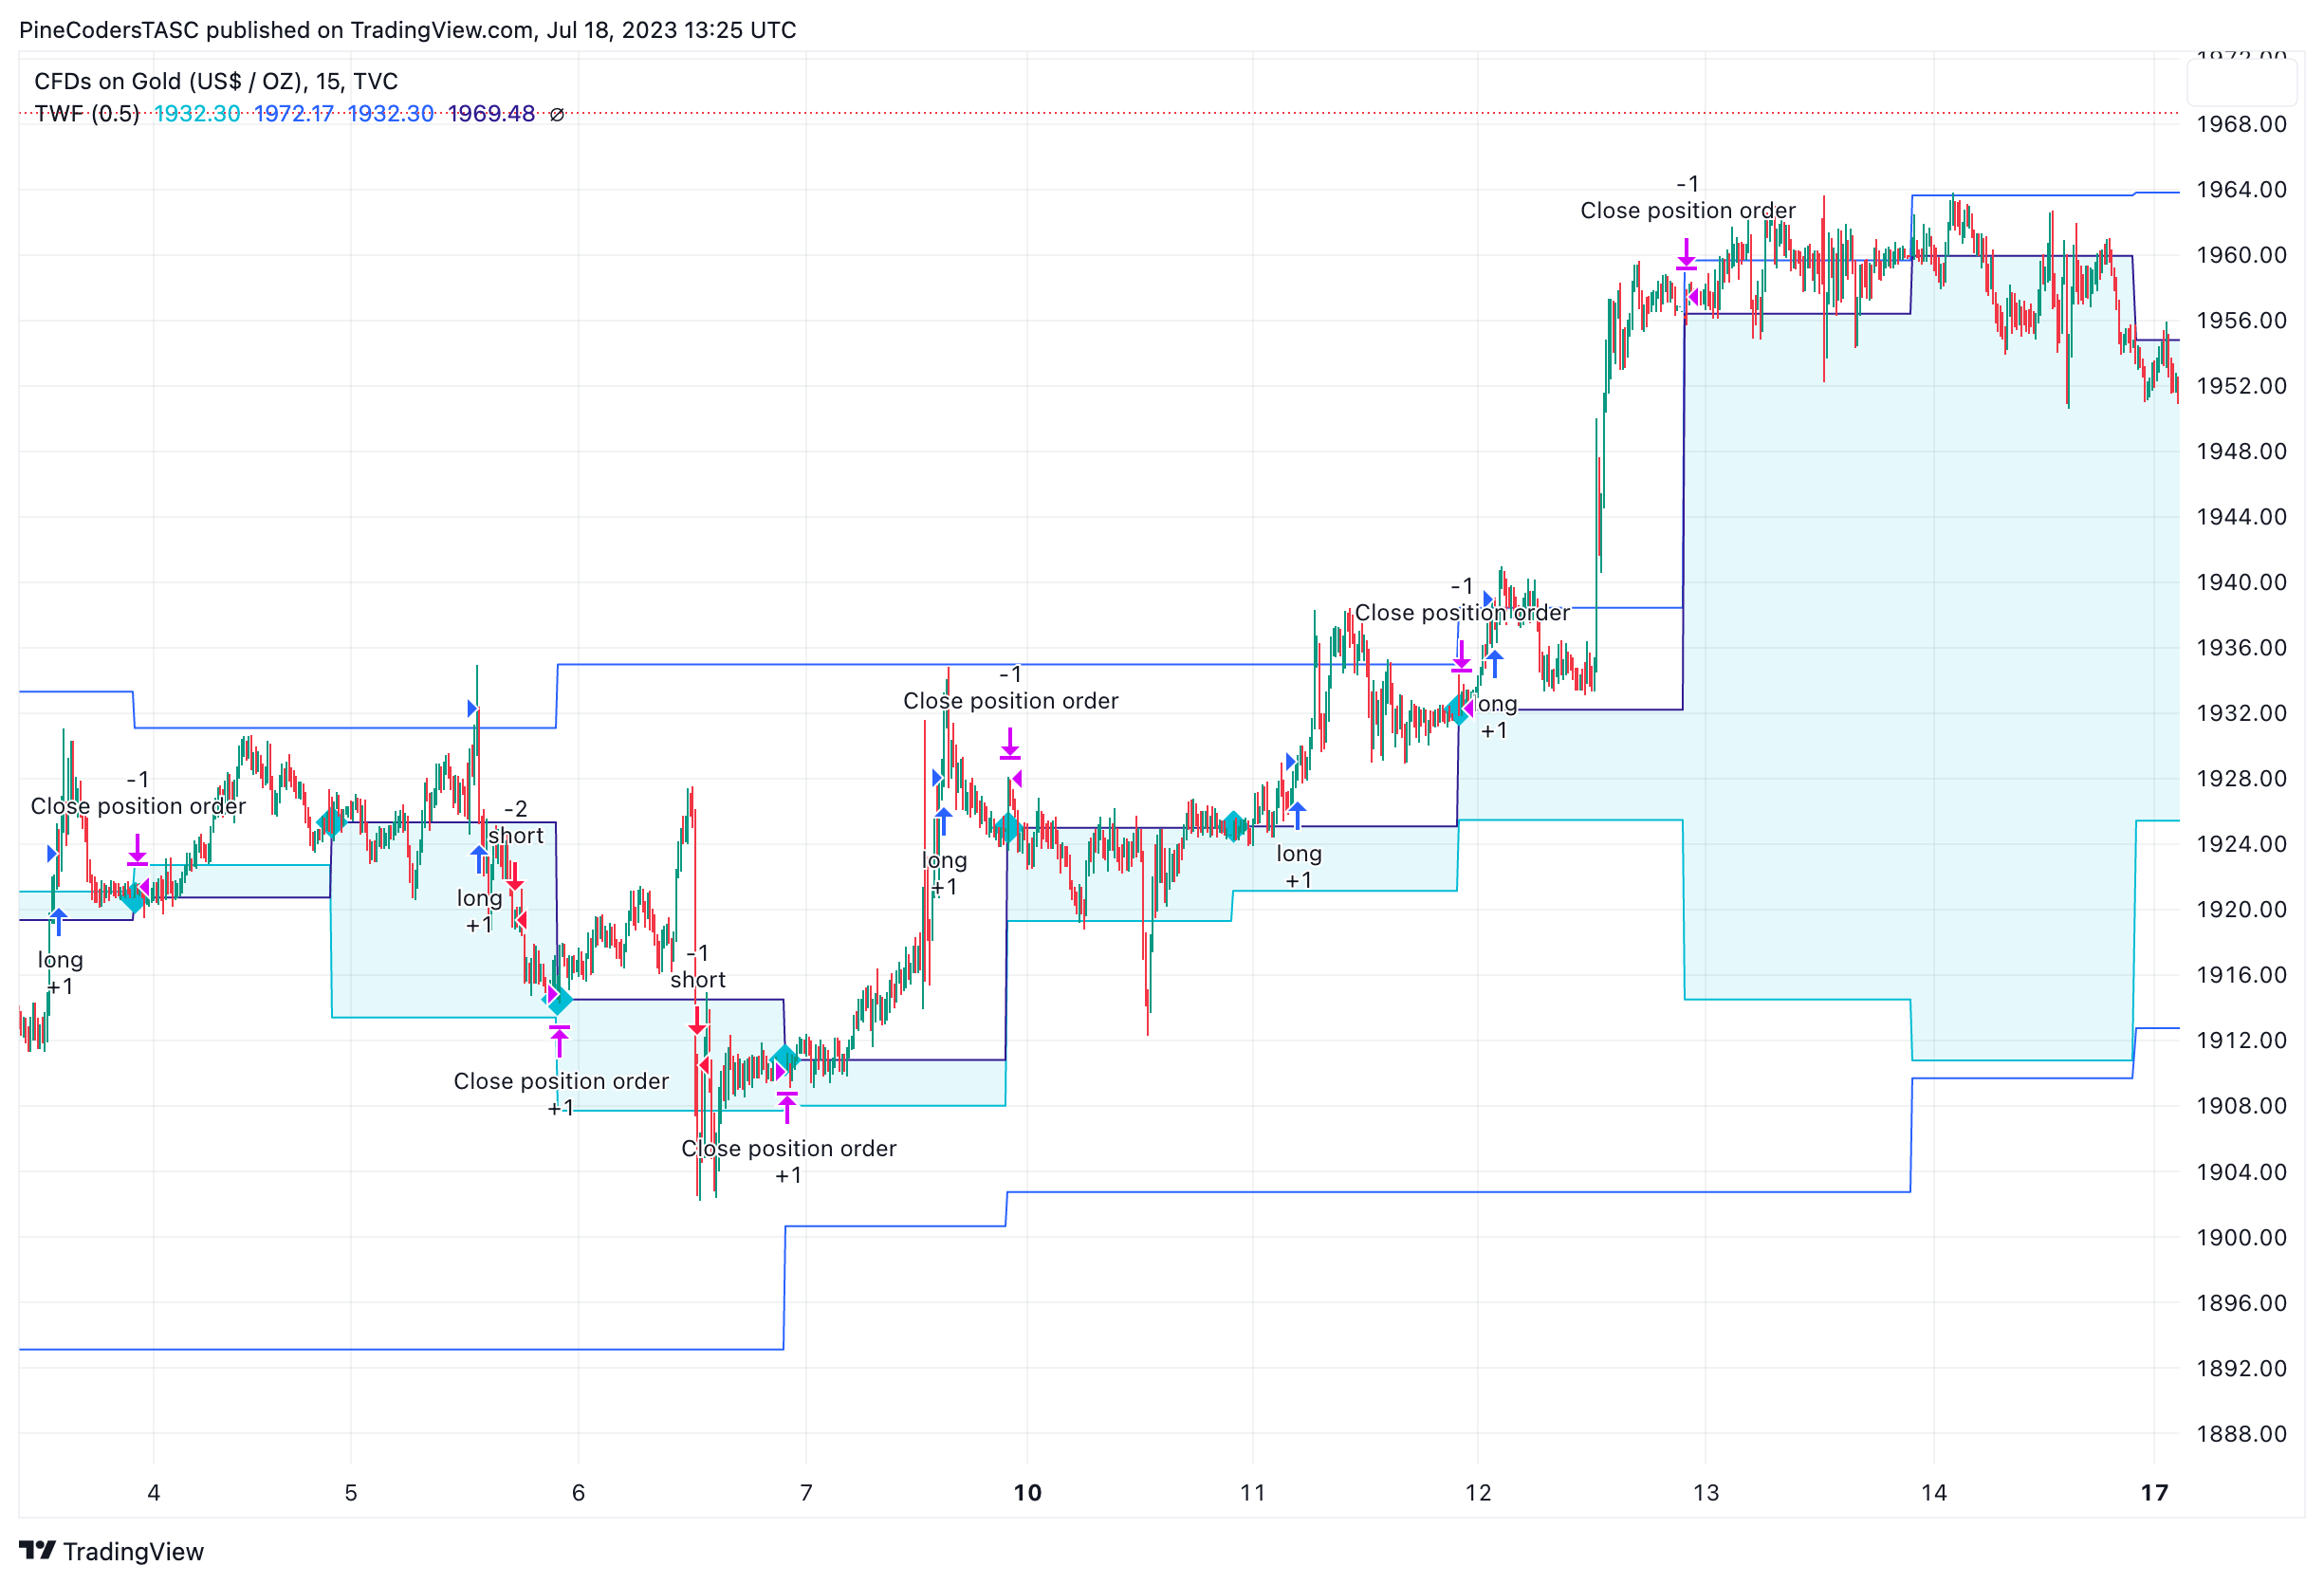
FIGURE 7: TRADINGVIEW. This shows the sample trading system on a chart of a CFD (contract for difference) on gold.
—PineCoders, for TradingView
www.TradingView.com
BACK TO LIST

Neuroshell Trader: September 2023
The weekly factor pattern discussed by Andrea Unger in his article in the August 2023 issue, “The Weekly Factor Pattern,” can be easily implemented in NeuroShell Trader. Simply select new indicator from the insert menu and use the indicator wizard to create the following indicator:
A<B( Abs(Sub(Lag(Open,5),Close)), Mul2(0.7,PriceRange(High,Low,5)) )
Users of NeuroShell Trader can go to the Stocks & Commodities section of the NeuroShell Trader free technical support website to download a copy of this or any previous Traders’ Tips.

FIGURE 8: NEUROSHELL TRADER. This demonstrates creating the weekly factor using NeuroShell Trader’s indicator wizard.
—Ward Systems Group, Inc.
sales@wardsystems.com
www.neuroshell.com
BACK TO LIST

AIQ: September 2023
The importable AIQ EDS file based on Andrea Unger’s article in the August 2023 issue, “The Weekly Factor Pattern,” can be obtained on request via rdencpa@gmail.com. The code is also shown below.
Code for the author’s indicator is set up in the AIQ EDS code file.
!The Weekly Factor Pattern
!Author: Andrea Unger, TASC Sep 2023
!Coded by: Richard Denning, 7/18/2023

!INPUTS:
RangeFilter is 1.

O is [open].
O5 is valresult(O,5).
C is [close].
C1 is  valresult(C,1).
H is [high].
L is [low].

MaxH5os1 is highresult(H,4,1).
MinL5os1 is lowresult(L,4,1).

WeeklyFactor if abs(O5 - C1) < RangeFilter * (MaxH5os1 - MinL5os1).

!To use WeeklyFactor as a trade filter just add it to the Buy rule, e.g.
! Buy if WeeklyFactor and ....your other systme buy rules.
—Richard Denning
rdencpa@gmail.com
for AIQ Systems
BACK TO LIST

The Zorro Project: September 2023
Andrea Unger proposed a filter for determining the market’s decision (or indecision). The MultiCharts code is a single line that directly converts to C.
Multicharts:
WeeklyFactor = AbsValue(OpenS(5) - CloseS(1)) < RangeFilter * (maxlist(highS(1), highS(2), highS(3), highS(4), highS(5)) - minlist(lowS(1), lowS(2), lowS(3), lowS(4), lowS(5)));
C equivalent:
WeeklyFactor = abs (priceO (5) – priceC(1)) < RangeFilter * (HH(5,0) – LL(5,0));
The code can be downloaded from the 2023 script repository on https://financial-hacker.com. The Zorro platform for C/C++ algo trading can be downloaded from https://zorro-project.com.
—Petra Volkova
The Zorro Project by oP group Germany
https://zorro-project.com
BACK TO LIST

Optuma: September 2023
The following formula, based on Andrea Unger’s article in the August 2023 issue, “The Weekly Factor Pattern,” calculates the 5-day open/close and high/low ranges, and uses a "weekly factor" of 0.7:
//Calculate 5 day Open/Close and High/low ranges;

OC_Range=ABS(OPEN()[4] - CLOSE());

HL_Range=HIGHESTHIGH(BARS=5, INCBAR=True) - LOWESTLOW(BARS=5, INCBAR=True);

//Filter using Weekly Factor of 0.7;

WF=VARTOLIST(VAL=0.7);

OC_Range < WF * HL_RANGE
—support@optuma.com
BACK TO LIST
Originally published in the September 2023 issue of
Technical Analysis of STOCKS & COMMODITIES magazine.
All rights reserved. © Copyright 2023, Technical Analysis, Inc.


