TRADERS’ TIPS
October 2023

For this month’s Traders’ Tips, the focus is Alfred François Tagher’s article in this issue, “Backwardation, Positioning, And Momentum: A Recipe For High-Conviction Trades.” Here, we present the October 2023 Traders’ Tips code with possible implementations in various software.
You can right-click on any chart to open it in a new tab or window and view it at it’s originally supplied size, often much larger than the version printed in the magazine.
The Traders’ Tips section is provided to help the reader implement a selected technique from an article in this issue or another recent issue. The entries here are contributed by software developers or programmers for software that is capable of customization.

TradeStation: October 2023
In his article in this issue, “Backwardation, Positioning, And Momentum: A Recipe For High-Conviction Trades,” author Alfred François Tagher presents a Commitments of Traders (COT) commercials indicator that is a 26-week fast stochastic (%K) of the commercial open interest values. These values are disseminated weekly through the Commitments of Traders report.
By default, the indicator presented here will only use the futures report. To use the futures and options report, set the input UseFuturesAndOptionsReport to true. This study is intended to be applied to futures symbols for which there is Commitment of Traders data
Indicator: COT Commercials

// TASC OCT 2023
// Indicator: COT Commercials
// Alfred François Tagher

inputs:
	UseFuturesAndOptionsReport( false ),
	DoComms( true ),
	DoSpecs( false ),
	Lkbk( 26 ),
	OB( 90 ),
	OS( 10 ),
	NonExtremeColor( Blue ),
	ExtremeColor( Red );

variables:
	double CommNet(0),
	double SpecNet(0),
	double COTCommIdx(0),
	double COTSpecsIdx(0),
    double CommLong( 0 ),
	double oCommLongErr( 0 ),
	double CommShort( 0 ),
	double oCommShortErr( 0 ),
	double SpecLong( 0 ),
	double oSpecLongErr( 0 ),
	double SpecShort( 0 ),
	double oSpecShortErr( 0 );

once
begin
	if Category > 0 then
		RaiseRuntimeError(
		 "Study applies to futures symbols only.");
end;

if UseFuturesAndOptionsReport then
begin
	CommLong = FundValue( "COTC-12",
	 0, oCommLongErr );
	CommShort = FundValue( "COTC-13",
	 0, oCommShortErr);
	SpecLong = FundValue( "COTC-16",
	 0, oSpecLongErr );
	SpecShort = FundValue( "COTC-17",
	 0, oSpecShortErr );
end
else
begin
	CommLong = FundValue( "COTF-12",
	 0, oCommLongErr );
	CommShort = FundValue( "COTF-13",
	 0, oCommShortErr);
	SpecLong = FundValue( "COTF-16",
	 0, oSpecLongErr );
	SpecShort = FundValue( "COTF-17",
	 0, oSpecShortErr );
end;

if oCommLongErr = fdrOk and oCommShortErr = fdrOk then
begin
	CommNet = CommLong - CommShort;
end;

if oSpecLongErr = fdrOk and oSpecShortErr = fdrOk then
begin
	SpecNet = SpecLong - SpecShort;
end;

if DoComms then
begin
	Value1 = CommNet - Lowest(CommNet, Lkbk);
	Value2 = Highest(CommNet, Lkbk)
	 - Lowest(CommNet, Lkbk);

	if Value2 <> 0 then
		CotCommIdx = 100*(Value1/Value2)
	else
		CotCommIdx = 1;

	Plot1(CotCommIdx, "CotCommIdx");

	if CotCommIdx > OB or CotCommIdx < OS then
		SetPlotColor(1, ExtremeColor)
	else
		SetPlotColor(1, NonExtremeColor);
end;

if DoSpecs then
begin
	Value1 = SpecNet - Lowest(SpecNet, Lkbk);
	Value2 = Highest(SpecNet, Lkbk)
	 - Lowest(SpecNet, Lkbk);

	if Value2 <> 0 then
		CotSpecsIdx = 100 * (Value1/Value2)
	else
		CotSpecsIdx = 1;

	Plot4(CotSpecsIdx, "CotSpecsIdx");


	if CotSpecsIdx > OB or CotSpecsIdx < OS then
		SetPlotColor(4, ExtremeColor)
	else
		SetPlotColor(4, NonExtremeColor);
end;

Plot2(OB, "OB");
Plot3(OS, "OS");
A sample chart is shown in Figure 1.

FIGURE 1: TRADESTATION. Here is a TradeStation continuous weekly chart of corn futures showing 2021, 2022, and 2023 with the COT commercials indicator applied.
This article is for informational purposes. No type of trading or investment recommendation, advice, or strategy is being made, given, or in any manner provided by TradeStation Securities or its affiliates.
—John Robinson
TradeStation Securities, Inc.
www.TradeStation.com
BACK TO LIST
MetaQuotes: October 2023
Here is code for use in MetaQuotes based on the article in this issue, “Backwardation, Positioning, And Momentum: A Recipe For High-Conviction Trades” by Alfred François Tagher.
//+------------------------------------------------------------------+
//|                                              COT Commercials.mq5 |
//|                            Copyright © October 2023, Shaun Bosch |
//|                                              shadavbos@gmail.com |
//+------------------------------------------------------------------+
#property copyright "Copyright © October 2023, Shaun Bosch"
#property link      "shadavbos@gmail.com"
#property version   "1.00"
#property description   "by Alfred François Tagher (TASC Magazine October 2023)"
#property indicator_separate_window
#property indicator_buffers 2
#property indicator_plots   1
#property indicator_maximum 110
#property indicator_minimum -10
//--- plot COT Index
#property indicator_label1  "COT Index"
#property indicator_type1   DRAW_COLOR_LINE
#property indicator_color1  clrDodgerBlue;clrRed
#property indicator_style1  STYLE_SOLID
#property indicator_width1  2
//--- enumerations
enum ENUM_SOURCE
  {
   SOURCE_HIGH,         // Use High Price Data
   SOURCE_OPEN          // Use Open Price Data
  };
//--- input parameters
input ENUM_SOURCE    inp_source_list      = SOURCE_HIGH;       // Source List
input int            inp_period           = 26;                // Period
input double         inp_overbought       = 90.0;              // Overbought Level
input double         inp_oversold         = 10.0;              // Oversold Level
//--- indicator buffers
double               cot_line[];
double               cot_colors[];
//--- indicator variables
int                  period;
double               overbought;
double               oversold;
//+------------------------------------------------------------------+
//| Custom indicator initialization function                         |
//+------------------------------------------------------------------+
int OnInit()
  {
//--- check input parameters
   period = inp_period < 1 ? 1 : inp_period;
   overbought = inp_overbought < 50.0 ? 50.0 : inp_overbought > 100.0 ? 100.0 : NormalizeDouble(inp_overbought, 1);
   oversold = inp_oversold < 0.0 ? 0.0 : inp_oversold > 50.0 ? 50.0 : NormalizeDouble(inp_oversold, 1);
//--- indicator buffers mapping
   SetIndexBuffer(0, cot_line, INDICATOR_DATA);
   SetIndexBuffer(1, cot_colors, INDICATOR_COLOR_INDEX);
//--- accuracy of drawing of indicator values
   IndicatorSetInteger(INDICATOR_DIGITS, 1);
//--- set indicator name display
   string src_name = inp_source_list == SOURCE_HIGH ? "High Price Data" : "Open Price Data";
   string short_name = "COT Index (" + src_name + ", " + IntegerToString(period) + ", " + DoubleToString(overbought, 1) + ", " + DoubleToString(oversold, 1) + ")";
   IndicatorSetString(INDICATOR_SHORTNAME, short_name);
//--- set indicator levels
   IndicatorSetInteger(INDICATOR_LEVELS, 2);
   IndicatorSetDouble(INDICATOR_LEVELVALUE, 0, overbought);
   IndicatorSetDouble(INDICATOR_LEVELVALUE, 1, oversold);
//--- an empty value for plotting, for which there is no drawing
   PlotIndexSetDouble(0, PLOT_EMPTY_VALUE, EMPTY_VALUE);
//--- successful initialization
   return(INIT_SUCCEEDED);
  }
//+------------------------------------------------------------------+
//| Custom indicator iteration function                              |
//+------------------------------------------------------------------+
int OnCalculate(const int rates_total,
                const int prev_calculated,
                const datetime &time[],
                const double &open[],
                const double &high[],
                const double &low[],
                const double &close[],
                const long &tick_volume[],
                const long &volume[],
                const int &spread[])
  {
//--- populate COT buffers
   wi_COT(rates_total, prev_calculated, inp_source_list, period, open, high, cot_line);
//--- bar index start
   int bar_index;
   if(prev_calculated == 0)
      bar_index = 0;
   else
      bar_index = prev_calculated - 1;
//--- main loop
   for(int i = bar_index; i < rates_total && !_StopFlag; i++)
     {
      if(i < period)
         cot_colors[i] = EMPTY_VALUE;
      else
         cot_colors[i] = cot_line[i] > overbought || cot_line[i] < oversold ? 1.0 : 0.0;
     }
//--- return value of prev_calculated for next call
   return(rates_total);
  }
//+------------------------------------------------------------------+
//| Commitments Of Traders Commercials (COT)                         |
//+------------------------------------------------------------------+
//--- by Alfred François Tagher (TASC Magazine October 2023)
//         //--- System bar_index references:
int wi_COT(const int rates_total,
           const int prev_calculated,
           //--- Input variables and arrays:
           const ENUM_SOURCE src, // Source Data
           const int prd, // Period (min val: 1; default val: 26)
           const double &open[], // Open Price
           const double &high[], // High Price
           //--- Output arrays:
           double &result[])
  {
//--- bar index start
   int bar_index;
   if(prev_calculated == 0)
      bar_index = 0;
   else
      bar_index = prev_calculated - 1;
//--- main loop
   for(int i = bar_index; i < rates_total && !_StopFlag; i++)
     {
      if(i < prd)
         result[i] = EMPTY_VALUE;
      else
        {
         if(src == SOURCE_OPEN)
           {
            double hv = open[i], lv = open[i];
            for(int j = 0; j < prd; j++)
              {
               hv = open[i - j] > hv ? open[i - j] : hv;
               lv = open[i - j] < lv ? open[i - j] : lv;
              }
            double value1 = open[i] - lv;
            double value2 = hv - lv;
            result[i] = value2 != 0.0 ? 100.0 * (value1 / value2) : 1.0;
           }
         if(src == SOURCE_HIGH)
           {
            double hv = high[i], lv = high[i];
            for(int j = 0; j < prd; j++)
              {
               hv = high[i - j] > hv ? high[i - j] : hv;
               lv = high[i - j] < lv ? high[i - j] : lv;
              }
            double value1 = high[i] - lv;
            double value2 = hv - lv;
            result[i] = value2 != 0.0 ? 100.0 * (value1 / value2) : 1.0;
           }
        }
     }
   return(rates_total);
  }
//+------------------------------------------------------------------+
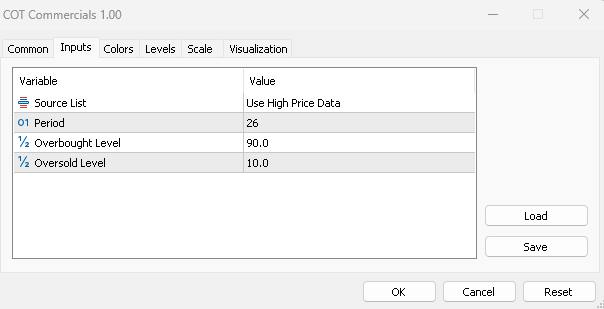
FIGURE 2: METAQUOTES INPUT TAB
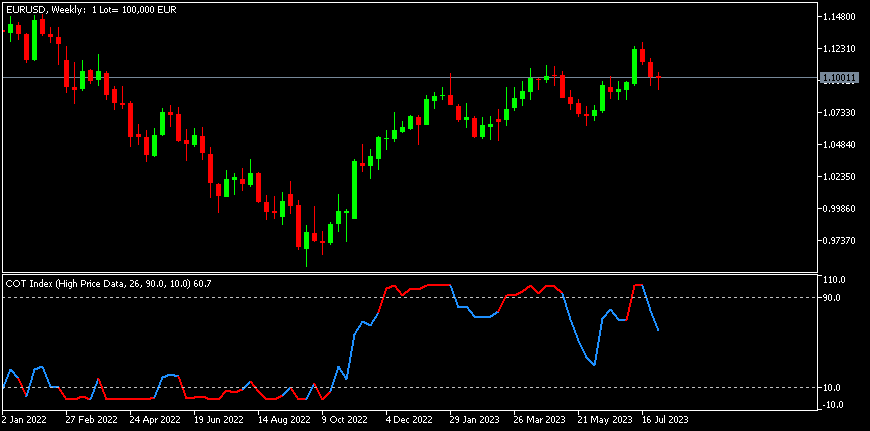
FIGURE 3: METAQUOTES
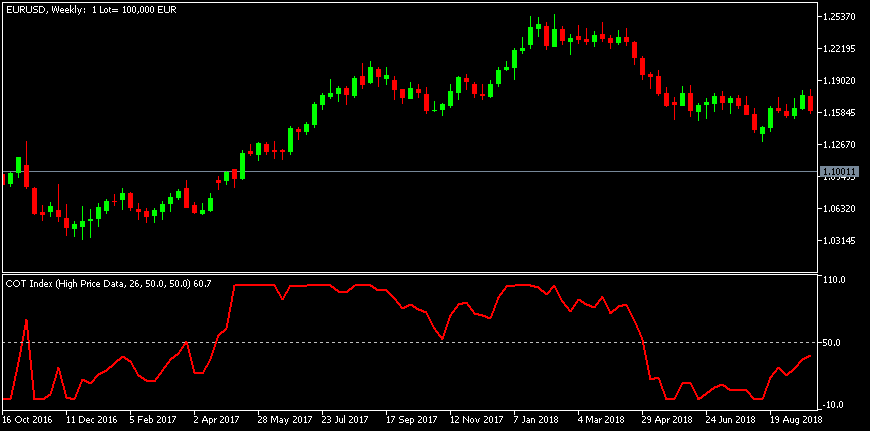
FIGURE 4: METAQUOTES
—Shaun Bosch
shadavbos@gmail.com
BACK TO LIST

Wealth-Lab.com: October 2023
Wealth-Lab’s extension package called “Data Extensions” adds new capabilities designed to bring Commitments of Traders data in both new and legacy CFTC formats to Wealth-Lab users. If used together with the Quandl historical data provider, a companion built-in strategy called “Extremes in Commitments of Traders” plots all COT data for a supported futures symbol, including the open interest. And of course it comes with trading rules designed to help backtest buys and sells according to extremes in the positions of commercial traders. This is especially interesting, since Alfred François Tagher’s article in this issue touches on the idea of exploiting extreme readings in the Commitments of Traders data.
To illustrate Tagher’s 26-week fast stochastic indicator of the COT commercials data, we created the code shown here and ran it on the symbol CFTC/088691_FO_L_ALL. You can see the results in Figure 5. With the “Quandl” provider (now a Nasdaq data service) installed, that makes Wealth-Lab download and plot the COT data for CMX gold in legacy format. The green line plotted at the bottom pane reflects the oscillator with its overbought and oversold thresholds.

FIGURE 5: WEALTH-LAB. The custom fast stochastic indicator is applied to a weekly COT chart of gold. The CFTC data is provided by Quandl.
using WealthLab.Backtest;
using System;
using WealthLab.Core;
using WealthLab.Data;
using WealthLab.Indicators;
using System.Collections.Generic;
using WealthLab.DataExtensions;

namespace WealthScript1
{
    public class MyStrategy : UserStrategyBase
    {
        public override void Initialize(BarHistory bars)
        {
			/* Commitment of Traders - Gold */
			q = QuandlIndicator.Series(bars, "CFTC", "088691_FO_L_ALL");
			b = GetHistoryUnsynched("CFTC/088691_FO_L_ALL", HistoryScale.Daily);
			netCommercials = b.NamedSeries["Commercial Long"] - b.NamedSeries["Commercial Short"];
			netCommercials = TimeSeriesSynchronizer.Synchronize(netCommercials, bars);
			_high = Highest.Series(netCommercials, lookback);
			_low = Lowest.Series(netCommercials, lookback);

			TimeSeries Value1 = netCommercials - _low;
			TimeSeries Value2 = _high - _low;
			TimeSeries CotCommIdx = new TimeSeries( netCommercials.DateTimes );
			for (int i = 0; i < netCommercials.Count; i++)
			{
				if( Value2[i] != 0 )
					CotCommIdx[i] = 100 * (Value1[i] / Value2[i]);
				else
					CotCommIdx[i] = 1;
			}

			PlotTimeSeries( netCommercials, "Net Commercials", "NC", WLColor.Gray, PlotStyle.HistogramTwoColor);
			PlotTimeSeries( CotCommIdx, "CotCommIdx", "cot", WLColor.LightGreen, PlotStyle.ThickLine);
			DrawHorzLine( OS, WLColor.Red, 2, LineStyle.Solid, "cot");
			DrawHorzLine( OB, WLColor.Blue, 2, LineStyle.Solid, "cot");
		}

        public override void Execute(BarHistory bars, int idx){}

        /* declare private variables below */
		QuandlIndicator q;
		BarHistory b;
		TimeSeries netCommercials, _high, _low;
		int lookback = 26, OB = 90, OS = 10;
	}
}
—Gene Geren (Eugene)
Wealth-Lab team
www.wealth-lab.com
BACK TO LIST

NinjaTrader: October 2023
The COT commercials indicator, which is presented in Alfred François Tagher’s article in this issue titled “Backwardation, Positioning, And Momentum: A Recipe For High-Conviction Trades,” is available for download at the following link for NinjaTrader 8:
Once the file is downloaded, you can import the indicator into NinjaTrader 8 from within the control center by selecting Tools → Import → NinjaScript Add-On and then selecting the downloaded file for NinjaTrader 8.
You can review the indicator source code in NinjaTrader 8 by selecting the menu New → NinjaScript Editor → Indicators folder from within the control center window and selecting the file.
A sample chart displaying the indicator is shown in Figure 6.

FIGURE 6: NINJATRADER. A weekly chart of the Sept 2023 contract of MES is shown with the COT index and the commercials indicator.
NinjaScript uses compiled DLLs that run native, not interpreted, to provide you with the highest performance possible.
—NinjaTrader, LLC
www.ninjatrader.com
BACK TO LIST

TradingView: October 2023
Here is TradingView Pine Script code implementing the COT commercials indicator discussed in the article in this issue by Alfred François Tagher, titled “Backwardation, Positioning, And Momentum: A Recipe For High-Conviction Trades.”
//  TASC Issue: October 2023 - Vol. 41, Issue 11
//     Article: Following The Smart Money
//              Backwardation, Positioning, And Momentum:
//              A Recipe For High-Conviction Trades
//  Article By: Alfred François Tagher
//    Language: TradingView's Pine Script™ v5
// Provided By: PineCoders, for tradingview.com


//@version=5
string title  = 'TASC 2023.10 COT Commercials Indicator'
string stitle = 'COTCI'
indicator(title, stitle, false)


import TradingView/LibraryCOT/2 as cot


if not (timeframe.isweekly)
    runtime.error('This strategy is designed for a weekly bar')


//#region   Inputs:
string doCommsTooltip = 'Use the data reported in the legacy format '+
     'report for the activity of the commercial traders/hedgers.'
string doSpecsTooltip = 'Use the data reported for the activity of ' +
     'noncommercial traders (speculator).'
bool doComms  = input.bool(true, 'Do Comms?', tooltip=doCommsTooltip)
bool doSpecs  = input.bool(false, 'Do Specs?', tooltip=doSpecsTooltip)
int lbPeriod  = input.int(26, 'Lookback Period:', 1)
float obLevel = input.float(90.0, 'Overbought Level:', 0.01, 99.9)
float osLevel = input.float(10.0, 'Oversold Level:', 0.01, 99.9)
//#endregion


//#region   Functions:
COT_net_position (string metric, simple bool repaint=true) =>
    idNcomShort = cot.COTTickerid(
     COTType = 'Legacy', CFTCCode = cot.convertRootToCOTCode("Auto"),
     includeOptions = false, metricName = metric, metricDirection = 'Short',
     metricType = 'All')
    idNcomLong = cot.COTTickerid(
     COTType = 'Legacy', CFTCCode = cot.convertRootToCOTCode("Auto"),
     includeOptions=false, metricName=metric, metricDirection='Long',
     metricType = 'All')
    b = repaint ? barmerge.gaps_on : barmerge.gaps_off
    l = repaint ? barmerge.lookahead_on : barmerge.lookahead_off
    mShort = request.security(idNcomShort,timeframe.period,close,b,l)
    mLong  = request.security(idNcomLong, timeframe.period,close,b,l)
    mLong - mShort
//#endregion


//#region   Calculations:
float commNet   = COT_net_position('Commercial Positions')
float specsNet  = COT_net_position('Noncommercial Positions')


float v1 = 0.0, v2 = 0.0, cotCommIdx = 1.0, cotSpecIdx = 1.0
float lowestCommNet   = ta.lowest(commNet,   lbPeriod)
float highestCommNet  = ta.highest(commNet,  lbPeriod)
float lowestSpecsNet  = ta.lowest(specsNet,  lbPeriod)
float highestSpecsNet = ta.highest(specsNet, lbPeriod)


if doComms
    v1 := commNet - lowestCommNet
    v2 := highestCommNet - lowestCommNet
    cotCommIdx := v2 != 0 ? 100 * v1 / v2 : 1.0


if doSpecs
    v1 := specsNet - lowestSpecsNet
    v2 := highestSpecsNet - lowestSpecsNet
    cotSpecIdx := v2 != 0 ? 100 * v1 / v2 : 1.0
//#endregion


//#region   Visuals:
color colComm = cotCommIdx > obLevel or cotCommIdx < osLevel ?
              color.red : chart.fg_color
color colSpec = cotSpecIdx > obLevel or cotSpecIdx < osLevel ?
              color.red : chart.fg_color
plot(doComms ? cotCommIdx : na, 'Five-day Open' , colComm, 1)
plot(doSpecs ? cotSpecIdx : na, 'Five-day High' , colSpec, 1)
hline(obLevel,'Overbought Level',chart.fg_color,hline.style_dotted,1)
hline(osLevel,'Oversold Level',  chart.fg_color,hline.style_dotted,1)
//plot(commNet)
//#endregion
The indicator is available on TradingView in the PineCodersTASC account: https://www.tradingview.com/u/PineCodersTASC/#published-scripts.
An example chart is shown in Figure 7.
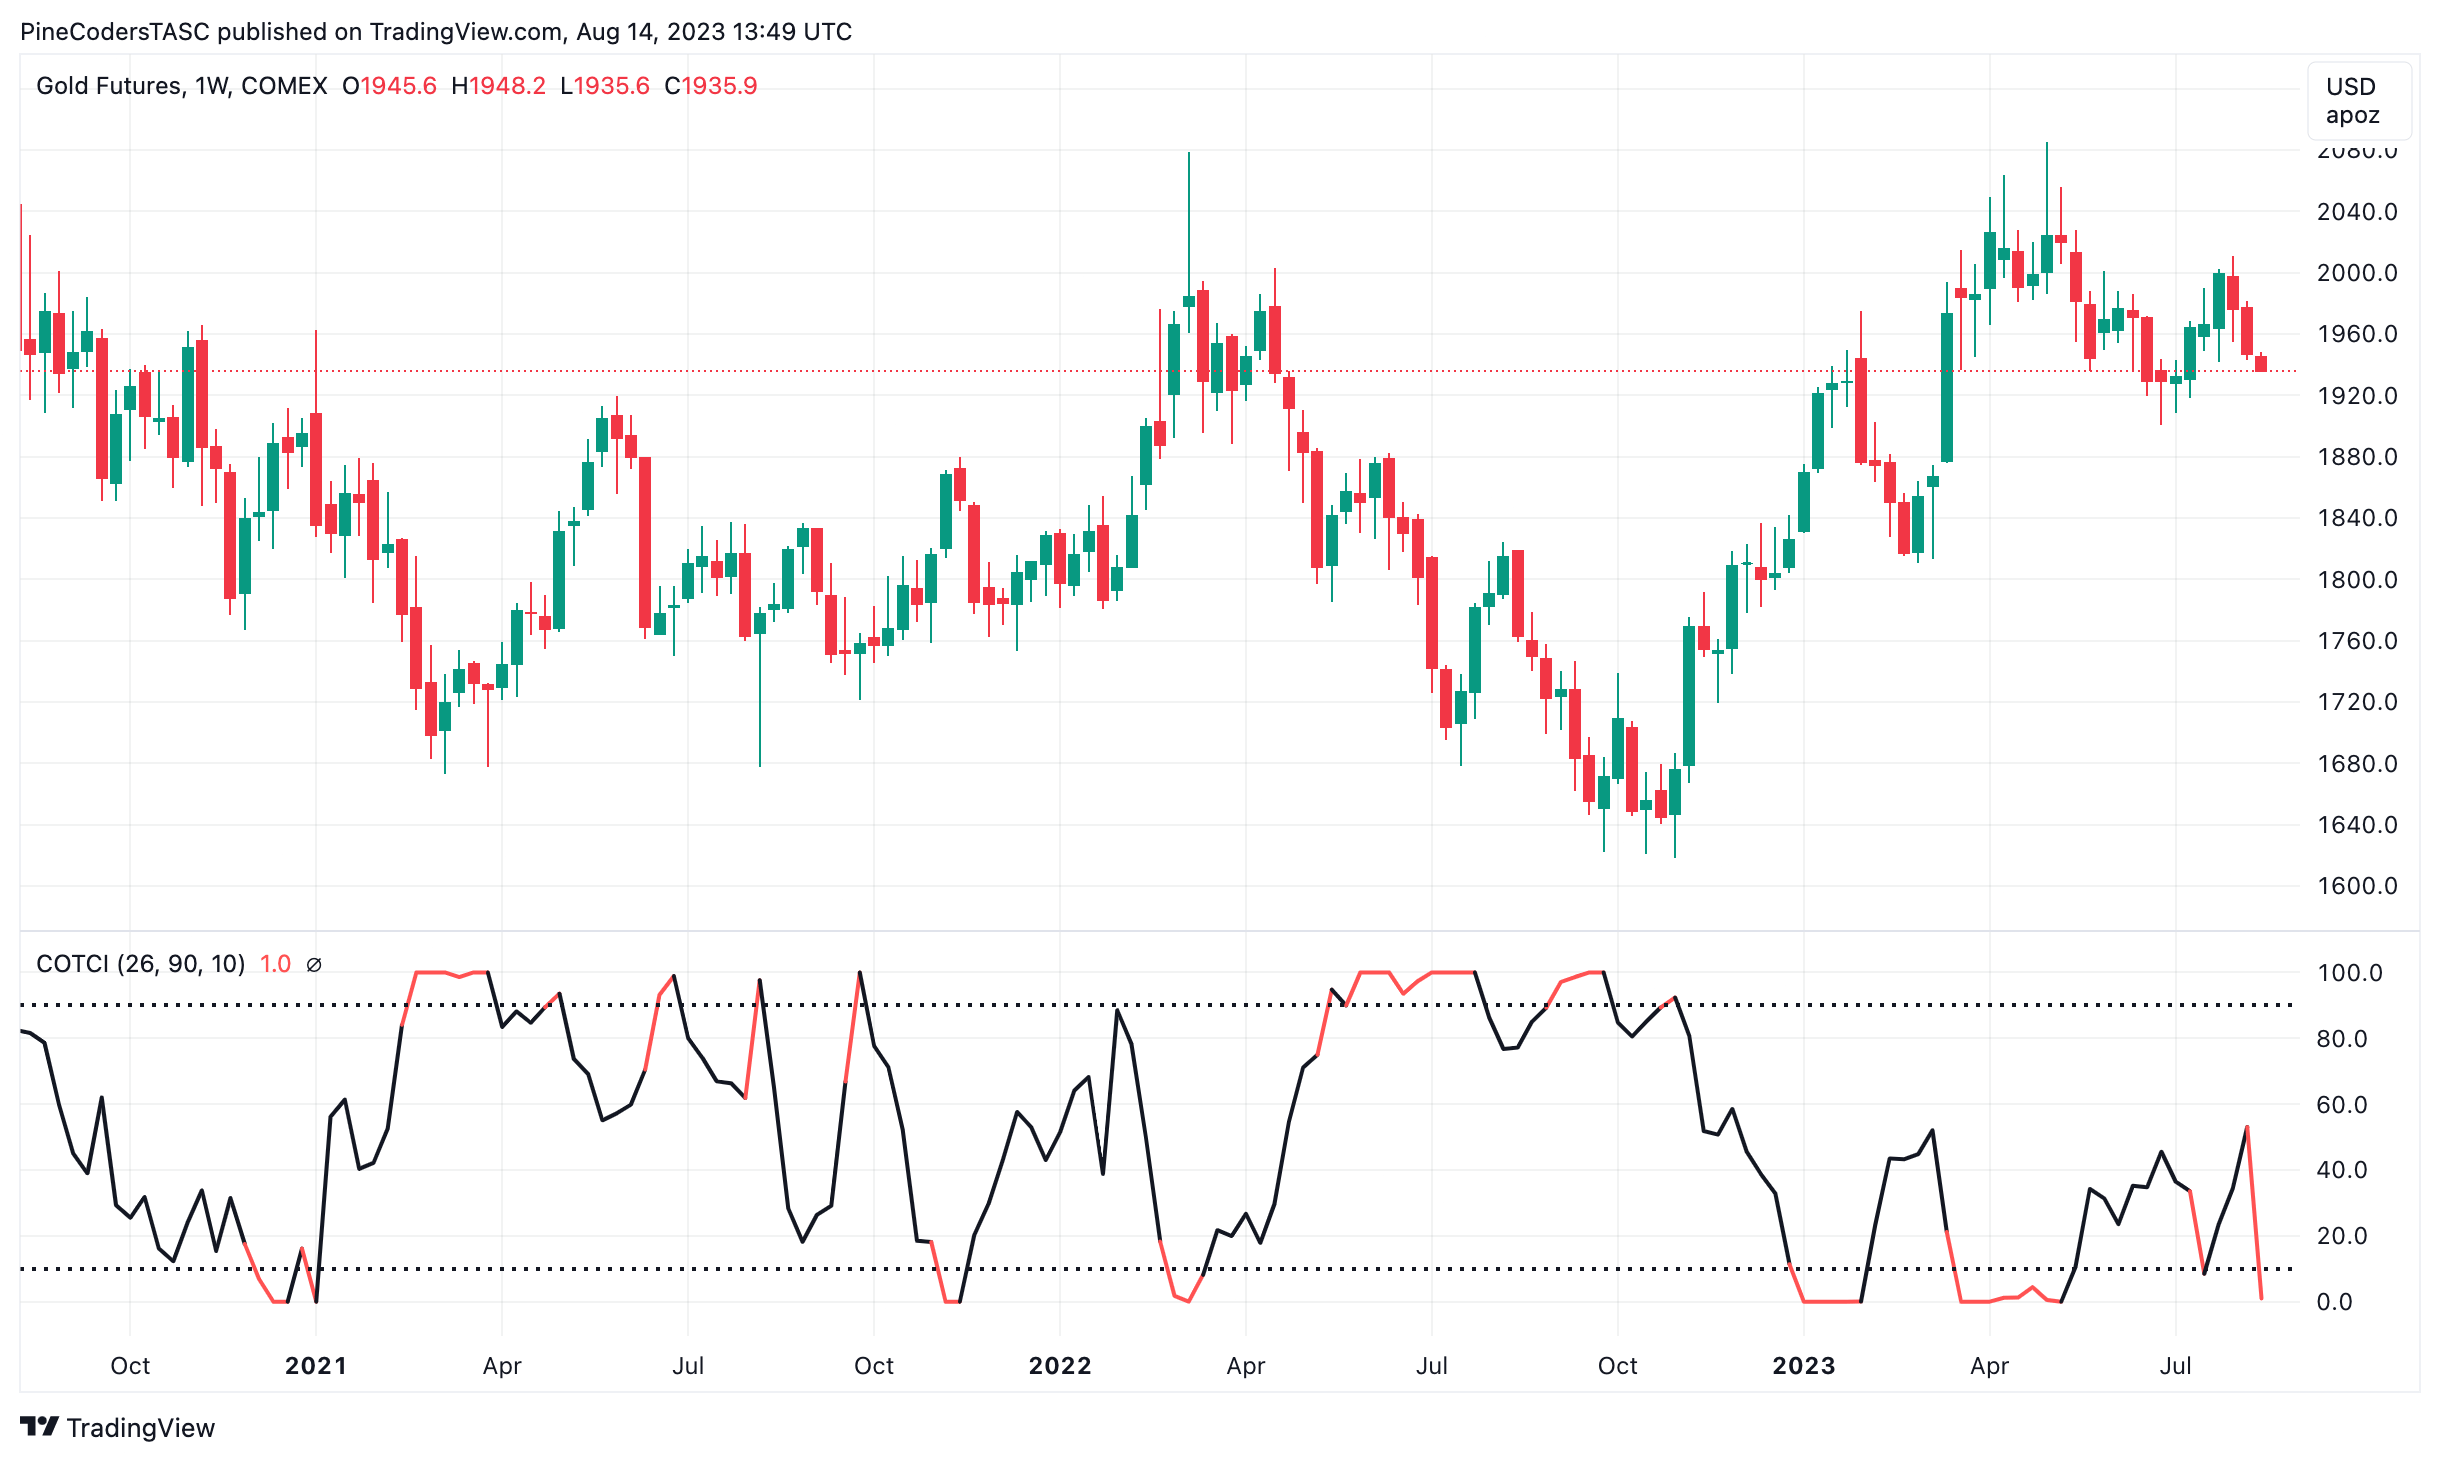
FIGURE 7: TRADINGVIEW. The indicator plotted here on gold futures.
—PineCoders, for TradingView
www.TradingView.com
BACK TO LIST

Neuroshell Trader: October 2023
system can be easily implemented in NeuroShell Trader based on Alfred François Tagher’s article in this issue, “Backwardation, Positioning, And Momentum: A Recipe For High-Conviction Trades” by combining some of NeuroShell Trader’s 800+ indicators. To implement the trading system, select new strategy from the insert menu and use the trading strategy wizard to create the following strategy:
BUY LONG CONDITIONS: [All of which must be true]
     A>B(Close,Sugar #11 March 2024 Close)
     A>B(Max(Stoch%K(Sugar #11 Net Commercial HLC,26),5),90)
     High Channel Breakout(High,5)

LONG TRAILING STOP PRICES:
     TrailPricePnts(Trading System,5)

SELL LONG CONDITIONS: [All of which must be true]
     Low Channel Breakout(Low,5)
A sample chart is shown in Figure 8. Note that the underlying chart is created with the spot price, while the forward price and Commitment Of Traders data are added as other instrument data.

FIGURE 8: NEUROSHELL TRADER. This NeuroShell Trader chart shows the backwardation, positioning, and momentum trading system for sugar #11.
Users of NeuroShell Trader can go to the Stocks & Commodities section of the NeuroShell Trader free technical support website to download a copy of this or any previous Traders’ Tips.
—Ward Systems Group, Inc.
sales@wardsystems.com
www.neuroshell.com
BACK TO LIST

Optuma: October 2023
In this issue, Alfred François Tagher discusses an indicator based on the COT index in his article “Backwardation, Positioning, And Momentum: A Recipe For High-Conviction Trades.” Optuma has a COT database from which we calculate a number of tools, including COT Sentiment. This automatically calculates the stochastic of the Net Commercials − (Net Large Speculators + Net Small Speculators) positions without the need to program anything. The tool is based on a 52-week stochastic but can be adjusted accordingly. Figure 9 demonstrates the 26-week COT Sentiment for WTI crude.
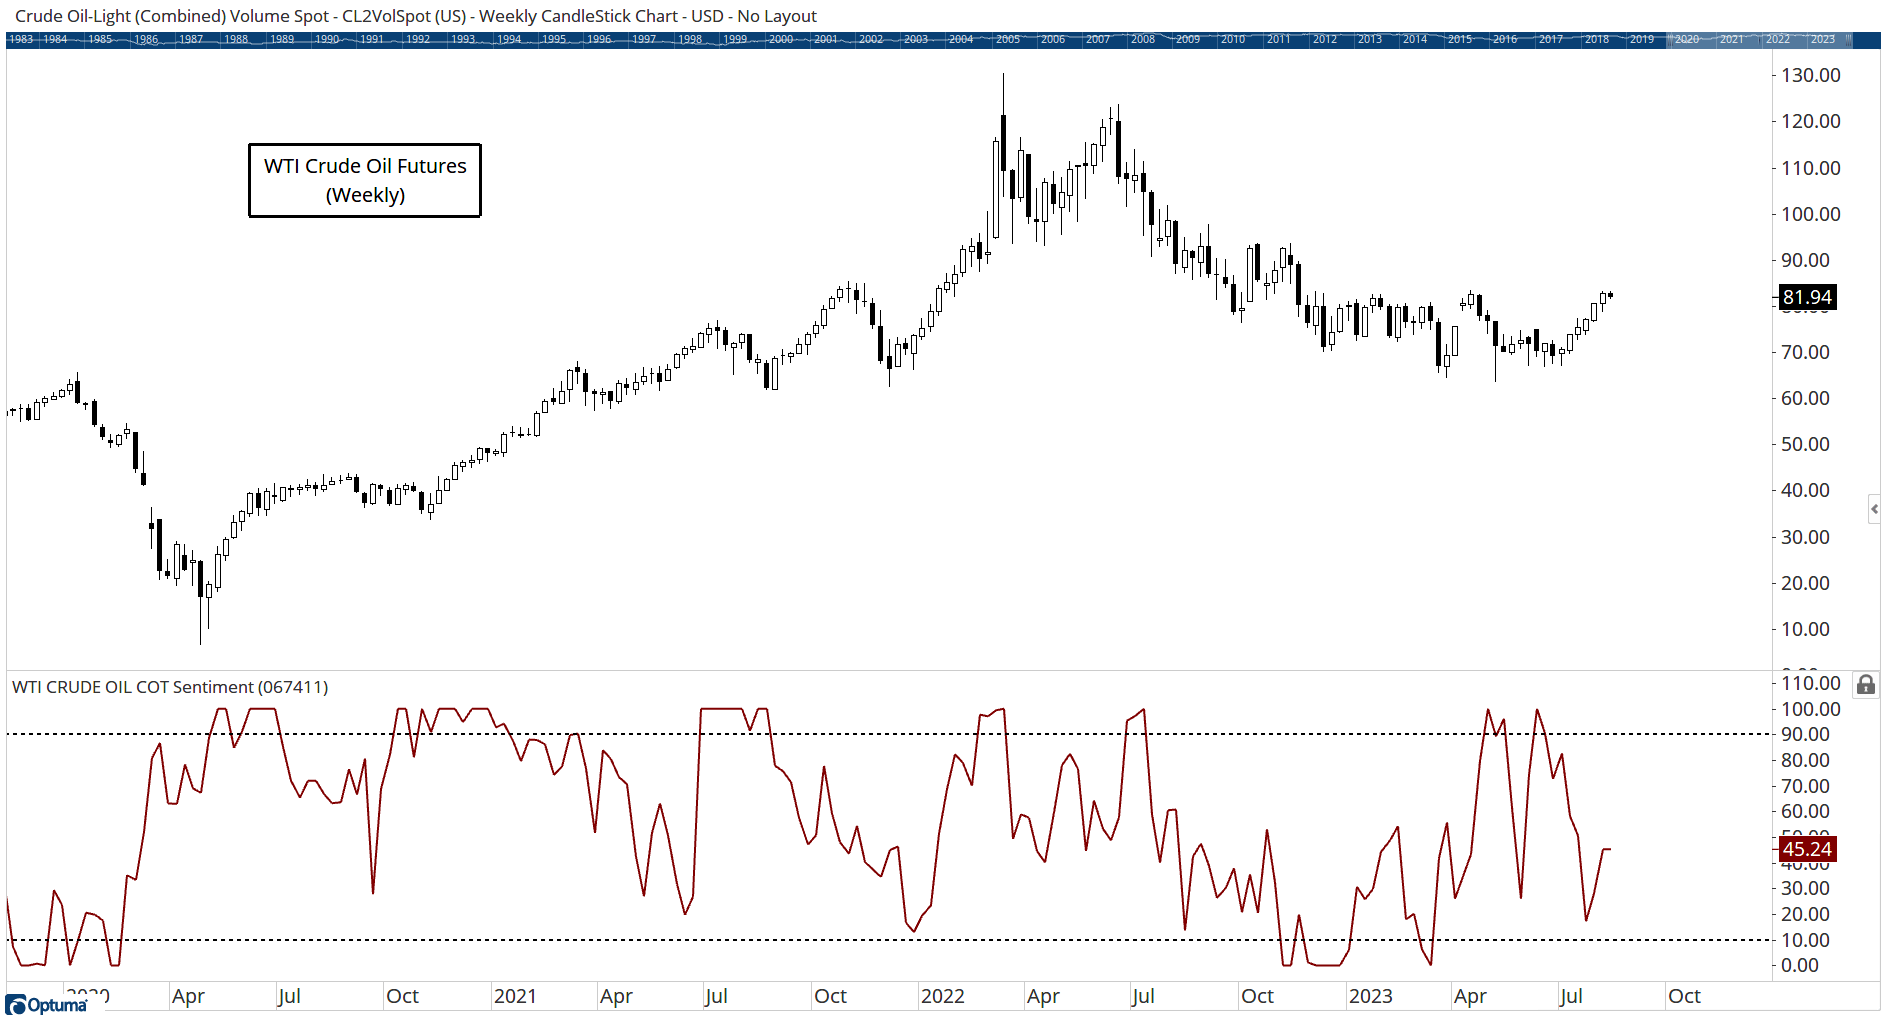
FIGURE 9: OPTUMA. This sample chart displays the 26-week COT sentiment indicator for WTI crude oil.
—support@optuma.com
BACK TO LIST

The Zorro Platform: October 2023
In his article in this issue, “Backwardation, Positioning, And Momentum: A Recipe For High-Conviction Trades” Alfred François Tagher discusses an indicator based on the Commitment Of Traders report. The indicator can be found in the Zorro Project library under the name COT_CommercialIndex. Following is a small test script:
void run()
{
   StartDate = 2020;
   EndDate = 2023;
   BarPeriod = 1440;
   PlotHeight2 = PlotHeight1;
   set(PLOTNOW);

   assetAdd("GOLD","YAHOO:GC=F");
   asset("GOLD");
   string COT_Code = "088691"; // gold COT report
   var ComNet = COT_CommercialPos(1,COT_Code);
   plot("Net Commercial",ComNet,NEW,RED);
   var COTCI = COT_CommercialIndex(1,COT_Code,26);
   plot("COT Index",COTCI,NEW,BLUE);
}
This script uses the net positions of commercial traders. In the COT report, it’s the fields “Producer/Merchant/Processor/User” and “Money Manager.” It applies a normalization filter, which in the article is the stochastic. The indicators access the COT report from the NASDAQ website. A resulting chart with gold futures is shown in Figure 10.
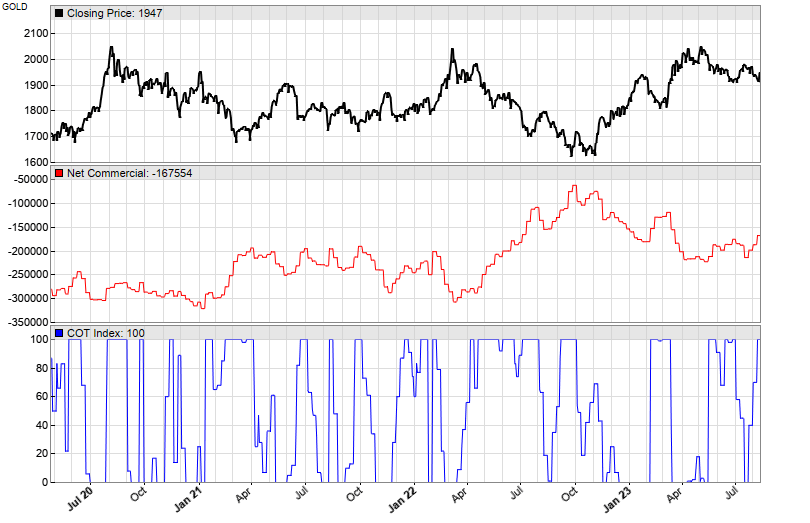
FIGURE 10: ZORRO. The indicator and the COT index are shown with a chart of gold futures.
The script can be downloaded from the 2023 script repository on https://financial-hacker.com. The Zorro platform for C/C++ algo trading can be downloaded from https://zorro-project.com.
—Petra Volkova
The Zorro Project by oP group Germany
https://zorro-project.com
BACK TO LIST
Originally published in the October 2023 issue of
Technical Analysis of STOCKS & COMMODITIES magazine.
All rights reserved. © Copyright 2023, Technical Analysis, Inc.


