TRADERS’ TIPS
November 2023

For this month’s Traders’ Tips, the focus is Scott Cong’s article in theSeptember issue, “VAcc: A Momentum Indicator Based On Velocity And Acceleration.” Here, we present the November 2023 Traders’ Tips code with possible implementations in various software.
You can right-click on any chart to open it in a new tab or window and view it at it’s originally supplied size, often much larger than the version printed in the magazine.
The Traders’ Tips section is provided to help the reader implement a selected technique from an article in this issue or another recent issue. The entries here are contributed by software developers or programmers for software that is capable of customization.

TradeStation: November 2023
In his article in the September 2023 issue titled “VAcc: A Momentum Indicator Based On Velocity And Acceleration,” author Scott Cong has introduced a new momentum indicator based on the simple physics principles of velocity and acceleration. The indicator is said to be responsive, precise, and easy to use. In addition, the indicator is said to be less susceptible to overbought/oversold saturation. The TradeStation implementation in EasyLangauge uses a VAcc function.
Function: VAcc

// TASC NOVEMBER 2023
// VAcc Function
// Scott Cong

inputs:
	iLength( numericsimple ),
	iSmooth( numericsimple ),
	iReturnType( numericsimple );

Variables:
	Length( iLength ),
	Avg_acc( 0 ),
	Avg_vel( 0 ),
	Sum_acc( 0 ),
	Sum_vel( 0 ),
	Idx( 0 ),
	Result( 0 );

Sum_vel = 0;

for Idx = 1 to Length
begin
    Sum_vel += (Close - Close[Idx]) / Idx;
end;

Avg_vel = XAverage(Sum_vel / Length, iSmooth);

Sum_acc = 0;

for Idx = 1 to Length
begin
    Sum_acc += (Avg_vel - Avg_vel[Idx]) / Idx;
end;

Avg_acc = Sum_acc / Length;

if iReturnType = 0 then
    Result = Avg_vel
else
    Result = Sum_acc;

VAcc = Result;


Indicator: VAcc

// TASC NOVEMBER 2023
// VAcc - Velocity (V) and Acceleration (Acc)
// Scott Cong

inputs:
	Period( 21 ),
	Smooth( 5 );

variables:
	AvgVel( 0 ),
	AvgAcc( 0 );

AvgVel = 100 * VAcc(Period, Smooth, 0);
AvgAcc = 100 * VAcc(Period, Smooth, 1);

Plot1( AvgVel / Period * 2, "VAcc" );
Plot2( 0, "Zero" );
A sample chart is shown in Figure 1.

FIGURE 1: TRADESTATION. A TradeStation daily chart of the NASDAQ 100 index ($NDX.X) shows 2023 with the indicator applied using inputs of 26 and 9.
This article is for informational purposes. No type of trading or investment recommendation, advice, or strategy is being made, given, or in any manner provided by TradeStation Securities or its affiliates.
—John Robinson
TradeStation Securities, Inc.
www.TradeStation.com
BACK TO LIST

Wealth-Lab.com: November 2023
The group of VAcc indicators discussed in the September 2023 S&C article by Scott Cong, “VAcc: A Momentum Indicator Based On Velocity And Acceleration,” have been added to Wealth-Lab 8, making them instantly available to any tools and extensions of the program. To make a choice between acceleration and velocity, simply choose either one from a dropdown when using the indicator.
You can easily create a trading system based on the VAcc indicators by using the Building Blocks feature of Wealth-Lab. For example, here, we take the “strong up” condition suggested in Cong’s article to create a trading system:
- Velocity rising (greater than its value on the previous bar)
- Velocity above zero
- Acceleration rising (greater than its value on the previous bar)
- Acceleration above zero
The screenshot in Figure 2 shows building the demo system using Building Blocks.
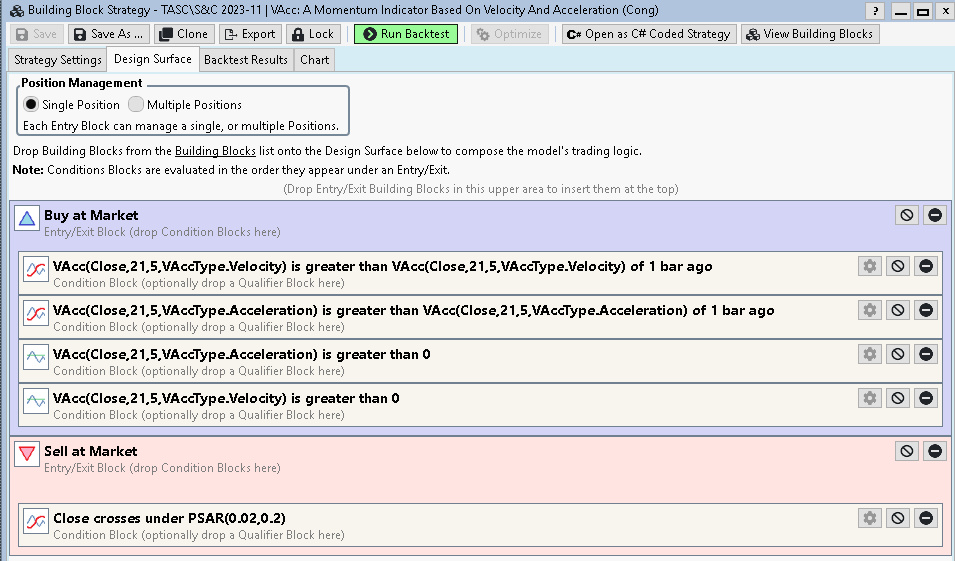
FIGURE 2: WEALTH-LAB. An outline of the system’s trading logic is expressed using Conditions Blocks in the Wealth-Lab Building Blocks feature.
With its default inputs suitable for swing trading, the VAcc can be used the same way as the stochastic oscillator. For the long exit, we took the familiar parabolic indicator. If the close price crosses under the SAR, the long position is closed at market next bar.
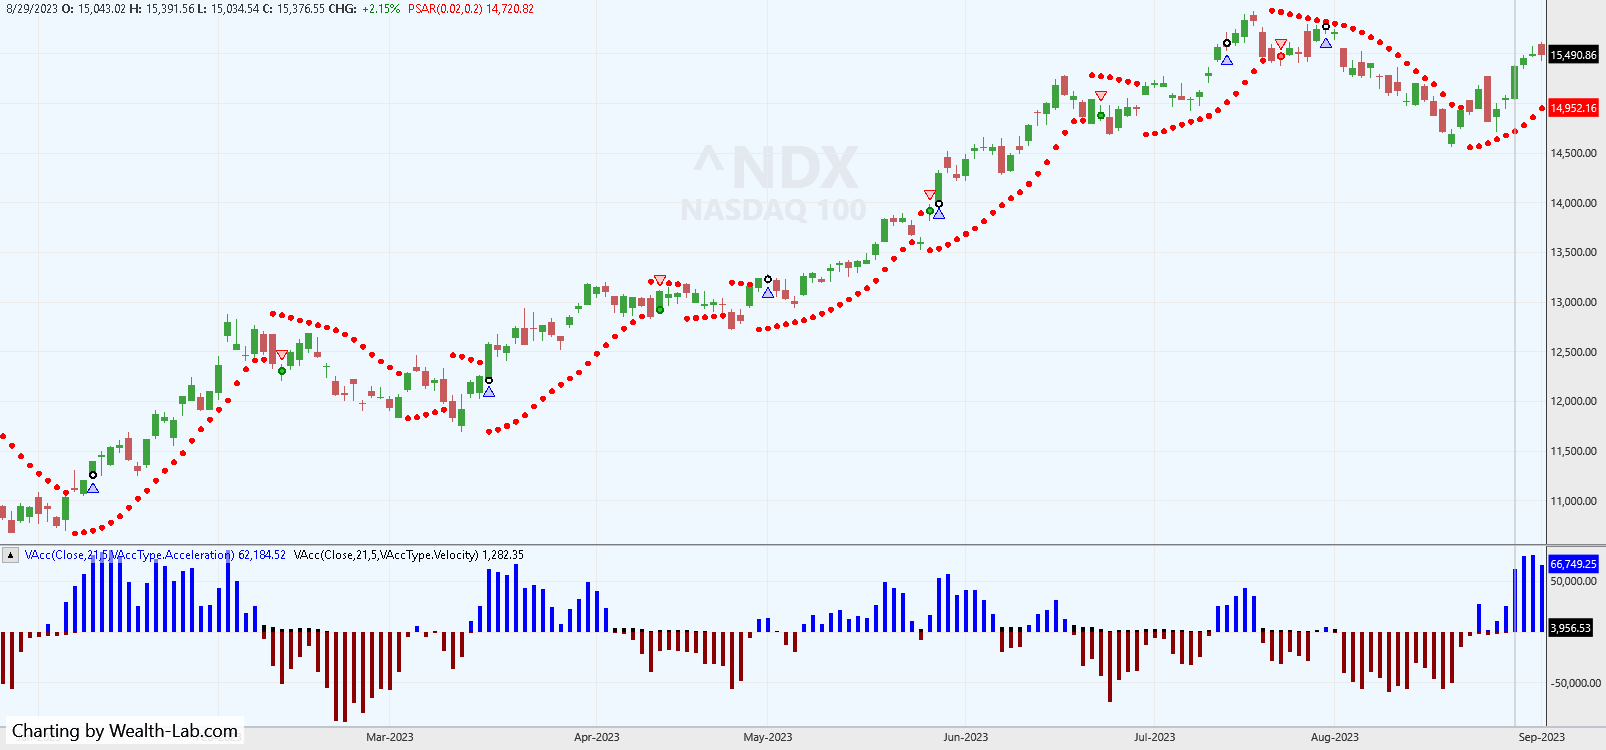
FIGURE 3: WEALTH-LAB. Some exemplary trades can be seen in this example. Data provided by Yahoo! Finance.
—Gene Geren (Eugene)
Wealth-Lab team
www.wealth-lab.com
BACK TO LIST

NinjaTrader: November 2023
The VAcc indicator, which was introduced in the article “VAcc: A Momentum Indicator Based On Velocity And Acceleration” by Scott Cong in the September 2023 issue of S&C, is available for download at the following link for NinjaTrader 8:
Once the file is downloaded, you can import the indicator into NinjaTrader 8 from within the control center by selecting Tools → Import → NinjaScript Add-On and then selecting the downloaded file for NinjaTrader 8.
You can review the indicator source code in NinjaTrader 8 by selecting the menu New → NinjaScript Editor → Indicators folder from within the control center window and selecting the file.
A sample chart displaying the indicator is shown in Figure 4.

FIGURE 4: NINJATRADER. A daily chart of the September 2023 Micro E-Mini S&P 500 futures contract (MES) is shown with the VAcc indicator (21,5).
NinjaScript uses compiled DLLs that run native, not interpreted, to provide you with the highest performance possible.
—NinjaTrader, LLC
www.ninjatrader.com
BACK TO LIST

TradingView: November 2023
Here is TradingView Pine Script code implementing the VAcc indicator presented in the September 2023 article by Scott Cong titled “VAcc: A Momentum Indicator Based On Velocity And Acceleration.”
//  TASC Issue: November 2023 - Vol. 41, Issue 12
//     Article: VAcc: A Momentum Indicator
//              Based On Velocity And Acceleration
//  Article By: Scott Cong
//    Language: TradingView's Pine Script® v5
// Provided By: PineCoders, for tradingview.com


//@version=5
string title = 'TASC 2023.10 VAcc'
string stitle = 'VAcc'
indicator(title, stitle, false)


string G01 = 'Parameters Configuration:'
string T00 = 'Source Series:'
string T01 = 'Sample Period:'
string T02 = 'EMA Smoothing:'
string T03 = 'Scale Factor:'
string G02 = 'Stype Configuration:'
string T04 = 'Histogram:'
string T05 = 'Velocity:'
string T06 = 'Display Bands?'
float src   = input.source(    close, T00, group=G01)
int length1 = input.int(          26, T01, group=G01)
int length2 = input.int(           9, T02, group=G01)
float scale_factor = input.float(0.5, T03, group=G01)
color cHUP = input.color(#ff5252  , T04, '', 'H', G02)
color cHDO = input.color(#2196f3  ,  '', '', 'H', G02)
color cV1  = input.color(#f13709e7, T05, '', 'V', G02)
color cV2  = input.color(#e2c2344d,  '', '', 'V', G02)
bool showb = input.bool(false, T06, '', '', G02)


// @function Relatively weighted average were the nearer
//  price has the largest influence.
// @param src       Series to be averaged.
// @param length    Length of the sample.
// @returns Averaged value of the sampled series.
weighted_avg (float src, int length) =>
    float sum = 0.0
    for _i = 1 to length
        float diff = (src - src[_i]) / _i
        sum += diff
    sum /= length


// @function Calculate Velocity and Acceleration.
// @param src       Series to be averaged.
// @param period    Length of the sample.
// @param smoothing Length of the Smoothing.
// @returns Tuple with Velocity and Acceleration.
VAcc (float src, int period, int smoothing) =>
    float vel = ta.ema(weighted_avg(src, period), smoothing)
    float acc = weighted_avg(vel, period)
    [100.0*vel, 100.0*acc]


[av, acc] = VAcc(src, length1, length2)
av /= (length1 * scale_factor)


PSH = plot.style_histogram
hist_col = acc >= 0.0 ? cHUP : cHDO


plot(acc, 'Avg. Acceleration', hist_col, 2, PSH)
plot(av  , 'Avg. Velocity', cV2, 5)
plot(av  , 'Avg. Velocity', cV2, 3)
plot(av  , 'Avg. Velocity', cV1, 1)
hline(0)


float upper = av
float lower = av
switch
    av > 0 => upper += (nz(upper[1], 0.0) - av) * 0.5
    => upper := nz(upper[1])
switch
    av < 0 => lower += (nz(lower[1], .0) - av) * 0.5
    => lower := nz(lower[1])
upband = ta.highest(ta.ema(upper, length2), length1)
doband = ta.lowest(ta.ema(lower, length2), length1)


display_b = showb ? display.all : display.none
plot(upband, 'Upper Band', #787b8699, display=display_b)
plot(doband, 'Lower Band', #787b8699, display=display_b)
The indicator is available on TradingView from the PineCodersTASC account: https://www.tradingview.com/u/PineCodersTASC/#published-scripts
An example chart is shown in Figure 5.
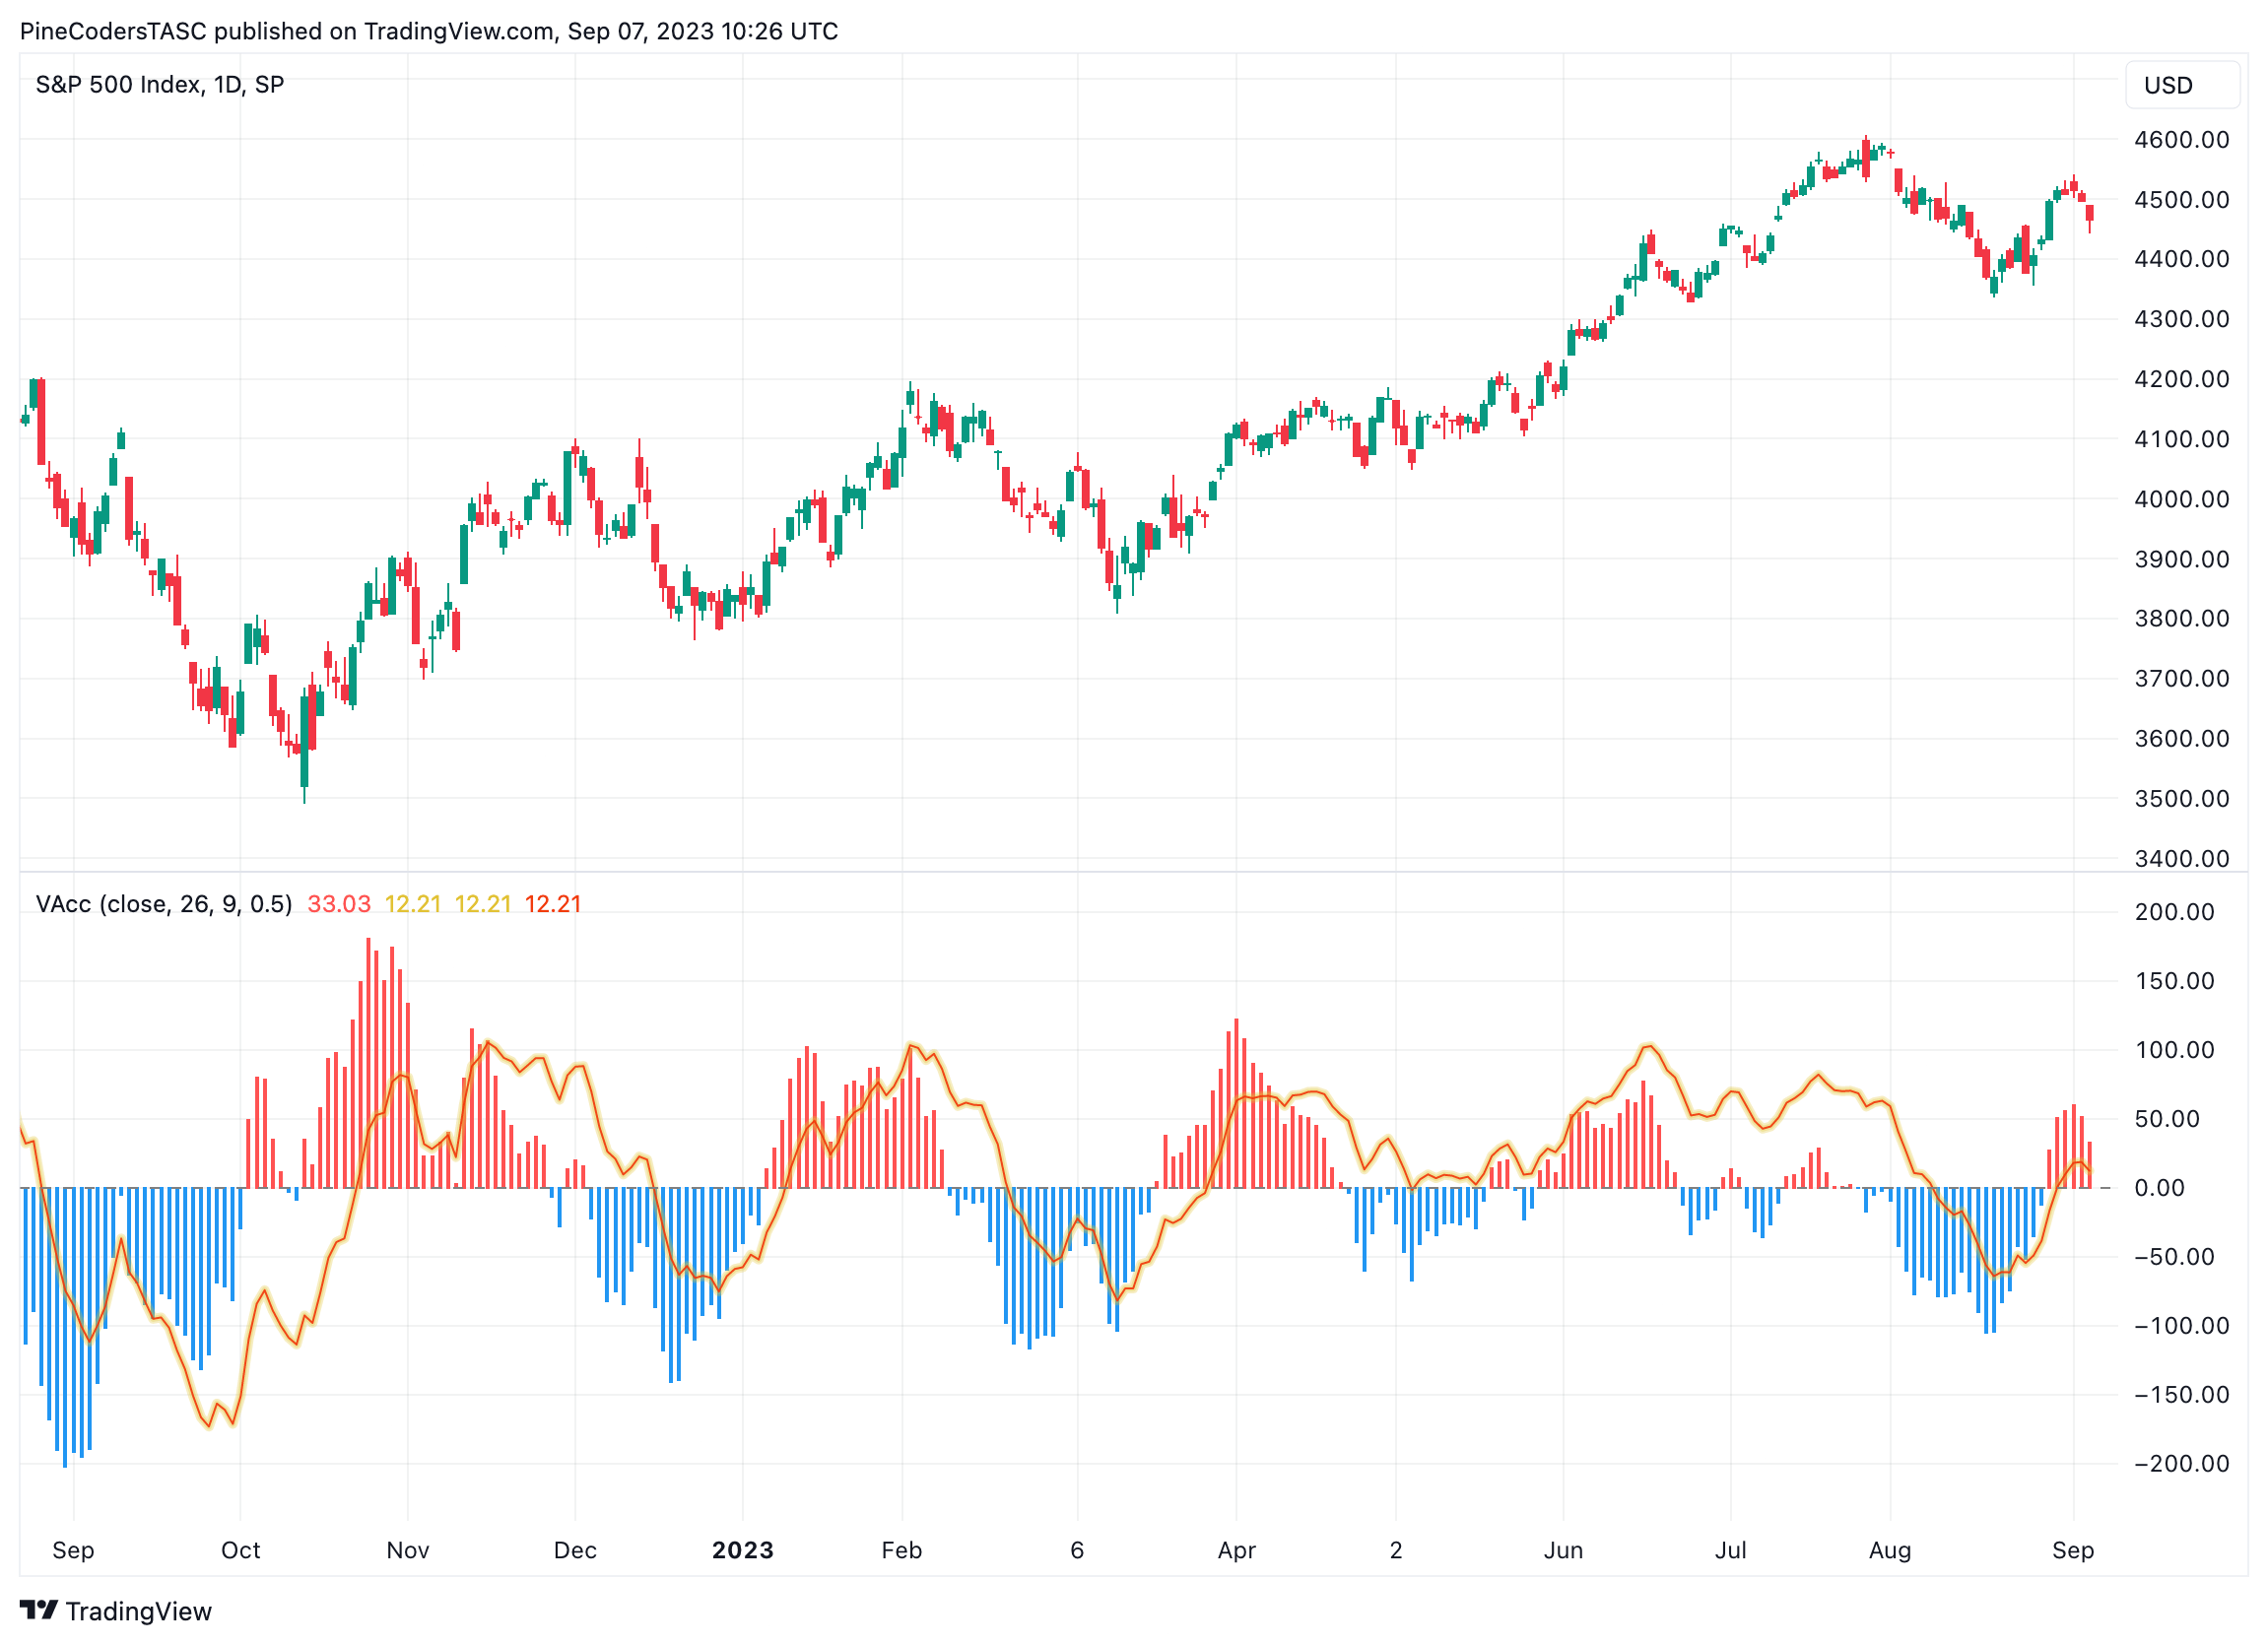
FIGURE 5: TRADINGVIEW. The VAcc indicator is plotted on a daily chart of the S&P 500 index.
—PineCoders, for TradingView
www.TradingView.com
BACK TO LIST
MetaQuotes: November 2023
Here is code for use in MetaQuotes based on the article in the September 2023 issue of S&C, “VAcc: A Momentum Indicator Based On Velocity And Acceleration” by Scott Cong.
Figures 6 and 7 show the process of setting up the indicator in MetaQuotes and Figure 8 shows an example of the VAcc indicator plotted on a daily chart of EURUSD.
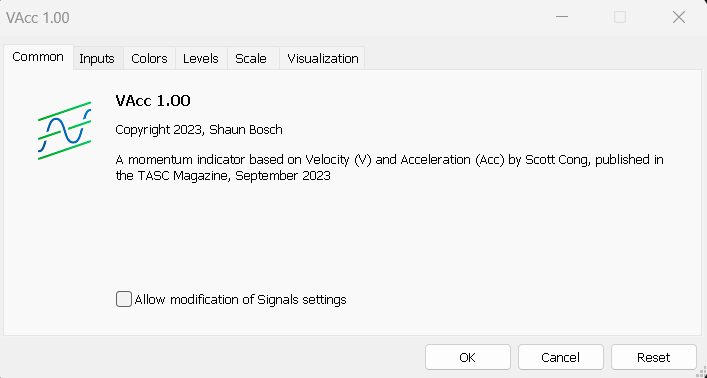
FIGURE 6: METAQUOTES, COMMON TAB. The VAcc indicator is created in MetaQuotes.
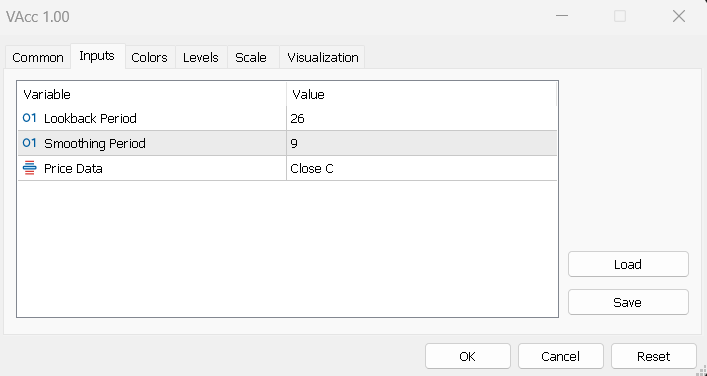
FIGURE 7: METAQUOTES, INPUTS TAB. Here, the VAcc indicator is set up in MetaQuotes using the inputs tab to input a lookback period of 26 and a smoothing period of 9.
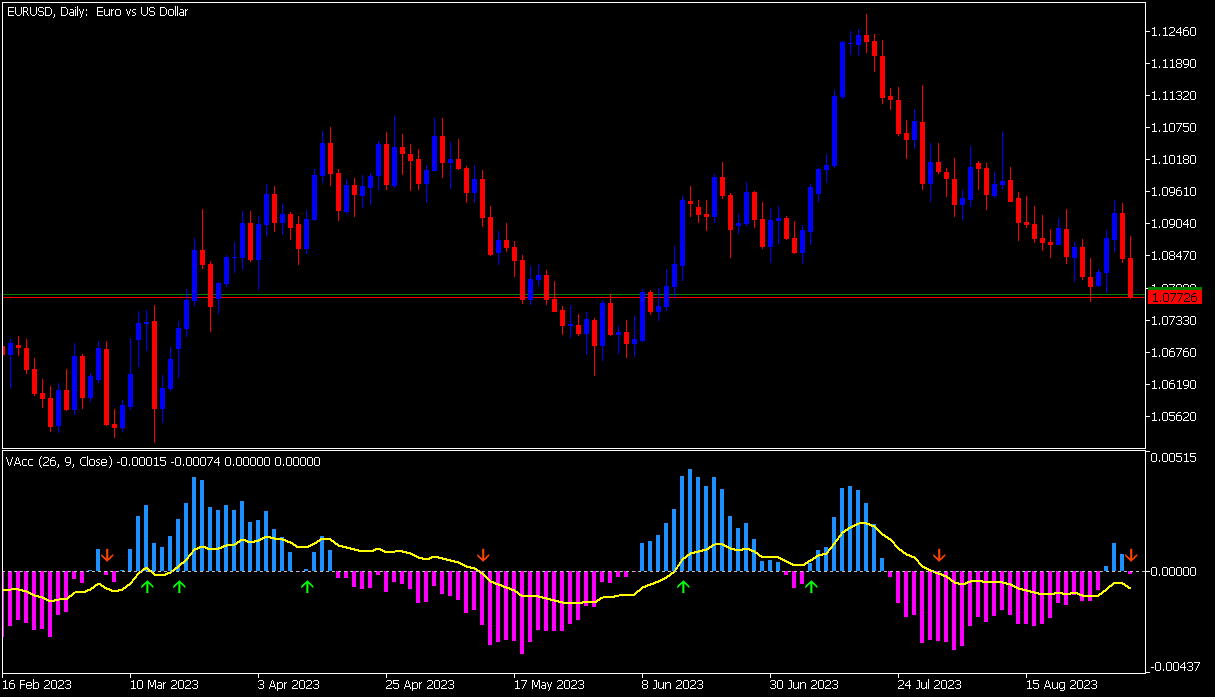
FIGURE 8: METAQUOTES. This demonstrates the VAcc (26,9) indicator plotted on a daily chart of EURUSD.
The code is shown here:
//+------------------------------------------------------------------+
//|                                                         VAcc.mq5 |
//|                                      Copyright 2023, Shaun Bosch |
//|                                              shadavbos@gmail.com |
//+------------------------------------------------------------------+
#property copyright "Copyright 2023, Shaun Bosch"
#property link      "shadavbos@gmail.com"
#property version   "1.00"
#property description   "A momentum indicator based on Velocity (V) and Acceleration (Acc) by Scott Cong, published in the TASC Magazine, September 2023"
#property indicator_separate_window
#property indicator_buffers 10
#property indicator_plots   4
#property indicator_level1  0
//--- plot Acceleration
#property indicator_label1  "Acceleration"
#property indicator_type1   DRAW_COLOR_HISTOGRAM
#property indicator_color1  clrDodgerBlue,clrMagenta
#property indicator_style1  STYLE_SOLID
#property indicator_width1  5
//--- plot Velocity
#property indicator_label2  "Velocity"
#property indicator_type2   DRAW_LINE
#property indicator_color2  clrYellow
#property indicator_style2  STYLE_SOLID
#property indicator_width2  2
//--- plot Buy Signal
#property indicator_label3  "Buy Signal"
#property indicator_type3   DRAW_ARROW
#property indicator_color3  clrLime
#property indicator_style3  STYLE_SOLID
#property indicator_width3  1
//--- plot Sell Signal
#property indicator_label4  "Sell Signal"
#property indicator_type4   DRAW_ARROW
#property indicator_color4  clrOrangeRed
#property indicator_style4  STYLE_SOLID
#property indicator_width4  1
//--- enumerations
enum ENUM_RATES_LIST
  {
   RATES_OPEN,                   // Open O
   RATES_HIGH,                   // High H
   RATES_LOW,                    // Low L
   RATES_CLOSE,                  // Close C
   RATES_MEDIAN,                 // Median (H+L)/2
   RATES_TYPICAL,                // Typical (H+L+C)/3
   RATES_WEIGHTED,               // Weighted (H+L+C+C)/4
   RATES_AVERAGE,                // Average (O+H+L+C)/4
   RATES_MEDIAN_BODY,            // Median Body (O+C)/2
   RATES_TREND_BIAS,             // Trend Bias if C > O then (H+C)/2 else (L+C)/2
   RATES_EXTREME_TREND_BIAS,     // Extreme Trend Bias if C > O then H else L
   RATES_HA_OPEN,                // Heikin-Ashi Open HAO
   RATES_HA_HIGH,                // Heikin-Ashi High HAH
   RATES_HA_LOW,                 // Heikin-Ashi Low HAL
   RATES_HA_CLOSE,               // Heikin-Ashi Close HAC
   RATES_HA_MEDIAN,              // Heikin-Ashi Median (HAH+HAL)/2
   RATES_HA_TYPICAL,             // Heikin-Ashi Typical (HAH+HAL+HAC)/3
   RATES_HA_WEIGHTED,            // Heikin-Ashi Weighted (HAH+HAL+HAC+HAC)/4
   RATES_HA_AVERAGE,             // Heikin-Ashi Average (HAO+HAH+HAL+HAC)/4
   RATES_HA_MEDIAN_BODY,         // Heikin-Ashi Median Body (HAO+HAC)/2
   RATES_HA_TREND_BIAS,          // Heikin-Ashi Trend Bias if HAC > HAO then (HAH+HAC)/2 else (HAL+HAC)/2
   RATES_HA_EXTREME_TREND_BIAS   // Heikin-Ashi Extreme Trend Bias if HAC > HAO then HAH else HAL
  };
//--- input parameters
input int                  inp_period              = 26;                   // Lookback Period
input int                  inp_smooth              = 9;                    // Smoothing Period
input ENUM_RATES_LIST      inp_rates               = RATES_CLOSE;          // Price Data
//--- indicator buffers
double                     histo_plot[];
double                     histo_color[];
double                     line_plot[];
double                     buy_signal[];
double                     sell_signal[];
double                     rates[];
double                     temp1[], temp2[], temp3[], temp4[];
//--- indicator variables
int                        period;
int                        smooth;
//+------------------------------------------------------------------+
//| Custom indicator initialization function                         |
//+------------------------------------------------------------------+
int OnInit()
  {
//--- verify input parameters
   period = inp_period < 1 ? 1 : inp_period;
   smooth = inp_smooth < 1 ? 1 : inp_smooth;
//--- indicator buffers mapping
   SetIndexBuffer(0, histo_plot, INDICATOR_DATA);
   SetIndexBuffer(1, histo_color, INDICATOR_COLOR_INDEX);
   SetIndexBuffer(2, line_plot, INDICATOR_DATA);
   SetIndexBuffer(3, buy_signal, INDICATOR_DATA);
   SetIndexBuffer(4, sell_signal, INDICATOR_DATA);
   SetIndexBuffer(5, rates, INDICATOR_CALCULATIONS);
   SetIndexBuffer(6, temp1, INDICATOR_CALCULATIONS);
   SetIndexBuffer(7, temp2, INDICATOR_CALCULATIONS);
   SetIndexBuffer(8, temp3, INDICATOR_CALCULATIONS);
   SetIndexBuffer(9, temp4, INDICATOR_CALCULATIONS);
//--- setting a code from the Wingdings chartset as the property of PLOT_ARROW
   PlotIndexSetInteger(2, PLOT_ARROW, 225);
   PlotIndexSetInteger(3, PLOT_ARROW, 226);
//--- set vertical shift of arrows in pixels
   PlotIndexSetInteger(2, PLOT_ARROW_SHIFT, 15);
   PlotIndexSetInteger(3, PLOT_ARROW_SHIFT, -15);
//--- accuracy of drawing of indicator values
   IndicatorSetInteger(INDICATOR_DIGITS, _Digits);
//--- set indicator name display
   string rates_name = inp_rates == RATES_OPEN ? "Open" : inp_rates == RATES_HIGH ? "High" : inp_rates == RATES_LOW ? "Low" : inp_rates == RATES_CLOSE ? "Close" : inp_rates == RATES_MEDIAN ? "Median" : inp_rates == RATES_TYPICAL ? "Typical" : inp_rates == RATES_WEIGHTED ? "Weighted" : inp_rates == RATES_AVERAGE ? "Average" : inp_rates == RATES_MEDIAN_BODY ? "Median Body" : inp_rates == RATES_TREND_BIAS ? "Trend Bias" : inp_rates == RATES_EXTREME_TREND_BIAS ? "Extreme Trend Bias" : inp_rates == RATES_HA_OPEN ? "HA Open" : inp_rates == RATES_HA_HIGH ? "HA High" : inp_rates == RATES_HA_LOW ? "HA Low" : inp_rates == RATES_HA_CLOSE ? "HA Close" : inp_rates == RATES_HA_MEDIAN ? "HA Median" : inp_rates == RATES_HA_TYPICAL ? "HA Typical" : inp_rates == RATES_HA_WEIGHTED ? "HA Weighted" : inp_rates == RATES_HA_AVERAGE ? "HA Average" : inp_rates == RATES_HA_MEDIAN_BODY ? "HA Median Body" : inp_rates == RATES_HA_TREND_BIAS ? "HA Trend Bias" : inp_rates == RATES_HA_EXTREME_TREND_BIAS ? "HA Extreme Trend Bias" : " ";
   string short_name = "VAcc (" + IntegerToString(period) + ", " + IntegerToString(smooth) + ", " + rates_name + ")";
   IndicatorSetString(INDICATOR_SHORTNAME, short_name);
//--- an empty value for plotting, for which there is no drawing
   PlotIndexSetDouble(0, PLOT_EMPTY_VALUE, EMPTY_VALUE);
   PlotIndexSetDouble(1, PLOT_EMPTY_VALUE, EMPTY_VALUE);
   PlotIndexSetDouble(2, PLOT_EMPTY_VALUE, EMPTY_VALUE);
   PlotIndexSetDouble(3, PLOT_EMPTY_VALUE, EMPTY_VALUE);
//--- successful initialization
   return(INIT_SUCCEEDED);
  }
//+------------------------------------------------------------------+
//| Custom indicator iteration function                              |
//+------------------------------------------------------------------+
int OnCalculate(const int rates_total,
                const int prev_calculated,
                const datetime &time[],
                const double &open[],
                const double &high[],
                const double &low[],
                const double &close[],
                const long &tick_volume[],
                const long &volume[],
                const int &spread[])
  {
//--- populate rates buffers
   fu_RATES(rates_total, prev_calculated, inp_rates, open, high, low, close, temp1, temp2, temp3, temp4, rates);
//--- populate VAcc buffers
   wi_VAcc(rates_total, prev_calculated, period, smooth, rates, line_plot, histo_plot);
//--- bar index start
   int bar_index;
   if(prev_calculated == 0)
      bar_index = 0;
   else
      bar_index = prev_calculated - 1;
//--- main loop
   for(int i = bar_index; i < rates_total && !_StopFlag; i++)
     {
      if(i < 2 * period)
        {
         histo_plot[i] = EMPTY_VALUE;
         histo_color[i] = EMPTY_VALUE;
         line_plot[i] = EMPTY_VALUE;
         buy_signal[i] = EMPTY_VALUE;
         sell_signal[i] = EMPTY_VALUE;
        }
      else
        {
         histo_color[i] = histo_plot[i] > 0.0 ? 0.0 : 1.0;
         buy_signal[i] = histo_plot[i] > 0.0 && line_plot[i] > 0.0 && (histo_plot[i - 1] < 0.0 || line_plot[i - 1] < 0.0) ? fmin(histo_plot[i], fmin(line_plot[i], 0.0)) : EMPTY_VALUE;
         sell_signal[i] = histo_plot[i] < 0.0 && line_plot[i] < 0.0 && (histo_plot[i - 1] > 0.0 || line_plot[i - 1] > 0.0) ? fmax(histo_plot[i], fmax(line_plot[i], 0.0)) : EMPTY_VALUE;
        }
     }
//--- return value of prev_calculated for next call
   return(rates_total);
  }
//+------------------------------------------------------------------+
//| Get Rates from ENUM_RATES_LIST (RATES)                           |
//+------------------------------------------------------------------+
//           //--- System bar_index references:
int fu_RATES(const int rates_total,
             const int prev_calculated,
             //--- Input variables and arrays:
             const ENUM_RATES_LIST rates_list,
             const double &open[], // Open Price
             const double &high[], // High Price
             const double &low[], // Low Price
             const double &close[], // Close Price
             //--- Calculation arrays (4):
             double &ha_open[],
             double &ha_high[],
             double &ha_low[],
             double &ha_close[],
             //--- Output arrays:
             double &result[])
  {
//--- bar index start
   int bar_index;
   if(prev_calculated == 0)
      bar_index = 0;
   else
      bar_index = prev_calculated - 1;
//--- main loop
   for(int i = bar_index; i < rates_total && !_StopFlag; i++)
     {
      ha_close[i] = (open[i] + high[i] + low[i] + close[i]) / 4.0;
      ha_open[i] = i < 1 ? (open[i] + close[i]) / 2.0 : (ha_open[i - 1] + ha_close[i - 1]) / 2.0;
      ha_high[i] = fmax(high[i], fmax(ha_open[i], ha_close[i]));
      ha_low[i] = fmin(low[i], fmin(ha_open[i], ha_close[i]));
      switch(rates_list)
        {
         case RATES_OPEN:
            result[i] = open[i];
            break;
         case RATES_HIGH:
            result[i] = high[i];
            break;
         case RATES_LOW:
            result[i] = low[i];
            break;
         case RATES_CLOSE:
            result[i] = close[i];
            break;
         case RATES_MEDIAN:
            result[i] = (high[i] + low[i]) / 2.0;
            break;
         case RATES_TYPICAL:
            result[i] = (high[i] + low[i] + close[i]) / 3.0;
            break;
         case RATES_WEIGHTED:
            result[i] = (high[i] + low[i] + close[i] + close[i]) / 4.0;
            break;
         case RATES_AVERAGE:
            result[i] = (open[i] + high[i] + low[i] + close[i]) / 4.0;
            break;
         case RATES_MEDIAN_BODY:
            result[i] = (open[i] + close[i]) / 2.0;
            break;
         case RATES_TREND_BIAS:
            if(close[i] > open[i])
               result[i] = (high[i] + close[i]) / 2.0;
            else
               result[i] = (low[i] + close[i]) / 2.0;
            break;
         case RATES_EXTREME_TREND_BIAS:
            if(close[i] > open[i])
               result[i] = high[i];
            else
               result[i] = low[i];
            break;
         case RATES_HA_OPEN:
            result[i] = ha_open[i];
            break;
         case RATES_HA_HIGH:
            result[i] = ha_high[i];
            break;
         case RATES_HA_LOW:
            result[i] = ha_low[i];
            break;
         case RATES_HA_CLOSE:
            result[i] = ha_close[i];
            break;
         case RATES_HA_MEDIAN:
            result[i] = (ha_high[i] + ha_low[i]) / 2.0;
            break;
         case RATES_HA_TYPICAL:
            result[i] = (ha_high[i] + ha_low[i] + ha_close[i]) / 3.0;
            break;
         case RATES_HA_WEIGHTED:
            result[i] = (ha_high[i] + ha_low[i] + ha_close[i] + ha_close[i]) / 4.0;
            break;
         case RATES_HA_AVERAGE:
            result[i] = (ha_open[i] + ha_high[i] + ha_low[i] + ha_close[i]) / 4.0;
            break;
         case RATES_HA_MEDIAN_BODY:
            result[i] = (ha_open[i] + ha_close[i]) / 2.0;
            break;
         case RATES_HA_TREND_BIAS:
            if(ha_close[i] > ha_open[i])
               result[i] = (ha_high[i] + ha_close[i]) / 2.0;
            else
               result[i] = (ha_low[i] + ha_close[i]) / 2.0;
            break;
         case RATES_HA_EXTREME_TREND_BIAS:
            if(ha_close[i] > ha_open[i])
               result[i] = ha_high[i];
            else
               result[i] = ha_low[i];
            break;
        }
     }
   return(rates_total);
  }
//+------------------------------------------------------------------+
//| Velocity and Acceleration (VAcc)                                 |
//+------------------------------------------------------------------+
//          //--- system bar_index references:
int wi_VAcc(const int rates_total,
            const int prev_calculated,
            //--- input variables and arrays:
            const int prd, // Lookback Period (min val: 1; default val: 26)
            const int smth, // Smoothing Period (min val: 1; default val: 9)
            const double &src[], // Price Data
            //--- output arrays (2):
            double &result_vel[],
            double &result_acc[])
  {
//--- bar index start
   int bar_index;
   if(prev_calculated == 0)
      bar_index = 0;
   else
      bar_index = prev_calculated - 1;
//--- main loop
   for(int i = bar_index; i < rates_total && !_StopFlag; i++)
     {
      if(i < prd)
        {
         result_vel[i] = 0.0;
         result_acc[i] = 0.0;
        }
      if(i >= prd)
        {
         double sum_vel = 0.0;
         for(int j = 1; j < prd; j++)
            sum_vel += (src[i] - src[i - j]) / double(j);
         double alpha = 2.0 / (1.0 + double(smth));
         result_vel[i] = (sum_vel / double(prd)) * alpha + result_vel[i - 1] * (1.0 - alpha);
         result_acc[i] = 0.0;
        }
      if(i >= 2 * prd)
        {
         double sum_acc = 0.0;
         for(int j = 1; j < prd; j++)
            sum_acc += (result_vel[i] - result_vel[i - j]) / double(j);
         result_acc[i] = sum_acc;
        }
     }
   return(rates_total);
  }
//+------------------------------------------------------------------+
—Shaun Bosch
shadavbos@gmail.com
BACK TO LIST

NeuroShell Trader: November 2023
The VAcc momentum indicator that was presented in Scott Cong’s September 2023 S&C article, “VAcc: A Momentum Indicator Based On Velocity And Acceleration,” can be easily implemented in NeuroShell Trader using NeuroShell Trader’s ability to call external dynamic linked libraries. Dynamic linked libraries can be written in C, C++, or Power Basic.
After moving the code given in the article to your preferred compiler and creating a DLL, you can insert the resulting indicator as follows:
- Select “new indicator” from the insert menu.
- Choose the External Program & Library Calls category.
- Select the appropriate External DLL Call indicator.
- Set up the parameters to match your DLL.
- Select the finished button.
A sample chart is shown in Figure 9.

FIGURE 9: NEUROSHELL TRADER. This NeuroShell Trader chart shows the VAcc and acceleration applied to the S&P 500 index.
Users of NeuroShell Trader can go to the Stocks & Commodities section of the NeuroShell Trader free technical support website to download a copy of this or any previous Traders’ Tips.
—Ward Systems Group, Inc.
sales@wardsystems.com
www.neuroshell.com
BACK TO LIST

The Zorro Project: November 2023
Scott Cong’s article in the September 2023 issue of S&C titled “VAcc: A Momentum Indicator Based On Velocity And Acceleration” presented a momentum indicator based on price velocity and acceleration. It returns either the average velocity or the average acceleration. Here’s the indicator code converted to C for the Zorro platform:
var VACC(int Length, var EMA_Smooth, int Return_type )
{
  var Sum_vel = 0;
  int i;
  for(i = 1; i <= Length; i++)
// Calculate speed for each bar
    Sum_vel += (priceC(0) - priceC(i)) / i;
  var Avg_vel = EMA(Sum_vel/Length, EMA_Smooth);
  if(Return_type == 0) return Avg_vel;
  vars Avg_vels = series(Avg_vel);
  var Sum_acc = 0;
  for(i = 1; i <= Length; i++)
    Sum_acc += (Avg_vel - Avg_vels[i]) / i;
  return Sum_acc / Length;
}
Figure 10 shows the VAcc(10,0.1,0) applied on a chart of SPY.
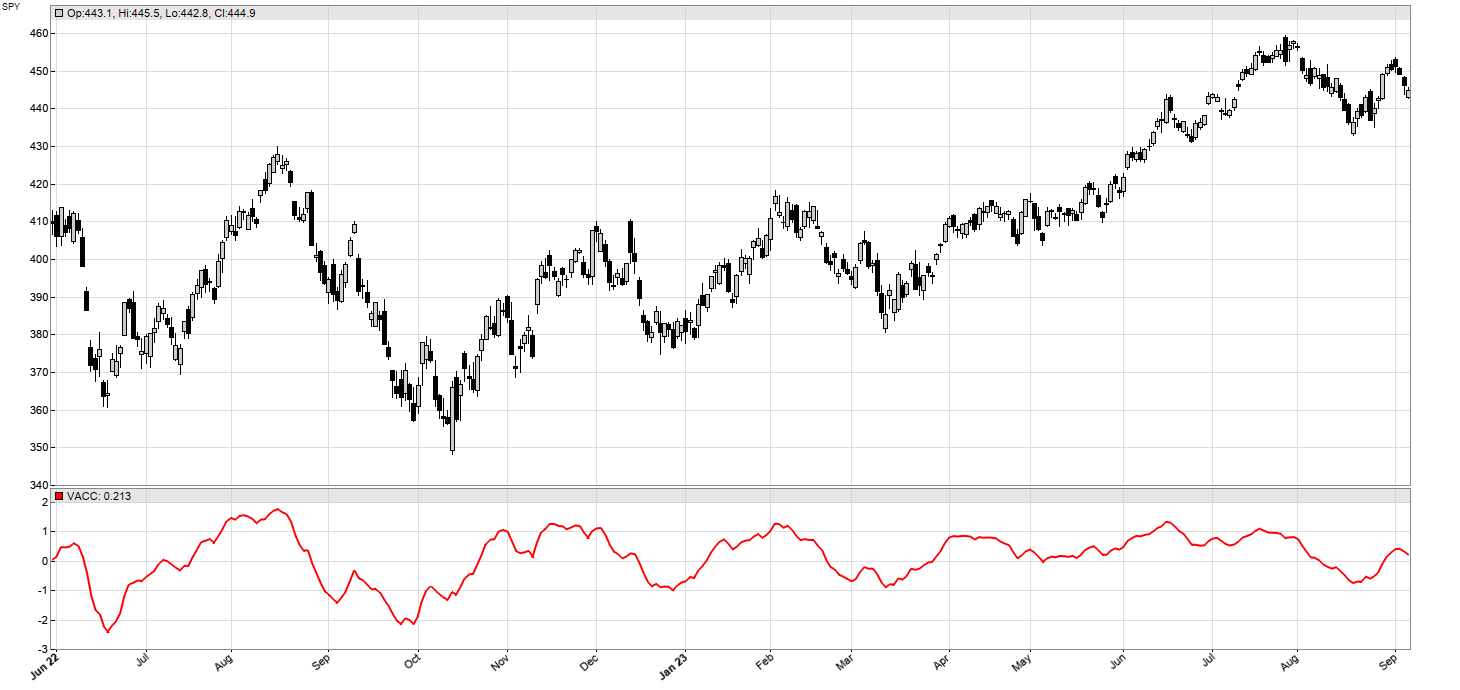
FIGURE 10: ZORRO. The VAcc(10,0.1,0) is applied on a chart of SPY.
The VACC indicator and the trading system can be downloaded from the 2023 script repository on https://financial-hacker.com. The Zorro platform for C/C++ algo trading can be downloaded from https://zorro-project.com.
—Petra Volkova
The Zorro Project by oP group Germany
https://zorro-project.com
BACK TO LIST
Microsoft Excel: November 2023
In his article in the September 2023 issue of S&C, “VAcc: A Momentum Indicator Based On Velocity And Acceleration,” Scott Cong develops two new indicators, the average velocity and average acceleration, inspired by MACD.
He then walks us through the situations where VAcc parameter settings make the results similar to either the MACD or the stochastics indicators. He points out potential advantages over the MACD and the stochastics indicators.
With a couple of helper columns and an algebraic rearrangement of Cong’s equations (see the Notes tab), the required looping can be performed in the column cell formulas using Excel’s built-in functions OFFSET, SUM, and SUMPRODUCT. See Figure 11.

FIGURE 10: EXCEL. Here, the VAcc (26,9) along with velocity and acceleration are applied to a daily NASDAQ-100 chart. The pane at left shows some of the user controls.
To download this spreadsheet: The spreadsheet file for this Traders’ Tip can be downloaded here. To successfully download it, follow these steps:
- Right-click on the Excel file link, then
- Select “save as” (or “save target as”) to place a copy of the spreadsheet file on your hard drive.
—Ron McAllister
Excel and VBA programmer
rpmac_xltt@sprynet.com
BACK TO LIST
Originally published in the November 2023 issue of
Technical Analysis of STOCKS & COMMODITIES magazine.
All rights reserved. © Copyright 2023, Technical Analysis, Inc.


