TRADERS’ TIPS
January 2024
For this month’s Traders’ Tips, the focus is Perry J. Kaufman’s article in this issue, “Gap Momentum.” Here, we present the January 2024 Traders’ Tips code with possible implementations in various software.
You can right-click on any chart to open it in a new tab or window and view it at it’s originally supplied size, often much larger than the version printed in the magazine.
The Traders’ Tips section is provided to help the reader implement a selected technique from an article in this issue or another recent issue. The entries here are contributed by software developers or programmers for software that is capable of customization.

TradeStation: January 2024
In his article in this issue, “Gap Momentum,” Perry Kaufman explores using opening gap data to create a momentum strategy, drawing inspiration from J. Welles Wilder as well as from Joseph Granville’s on-balance volume (OBV), by accumulating positive and negative gap values to derive a cumulative gap ratio he calls gap momentum. A signal line, computed as a moving average of the gap ratio, is used to determine strategy signals, where buy signals occur when the signal line is moving higher and sells occur when the line is moving lower.
Strategy: Gap Momentum

// TASC JAN 2024
// Gap Momentum
// An idea inspired by J. Welles Wilder, using Ehlers method
// Copyright P.J. Kaufman. All rights reserved.

inputs:
	Period( 1 ),
	SignalPeriod( 20 ),
	LongOnly( true ),
	PrintFile( false ),
	FilePath( "C:\TradeStation\Gap_Momentum.csv" );

variables:
	Gap( 0 ),
	UpGaps( 0 ),
	DnGaps( 0 ),
	GapRatio( 0 ),
	Idx( 0 ),
	Signal( 0 ),
	Size( 0 ),
	Investment( 100000 ),
	Adate( "" ),
	TodayPL( 0 );

for Idx = 1 to Period
begin
	Gap = Open[Idx] - Close[Idx + 1];
	if Gap > 0 then
		UpGaps = UpGaps + Gap
	else if Gap < 0 then
		DnGaps = DnGaps - Gap;
end;

if DnGaps = 0 then
	GapRatio = 1
else
	GapRatio = 100 * UpGaps / DnGaps;

Signal = Average(GapRatio, SignalPeriod);

if MarketPosition <= 0 and Signal > Signal[1] then
begin
	Buy to cover all shares next bar on Open;
	Size = Investment / Close;
	Buy size shares next bar on Open;
end
else if MarketPosition >= 0 and Signal < Signal[1] then
begin
	Sell all shares next bar on Open;
	if LongOnly = false then
	begin
		Size = Investment / Close;
		Sell short Size shares next bar on Open;
	end;
end;

TodayPL = Size * MarketPosition * (Close - Close[1]);

if PrintFile then
begin
	Adate = ELDateToString( Date );

	once
	begin
		FileAppend( FilePath,
		 "Date,Open,High,Low,Close,UpGaps,DnGaps,"
		 + "GapRatio,Signal,Pos,TodayPL");
	end;

	FileAppend( FilePath,
     string.format("{0},{1},{2},{3},{4},{5},{6},{7}"
     + "{8},{9},{10}",
     Adate,
     Open, High,
     Low, Close,
     UpGaps, DnGaps,
     GapRatio, Signal,
     MarketPosition * CurrentContracts,
     TodayPL));
end;


Indicator: Gap Momentum

// TASC JAN 2024
// Gap Momentum Indicator
// An idea inspired by J. Welles Wilder, using Ehlers method
// Copyright P.J. Kaufman. All rights reserved.

inputs:
	Period( 1 ),
	SignalPeriod( 20 );

vars:
	Gap( 0 ),
	UpGaps( 0 ),
	DnGaps( 0 ),
	GapRatio( 0 ),
	Idx( 0 ),
	Signal( 0 );

for Idx = 1 to Period
begin
	Gap = Open[Idx] - Close[Idx + 1];
	if Gap > 0 then
		UpGaps = UpGaps + Gap
	else if Gap < 0 then
		DnGaps = DnGaps - Gap;
end;

if DnGaps = 0 then
	GapRatio = 1
else
	GapRatio = 100 * UpGaps / DnGaps;

Signal = Average(GapRatio, SignalPeriod);

Plot1( GapRatio, "Gap Ratio" );
Plot2( Signal, "Signal" );
A sample chart is shown in Figure 1.

FIGURE 1: TRADESTATION. This TradeStation daily chart of the ETF QQQ shows a portion of 2023 with the strategy and indicator applied. The period is set to 1 and the SignalPeriod is set to 20.
This article is for informational purposes. No type of trading or investment recommendation, advice, or strategy is being made, given, or in any manner provided by TradeStation Securities or its affiliates.
—John Robinson
TradeStation Securities, Inc.
www.TradeStation.com
BACK TO LIST
MetaQuotes: January 2024
Here is code for use in MetaQuotes based on the article in this issue titled “Gap Momentum” by Perry Kaufman.
//+------------------------------------------------------------------+
//|                                                 Gap Momentum.mq5 |
//|                                      Copyright 2023, Shaun Bosch |
//|                                              shadavbos@gmail.com |
//+------------------------------------------------------------------+
#property copyright "Copyright 2023, Shaun Bosch"
#property link      "shadavbos@gmail.com"
#property version   "1.00"
#property description   "TASC Magazine January 2024 by Perry J. Kaufman"
#property indicator_separate_window
#property indicator_buffers 2
#property indicator_plots   2
//--- plot Gap Ratio
#property indicator_label1  "Gap Ratio"
#property indicator_type1   DRAW_LINE
#property indicator_color1  clrRed
#property indicator_style1  STYLE_SOLID
#property indicator_width1  1
//--- plot Signal
#property indicator_label2  "Signal"
#property indicator_type2   DRAW_LINE
#property indicator_color2  clrDodgerBlue
#property indicator_style2  STYLE_SOLID
#property indicator_width2  1
//--- input parameters
input int      inp_period                 = 40;          // Gap Period
input int      inp_signal_period          = 20;          // Signal Period
//--- indicator buffers
double         gapratio[];
double         signal[];
//--- indicator variables
int            period;
int            signal_period;
//+------------------------------------------------------------------+
//| Custom indicator initialization function                         |
//+------------------------------------------------------------------+
int OnInit()
  {
//--- validate input parameters
   period = inp_period < 1 ? 1 : inp_period;
   signal_period = inp_signal_period < 1 ? 1 : inp_signal_period;
//--- indicator buffers mapping
   SetIndexBuffer(0, gapratio, INDICATOR_DATA);
   SetIndexBuffer(1, signal, INDICATOR_DATA);
//--- accuracy of drawing of indicator values
   IndicatorSetInteger(INDICATOR_DIGITS, 2);
//--- set indicator name display
   string short_name = "GAP MOMENTUM (" + IntegerToString(period) + ", " + IntegerToString(signal_period) + ")";
   IndicatorSetString(INDICATOR_SHORTNAME, short_name);
//--- an empty value for plotting, for which there is no drawing
   PlotIndexSetDouble(0, PLOT_EMPTY_VALUE, EMPTY_VALUE);
//--- successful initialization
   return(INIT_SUCCEEDED);
  }
//+------------------------------------------------------------------+
//| Custom indicator iteration function                              |
//+------------------------------------------------------------------+
int OnCalculate(const int rates_total,
                const int prev_calculated,
                const datetime &time[],
                const double &open[],
                const double &high[],
                const double &low[],
                const double &close[],
                const long &tick_volume[],
                const long &volume[],
                const int &spread[])
  {
//--- populate gap ration and signal buffers
   off_GMI(rates_total, prev_calculated, period, signal_period, open, close, gapratio, signal);
//--- return value of prev_calculated for next call
   return(rates_total);
  }
//+------------------------------------------------------------------+
//| Gap Momentum Indicator (GMI)                                     |
//+------------------------------------------------------------------+
//--- by Perry J. Kaufman
//          //--- system bar_index references:
int off_GMI(const int rates_total,
            const int prev_calculated,
            //--- input variables and arrays:
            const int prd, // Gap Period (min val: 1; default val: 40)
            const int sgn_prd, // Signal Period (min val: 1; default val: 20)
            const double &open[], // Open Price
            const double &close[], // Close Price
            //--- output arrays:
            double &result_gapratio[],
            double &result_signal[])
  {
//--- bar index start
   int bar_index;
   if(prev_calculated == 0)
      bar_index = 0;
   else
      bar_index = prev_calculated - 1;
//--- main loop
   for(int i = bar_index; i < rates_total && !_StopFlag; i++)
     {
      result_gapratio[i] = EMPTY_VALUE;
      result_signal[i] = EMPTY_VALUE;
      if(i >= prd)
        {
         double gap = 0.0, upgaps = 0.0, dngaps = 0.0;
         for(int j = 0; j < prd; j++)
           {
            gap = open[i - j] - close[i - j - 1];
            upgaps += gap > 0.0 ? gap : 0.0;
            dngaps -= gap < 0.0 ? gap : 0.0;
           }
         result_gapratio[i] = dngaps == 0.0 ? 1.0 : 100.0 * upgaps / dngaps;
        }
      if(i >= sgn_prd)
        {
         double sum = 0.0;
         for(int j = 0; j < sgn_prd; j++)
            sum += result_gapratio[i - j];
         result_signal[i] = sum / double(sgn_prd);
        }
     }
   return(rates_total);
  }
//+------------------------------------------------------------------+
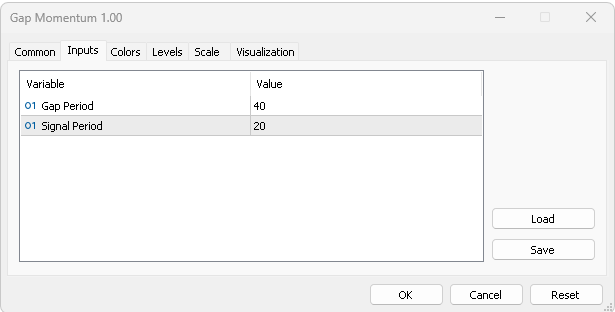
FIGURE 2: METAQUOTES. This demonstrates entering the inputs for the indicator.
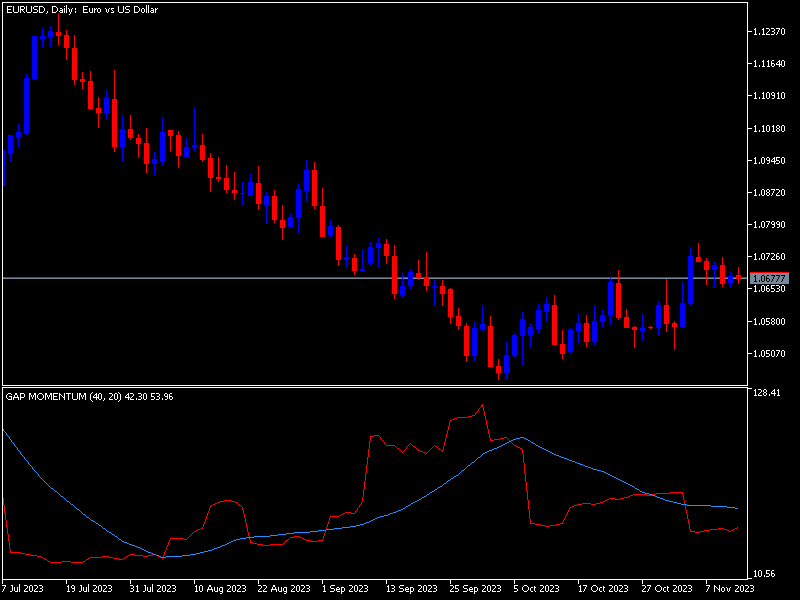
FIGURE 3: METAQUOTES. This shows the gap momentum indicator on a chart of EURUSD.
—Shaun Bosch
shadavbos@gmail.com
BACK TO LIST

MetaStock: January 2024
Perry Kaufman’s article in this issue, “Gap Momentum,” introduces his gap momentum indicator and a trading system based on it. Below are the MetaStock formulas for recreating the indicator and system test. The system test formulas could also be used in an expert advisor.
Gap Momentum Indicator:
mpds:= Input("Gap Momentum Periods", 2, 500, 40);
spda:= Input("Signal Line Periods", 2, 200, 20);
gap:= OPEN - Ref(CLOSE, -1);
upgap:= Sum( If( gap > 0, gap, 0), mpds);
dngap:= Sum( If( gap < 0, Neg(gap), 0), mpds);
denom:= If(dngap = 0, -1, dngap);
gapratio:= If(denom = -1, 1, 100 * (upgap / denom));
sig:= Mov(gapratio, spda, S);
gapratio;
sig

Gap Momentum System Test:
Buy Order:
mpds:= 40;
spda:= 20;
gap:= OPEN - Ref(CLOSE, -1);
upgap:= Sum( If( gap > 0, gap, 0), mpds);
dngap:= Sum( If( gap < 0, Neg(gap), 0), mpds);
denom:= If(dngap = 0, -1, dngap);
gapratio:= If(denom = -1, 1, 100 * (upgap / denom));
sig:= Mov(gapratio, spda, S);
dir:= roc(sig, 1, $);
cross(dir, 0)

Sell Order:
mpds:= 40;
spda:= 20;
gap:= OPEN - Ref(CLOSE, -1);
upgap:= Sum( If( gap > 0, gap, 0), mpds);
dngap:= Sum( If( gap < 0, Neg(gap), 0), mpds);
denom:= If(dngap = 0, -1, dngap);
gapratio:= If(denom = -1, 1, 100 * (upgap / denom));
sig:= Mov(gapratio, spda, S);
dir:= roc(sig, 1, $);
cross(0, dir)
—William Golson
MetaStock Technical Support
www.MetaStock.com
BACK TO LIST

Wealth-Lab.com: January 2024
The gap momentum indicator presented by Perry Kaufman in his article in this issue of has been added to Wealth-Lab 8, helping power any tool and extension of the product.
With cumulative indicators such as the gap momentum or OBV, be wary of making conclusions not having executed backtests with different starting dates. Backtests spanning different date ranges may produce different sets of trades because of that.
Figure 4 shows how hands-down the process is for building a demo system from author’s trading rules using Wealth-Lab’s Building Blocks:
- Buy when the signal line is moving higher.
- Exit when the signal line is moving lower.
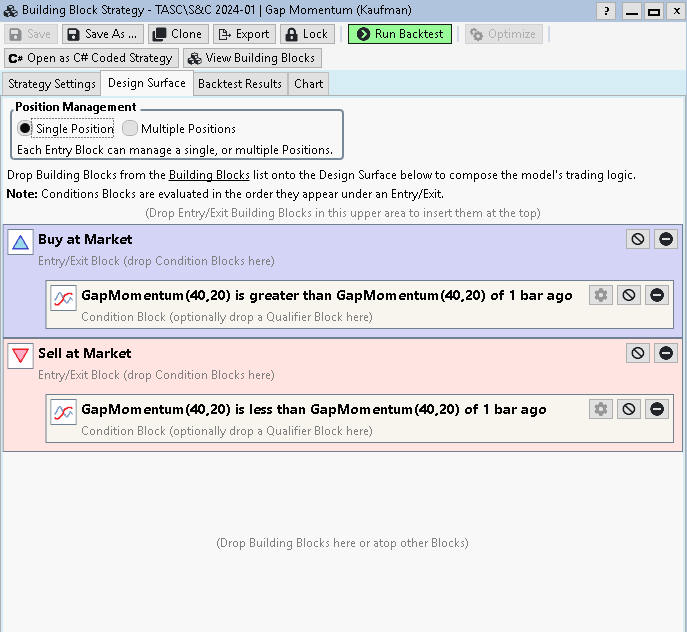
FIGURE 4: WEALTH-LAB. An outline of a system’s trading logic can be expressed using Conditions Blocks.
Figure 5 shows an outline of the system’s trading logic expressed with Conditions Blocks.
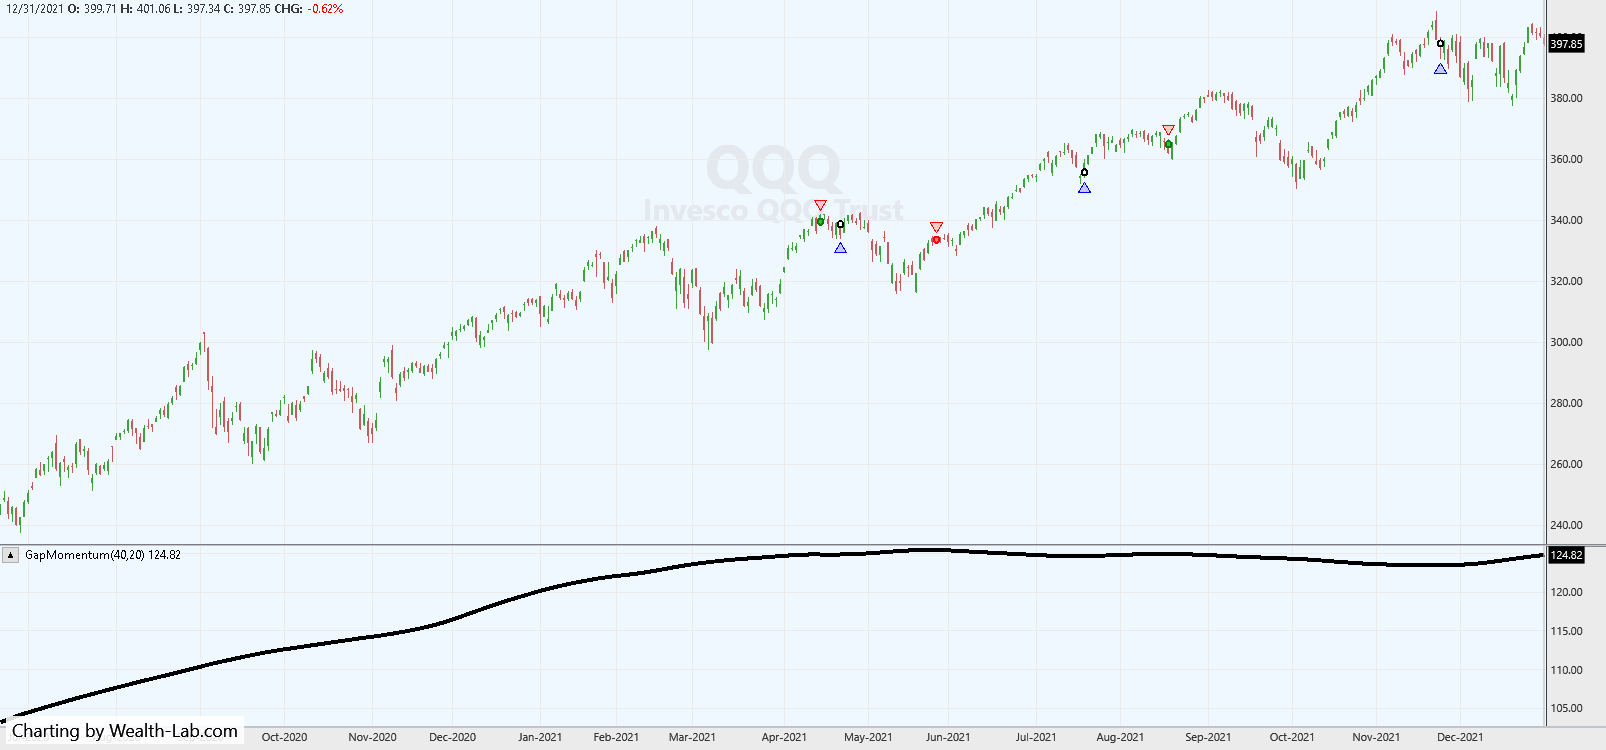
FIGURE 5: WEALTH-LAB. Some exemplary trades can be seen here for the strategy on a chart of QQQ. Data provided by Yahoo! Finance.
—Gene Geren (Eugene)
Wealth-Lab team
www.wealth-lab.com
BACK TO LIST

TradingView: January 2024
The following TradingView Pine Script code implements the gap momentum strategy developed by Perry Kaufman presented in his article titled “Gap Momentum.”
//  TASC Issue: January 2024 - Vol. 42, Issue 1
//     Article: Gap Momentum Indicator
//              Taking A Page From The On-Balance Volume
//  Article By: Perry J. Kaufman
//    Language: TradingView's Pine Script™ v5
// Provided By: PineCoders, for tradingview.com


//@version=5
string title  = 'TASC 2024.01 Gap Momentum System'
string stitle = 'GMS'
strategy(title, stitle, false)


int period       = input.int( 40,   'Period:')
int signalPeriod = input.int( 20,   'Signal Period:')
bool longOnly    = input.bool(true, 'Long Only:')


float gap   = open - close[1]
float gapUp = 0.0
float gapDn = 0.0
switch
    gap > 0 => gapUp += gap
    gap < 0 => gapDn -= gap


float gapsUp   = math.sum(gapUp, period)
float gapsDn   = math.sum(gapDn, period)
float gapRatio = gapsDn == 0?1.0:100.0*gapsUp/gapsDn
float signal   = ta.sma(gapRatio, signalPeriod)


if strategy.opentrades <= 0 and signal > signal[1]
    // buy at next open:
    strategy.entry('long', strategy.long)
else if strategy.opentrades > 0 and signal < signal[1]
    if longOnly
        // close all at next open:
        strategy.close_all()
    else
        // sell at next open:
        strategy.entry('short', strategy.short)


plot(gapRatio, 'Gap Momentum', color.red,    2)
plot(signal,   'Signal',       color.silver, 1)
The indicator is available on TradingView from the PineCodersTASC account:
tradingview.com/u/PineCodersTASC/#published-scripts
An example chart is shown in Figure 6.
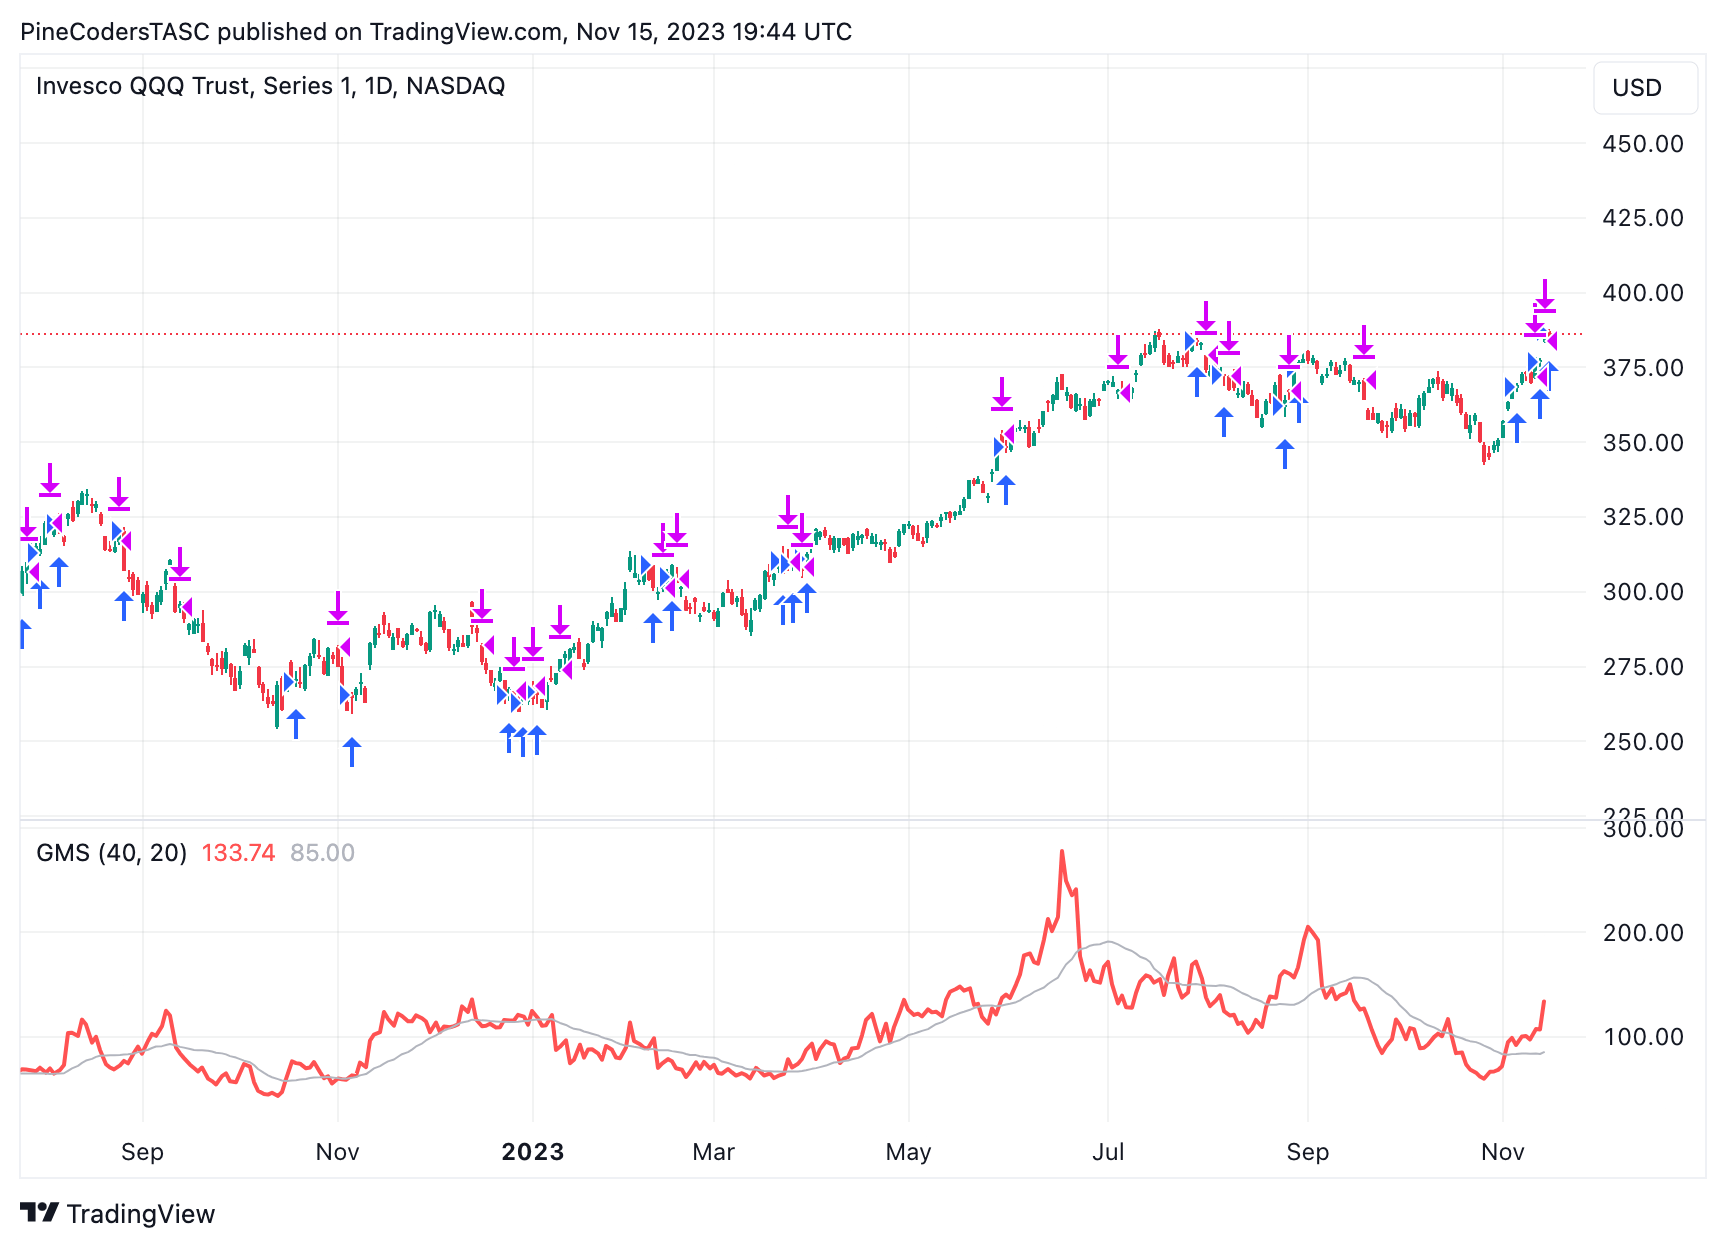
FIGURE 6: TRADINGVIEW. Example signals are shown on a chart of QQQ.
—PineCoders, for TradingView
www.TradingView.com
BACK TO LIST

NinjaTrader: January 2024
The gap momentum indicator, which is introduced in the article “Gap Momentum” in this issue by Perry Kaufman, is available for download at the following link for NinjaTrader 8:
Once the file is downloaded, you can import the indicator into NinjaTrader 8 from within the control center by selecting Tools → Import → NinjaScript Add-On and then selecting the downloaded file for NinjaTrader 8.
You can review the indicator’s source code in NinjaTrader 8 by selecting the menu New → NinjaScript Editor → Indicators folder from within the control center window and selecting the file.
A sample chart displaying the indicator is shown in Figure 7. Please refer to the article in this issue for details about the author’s strategy and any settings for the indicator. The backtest shown here may represent a different time period than the one used by the author, which may lead to a difference in signals displayed.

FIGURE 7: NINJATRADER. Here's an example of the gap momentum indicator on QQQ.
NinjaScript uses compiled DLLs that run native, not interpreted, to provide you with the highest performance possible.
—NinjaTrader, LLC
www.ninjatrader.com
BACK TO LIST

NeuroShell Trader: January 2024
To implement the gap momentum indicator in NeuroShell Trader, simply select “new indicator” from the insert menu and use the indicator wizard to create the indicators below:
	Gap:    Sub( Open, Lag(Close,1)
	GapUp:    IfThenElse( A>B(GAP,0), GAP, 0 )
	GapDown:    IfThenElse( A<B(GAP,0), Neg(GAP), 0 )
	GapMomentum:    Avg( Mul2(100, Divide( Sum(GAPUP,40), Sum(GAPDOWN,40)) ), 40)
To implement the trading system, select “new strategy” from the insert menu and use the trading strategy wizard to create the following strategy:
BUY LONG CONDITIONS:
     A>B( Momentum( GapMomentum(Open,Close,40), 1), 0)

SELL LONG CONDITIONS:
     A<B( Momentum( GapMomentum(Open,Close,40), 1), 0)

FIGURE 8: NEUROSHELL TRADER. This NeuroShell Trader chart shows the gap momentum trading system on QQQ.
Users of NeuroShell Trader can go to the Stocks & Commodities section of the NeuroShell Trader free technical support website to download a copy of this or any previous Traders’ Tips.
—Ward Systems Group, Inc.
sales@wardsystems.com
www.neuroshell.com
BACK TO LIST

The Zorro Platform: January 2024
In this issue, the article “Gap Momentum” presents a trading strategy based on upward and downward gaps. I’m going to split his code in two parts: the gap momentum indicator and the trading system. The indicator code is just an 1:1 translation of his EasyLanguage code to C, as follows:
var GAPM(int Period, int SignalPeriod)
{
	var UpGaps = 0, DnGaps = 0;
	int ix;
	for(ix = 0; ix < Period; ix++) {
		var Gap = priceO(ix) - priceC(ix+1);
		if(Gap > 0) UpGaps += Gap;
		else if(Gap < 0) DnGaps -= Gap;
	}
	var GapRatio = ifelse(DnGaps == 0,1,100*UpGaps/DnGaps);
	return SMA(series(GapRatio),SignalPeriod);
}
The system trades QQQ, a NASDAQ ETF. The historical data for the backtest is loaded from Yahoo. It enters a long position when upward gaps are on the rise, and closes the position otherwise. The code in C for the Zorro platform is as follows:
function run()
{
	StartDate = 2011;
	EndDate = 2023;
	BarPeriod = 1440;
	Fill = 3;	// trade on next open
	var Investment = 100000;

	assetAdd("QQQ","YAHOO:*");
	asset("QQQ");

	vars Signals = series(GAPM(40,20));
	if(!NumOpenLong && rising(Signals))
		enterLong(Investment/priceC());
	if(NumOpenLong && falling(Signals))
		exitLong();
}
The resulting equity curve is shown in Figure 9.
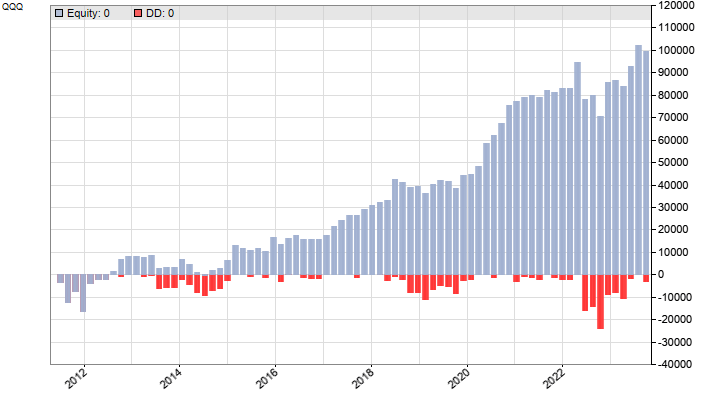
FIGURE 9: ZORRO. This shows an example equity curve from a test of the gap momentum indicator, which is based on the concept of upward and downward gaps.
The system achieves 12% return on investment, well above buy-and-hold, with 56% winning trades.
The GAPM indicator and the trading system can be downloaded from the 2023 script repository on https://financial-hacker.com. The Zorro platform for C/C++ algo trading can be downloaded from https://zorro-project.com.
—Petra Volkova
The Zorro Project by oP group Germany
https://zorro-project.com
BACK TO LIST
Originally published in the January 2024 issue of
Technical Analysis of STOCKS & COMMODITIES magazine.
All rights reserved. © Copyright 2023, Technical Analysis, Inc.


