TRADERS’ TIPS
February 2024
For this month’s Traders’ Tips, the focus is Alfred François Tagher’ article in this issue, “Trend Identification By Price And Time Filtering.” Here, we present the February 2024 Traders’ Tips code with possible implementations in various software.
You can right-click on any chart to open it in a new tab or window and view it at it’s originally supplied size, often much larger than the version printed in the magazine.
The Traders’ Tips section is provided to help the reader implement a selected technique from an article in this issue or another recent issue. The entries here are contributed by software developers or programmers for software that is capable of customization.

RealTest: February 2024
Here is coding based on the article in this issue, “Trend Identification By Price And Time Filtering” by Alfred François Tagher, for use in RealTest (mhptrading.com).
Code in text format:
Data:
    trendUpW:    Extern(~Weekly, C > H[1])
    trendDnW:    Extern(~Weekly, C < L[1])
    trendW:    Select(IsNaN(trendUpW), 0,
            trendUpW, Max(1, trendW[1] + 1),
            trendDnW, Min(-1, trendW[1] - 1),
            trendW[1] + Sign(trendW[1]))

    trendUpM:    Extern(~Monthly, C > H[1])
    trendDnM:    Extern(~Monthly, C < L[1])
    trendM:    Select(IsNaN(trendUpM), 0,
            trendUpM, Max(1, trendM[1] + 1),
            trendDnM, Min(-1, trendM[1] - 1),
            trendM[1] + Sign(trendM[1]))

Charts:
    trendW:    trendW {|}
    trendM:    trendM {|}
A sample RealTest chart showing both indicators in the lower pane can be seen in Figure 1.
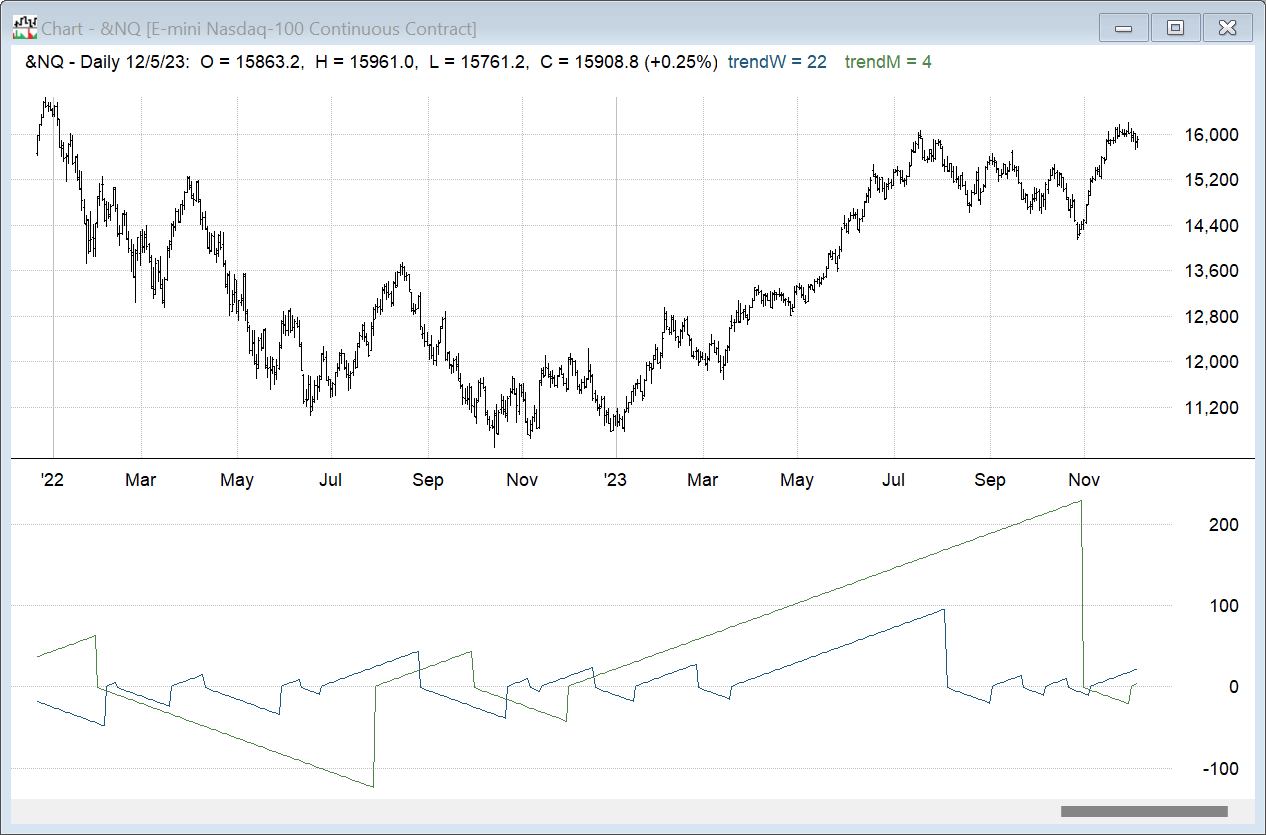
FIGURE 1: REALTEST. This example chart shows both the weekly and monthly versions of the indicator in the lower pane.
—Marsten Parker
MHP Trading, Mhptrading.com
mhp@mhptrading.com
BACK TO LIST

TradeStation: February 2024
In the article “Trend Identification By Price And Time Filtering” in this issue, author Alfred François Tagher formulates rules for trend identification. By utilizing price and time filters centered on weekly and monthly price action, one can effectively reduce market noise. This technique aims to capture, sustain, and benefit from prolonged price trends. The studies provided consist of a PaintBar and two indicators.
PaintBar: Price-Time Filtering PB (Weekly)

{
TASC TASC FEB 2024
PaintBar
Price-Time Filtering PB (Weekly)
© 2023 Alfred François Tagher

AFT Strong Trend Weekly

If Friday's close is greater than last week's high then
the trend is up. If Friday's close is less than last week's
low then the trend is down.
}

inputs:
	UpColor( Green ),
	DnColor( Red );

variables:
	WeekHi( 0 ),
	WeekLo( 0 ),
	WeekCl( 0 ),
	WeekKnt( 0 ),
	PriorWeekHi( 0 ),
	PriorWeekLo( 0 ),
	PriorWeekCl( 0 ),
	PlotColor( 0 ),
	Trend( 0 );

if (DayOfWeek(Date) < DayOfWeek(Date[1]) and
 DayOfWeek(Date[1]) <> 5) or (DayOfWeek(Date) = 5) then
begin
	{This uses Monday if there was no Friday}
	if DayOfWeek(Date) = 5 then
	begin
		Value1 = Close;
		if High > WeekHi then
			WeekHi = High;
		if Low < WeekLo then
			WeekLo = Low;
	end
	else
		Value1 = Close[1];

	{Need to check if Close exceeds prior Week}
	if Value1 > PriorWeekHi then
		Trend = 1;
	if Value1 < PriorWeekLo then
		Trend = -1;

	PriorWeekHi = WeekHi;
	PriorWeekLo = WeekLo;
	WeekKnt = WeekKnt+1;
end;

if DayOfWeek(Date) < DayOfWeek(Date[1]) then
begin
	WeekHi = High;
	WeekLo = Low;
end;

if High > WeekHi then
	WeekHi = High;
if Low < WeekLo then
	WeekLo = Low;

if WeekKnt > 1 then
begin
	PlotColor = Iff(Trend = 1, UpColor, DnColor);
	PlotPB( High, Low, Open, Close, "Trend", PlotColor );
 end;


Indicator: Price-Time Filtering PB (Weekly)

{
TASC FEB 2024
Price-Time Filtering (Weekly)
© 2023 Alfred François Tagher

AFT Strong Trend Weekly

If Friday's close is greater than last week's high then
the trend is up. If Friday's close is less than last week's
low then the trend is down.
}

inputs:
	UpColor( Green ),
	DnColor( Red );

variables:
	WeekHi( 0 ),
	WeekLo( 0 ),
	WeekCl( 0 ),
	WeekKnt( 0 ),
	PriorWeekHi( 0 ),
	PriorWeekLo( 0 ),
	PriorWeekCl( 0 ),
	Trend( 0 ),
	NumBarsUp( 0 ),
	NumBarsDn( 0 );

if (DayOfWeek(Date) < DayOfWeek(Date[1]) and
 DayOfWeek(Date[1]) <> 5) or (DayOfWeek(Date) = 5) then
begin
	{this uses Monday if there was no Friday}
	if DayOfWeek(Date) = 5 then
	begin
		Value1 = Close;
		if High > WeekHi then
			WeekHi = High;
		if Low < WeekLo then
			WeekLo = Low;
	end
	else
		Value1 = Close[1];

	{Need to check if Close exceeds prior Week}
	if Value1 > PriorWeekHi then
		Trend = 1;
	if Value1 < PriorWeekLo then
		Trend = -1;

	PriorWeekHi = WeekHi;
	PriorWeekLo = WeekLo;
	WeekKnt = WeekKnt+1;
end;

if DayOfWeek(Date) < DayOfWeek(Date[1]) then
begin
	WeekHi = High;
	WeekLo = Low;
end;

if High > WeekHi then
	WeekHi = High;
if Low < WeekLo then
	WeekLo = Low;

if Trend <> Trend[1] then
begin
	NumBarsUp = 0;
	NumBarsDn = 0;
end;

if Trend = 1 then
	NumBarsUp += 1
else if Trend = -1 then
	NumBarsDn -= 1;

if WeekKnt > 1 then
begin
	if Trend = 1 then
		Plot1(NumBarsUp, "Week UP", UpColor);
	if Trend = -1 then
		Plot2(NumBarsDn, "Week UP", DnColor);
end;


Indicator: Price-Time Filtering PB (Monthly)

{
TASC FEB 2024
Price-Time Filtering (Monthly)
© 2023 Alfred François Tagher

AFT Strong Trend Monthly - Format as Histogram
}

inputs:
	Lkbk( 500 ),
	UpColor( Green ),
	DnColor( Magenta );

variables:
	WeekHi( 0 ),
	WeekLo( 0 ),
	WeekCl( 0 ),
	WeekKnt( 0 ),
	PriorWeekHi( 0 ),
	PriorWeekLo( 0 ),
	PriorWeekCl( 0 ),
	Trend( 0 ),
	NumBarsUp( 0),
	NumBarsDn( 0 ),
	Cnt( 0 ),
	Dir( 0 );

if Month(Date) <> Month(Date[1]) then
begin
	if High > WeekHi then
		WeekHi = High;
	if Low < WeekLo then
		WeekLo = Low;

	if Close[1] > PriorWeekHi then
		Trend = 1;
	if Close[1] < PriorWeekLo then
		Trend = -1;

	PriorWeekHi = WeekHi;
	PriorWeekLo = WeekLo;
	WeekKnt = WeekKnt + 1;
end;

if Month(Date) <> Month(Date[1]) then
begin
	WeekHi = High;
	WeekLo = Low;
end;

if High > WeekHi then
	WeekHi = High;
if Low < WeekLo then
	WeekLo = Low ;

if WeekKnt > 1 then
begin
	NumBarsUp = MRO(Trend = 1, Lkbk, 1);
	NumBarsDn = MRO(Trend = -1, Lkbk, 1);
	Plot1(-NumBarsUp, "NumBarsDn", DnColor);
	Plot2(NumBarsDn, "NumBarsUp", UpColor);
end;
A sample chart is shown in Figure 2.

FIGURE 2: TRADESTATION. This shows a TradeStation daily chart of the NASDAQ-100 index continuous futures showing 2023 with the studies applied.
This article is for informational purposes. No type of trading or investment recommendation, advice, or strategy is being made, given, or in any manner provided by TradeStation Securities or its affiliates.
—John Robinson
TradeStation Securities, Inc.
www.TradeStation.com
BACK TO LIST

Wealth-Lab.com: February 2024
We’ve added our own rendition of the StrongTrend indicator from Alfred François Tagher’s article in this issue, “Trend Identification By Price And Time Filtering,” to Wealth-Lab 8, exposing it to the gamut of tools and extensions of the software.
Wealth-Lab’s ability to compress time series and bar data into higher scales simplified our coding greatly, automatically making the indicator available to any supported bar scale from intraday to yearly.
In under a minute, a quick demo system is created without any programming, buying when the ST (weekly) indicator is at its high and selling when it crosses under its signal line. The screenshot on Figure 3 illustrates the gist of composing the system using Wealth-Lab’s Building Blocks feature.
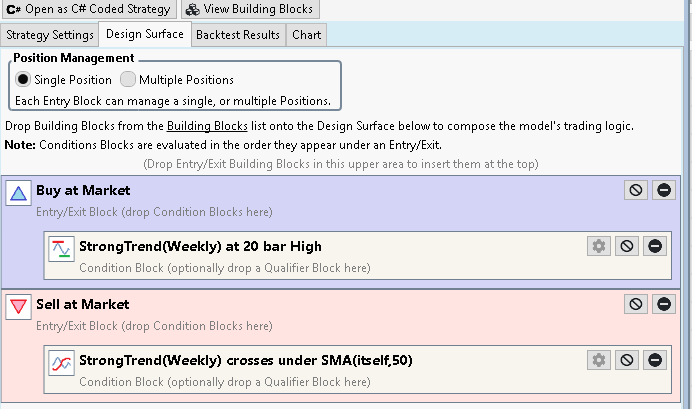
FIGURE 3: WEALTH-LAB. This shows an outline of the system’s trading logic expressed with Building Blocks.
Figure 4 shows the system applied to the Nasdaq 100 index.
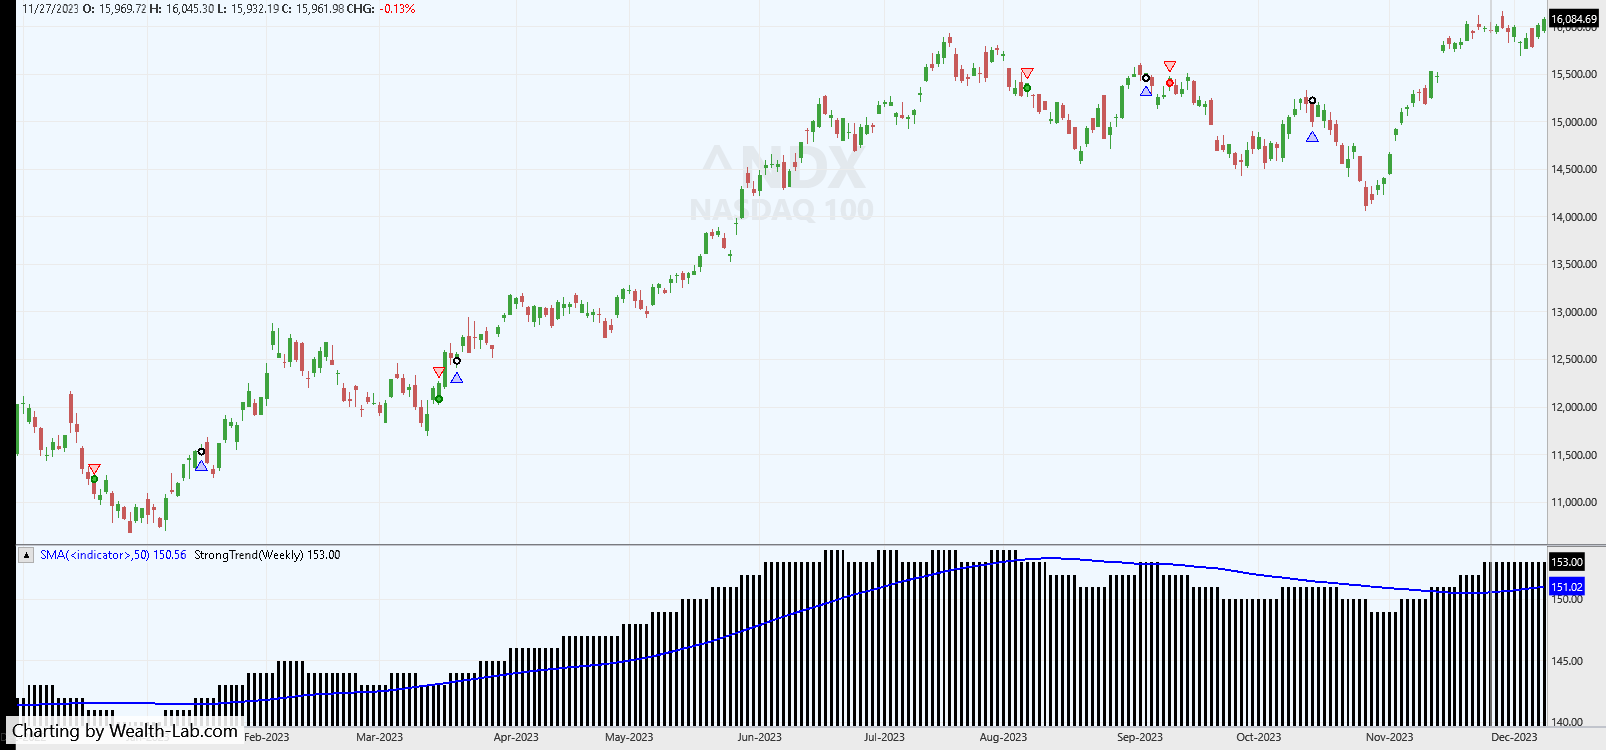
FIGURE 4: WEALTH-LAB. Here you can see the system’s latest trades as applied to ^NDX, Nasdaq 100 index. Data provided by Yahoo! Finance.
The Nasdaq-100 has a trending nature, having not spend a lot of time in consolidations, making it a suitable candidate for this kind of trend indicator.
—Gene Geren (Eugene)
Wealth-Lab team
www.wealth-lab.com
BACK TO LIST

MetaStock: February 2024
Alfred François Tagher’s article in this issue, “Trend Identification By Price And Time Filtering,” introduces his price-time filtering indicator. Here are three formulas you can use to add that indicator to MetaStock:
Price & Time Filter (Monthly on Daily):

{a monthly Price & Time Filter calculated on daily data}
{expects to be plotted on a daily chart}
new:= ROC(DayOfMonth(),1,$)<1;
mhi:= HighestSince(1, new, H);
mlo:= LowestSince(1, new, L);
up:= new AND C > Ref(mhi, -1);
dn:= new AND C < Ref(mlo, -1);
trend:= If( up, Max(1, PREV+1), If(dn, Min(-1, PREV-1),
If(new, If(PREV>0, PREV+1, PREV-1), PREV)));
If(trend>0, trend, 0);
If(trend<0, trend, 0)


Price & Time Filter (Weekly on Daily):

{a weekly Price & Time Filter calculated on daily data}
{expects to be plotted on a daily chart}
fri:= DayOfWeek() = 5;
new:= ROC(DayOfWeek(),1,$)<1;
recalc:= fri OR (new AND Ref(fri=0, -1));
hi:= HighestSince(1, new, H);
lo:= LowestSince(1, new, L);
whi:= If(fri, hi, Ref(hi, -1));
wlo:= If(fri, lo, Ref(lo, -1));
up:= recalc AND C > Ref(whi, -1);
dn:= recalc AND C < Ref(wlo, -1);
trend:= If( up, Max(1, PREV+1), If(dn, Min(-1, PREV-1),
If(recalc, If(PREV>0, PREV+1, PREV-1), PREV)));
If(trend>0, trend, 0);
If(trend<0, trend, 0)

Price & Time Filter (native):

{calculates the Price & Time Filter on the data interval of the chart}
up:= C > Ref(H, -1);
dn:= C < Ref(L, -1);
trend:= If( up, Max(1, PREV+1), If(dn, Min(-1, PREV-1), If(PREV>0, PREV+1, PREV-1)));
If(trend>0, trend, 0);
If(trend<0, trend, 0)
—William Golson
MetaStock Technical Support
www.MetaStock.com
BACK TO LIST

NinjaTrader: February 2024
The weekly and monthly time-price filters, which are introduced in the article “Trend Identification By Price And Time Filtering” by Alfred François Tagher in this issue, are available for download at the following link for NinjaTrader 8:
Once the file is downloaded, you can import the indicator into NinjaTrader 8 from within the control center by selecting Tools → Import → NinjaScript Add-On and then selecting the downloaded file for NinjaTrader 8.
You can review the indicator source code in NinjaTrader 8 by selecting the menu New → NinjaScript Editor → Indicators folder from within the control center window and selecting the “AFTStrongTrend” file.
A sample chart displaying the indicator is shown in Figure 5.

FIGURE 5: NINJATRADER. The AFTStrongTrendWK and AFTStrongTrendMO indicators are displayed here on a daily CL 01-24 chart from June 2023 through December 2023.
NinjaScript uses compiled DLLs that run native, not interpreted, to provide you with the highest performance possible.
—Emily Christoph
NinjaTrader, LLC
www.ninjatrader.com
BACK TO LIST

TradingView: February 2024
This TradingView Pine Script code implements the price-and-time filter introduced in the article in this issue titled “Trend Identification By Price And Time Filtering” by Alfred François Tagher. The script visualizes identified trends by coloring price bars in the main chart. Additionally, it plots the trend filter in the subchart by counting the number of bars in uptrends and downtrends on the price chart.
//  TASC Issue: February 2024 - Vol. 42, Issue 2
//     Article: Trend Identification By Price
//              And Time Filtering.
//              Riding Sustained Price Trends.
//  Article By: Alfred François Tagher
//    Language: TradingView's Pine Script™ v5
// Provided By: PineCoders, for tradingview.com


//@version=5
string title  = 'TASC 2024.01 Price-Time Filtering'
string stitle = 'PTF'
indicator(title, stitle, false)


// --- Inputs ---
string t       = input.string('weekly', 'Period',
                     options = ['weekly', 'monthly'])
color  ColUp   = input.color(color.green, 'Uptrend Color')
color  ColDn   = input.color(color.red, 'Downtrend Color')
bool   BarCol  = input.bool(true, 'Bar Color')
bool   ShowTab = input.bool(true, 'Show Table')


// --- Calculations ---
if not timeframe.isdaily
	string eMsg = 'Use daily timeframe for this indicator'
	runtime.error(eMsg)


bool isNewWeek  = ta.change(weekofyear) != 0
bool isNewMonth = ta.change(month)      != 0
bool isFriday   = dayofweek == dayofweek.friday


AFTOverlay (string period = 'weekly') =>
	var float Value1      = na
	var float WeekHi      = na
	var float WeekLo      = na
	var int   WeekKnt     = na
	var float PriorWeekHi = na
	var float PriorWeekLo = na
	var int Trend         = na
	switch period
		'weekly' =>
			if isNewWeek and (not isFriday[1]) or isFriday
				// Use monday if there is no friday
				if isFriday
					Value1 := close
					if high > WeekHi
						WeekHi := high
					if low < WeekLo
						WeekLo := low
				else
					Value1 := close[1]
				// Need to check if close exceeds prior week
				if Value1 > PriorWeekHi
					Trend := +1
				if Value1 < PriorWeekLo
					Trend := -1
				PriorWeekHi := WeekHi
				PriorWeekLo := WeekLo
				WeekKnt += 1
			if isNewWeek
				WeekHi := high
				WeekLo := low
			if high > WeekHi
				WeekHi := high
			if low < WeekLo
				WeekLo := low
			[Trend, WeekHi, WeekLo]
		'monthly' =>
			if isNewMonth
				if high > WeekHi
					WeekHi := high
				if low < WeekLo
					WeekLo := low
				Value1 := close[1]
				if Value1 > PriorWeekHi
					Trend := +1
				if Value1 < PriorWeekLo
					Trend := -1
				PriorWeekHi := WeekHi
				PriorWeekLo := WeekLo
				WeekKnt += 1
			if isNewMonth
				WeekHi := high
				WeekLo := low
			if high > WeekHi
				WeekHi := high
			if low < WeekLo
				WeekLo := low
			[Trend, WeekHi, WeekLo]
		=>
			runtime.error('Period was not specified!')
			[0, 0.0, 0.0]


[Trend, WeekHi, WeekLo] = AFTOverlay(t)


// --- Output ---
// Bar Coloring:
color    col = Trend>0 ? ColUp  : ColDn
barcolor(BarCol ? col : na)


// Trend Oscillator:
ph           = plot.style_histogram
int TUpCount = ta.barssince(Trend<0)
int TDnCount = ta.barssince(Trend>0)
plot(TUpCount<1?na: TUpCount, '', ColUp, 2, ph)
plot(TDnCount<1?na:-TDnCount, '', ColDn, 2, ph)


// Summary Table:
var table tbl = table.new(position.top_right, 2, 3,
		 color.yellow, color.navy, 1, color.white, 2)
if ShowTab and barstate.islast
	string tFormat = t == "weekly"  ? "Weeks"  :
	                 t == "monthly" ? "Months" : "Count"
	tbl.cell(0, 0, "Up " + tFormat + ":",  text_color=ColUp)
	tbl.cell(0, 1, "Down " + tFormat + ":",text_color=ColDn)
	tbl.cell(0, 2, "Total " + tFormat + ":")
	tbl.cell(1, 0, str.tostring(TUpCount), text_color=ColUp)
	tbl.cell(1, 1, str.tostring(TDnCount), text_color=ColDn)
	tbl.cell(1, 2, str.tostring(TUpCount + TDnCount))
The indicator is available on TradingView from the PineCodersTASC account:
https://www.tradingview.com/u/PineCodersTASC/#published-scripts
An example chart displaying the indicator in TradingView is shown in Figure 6.
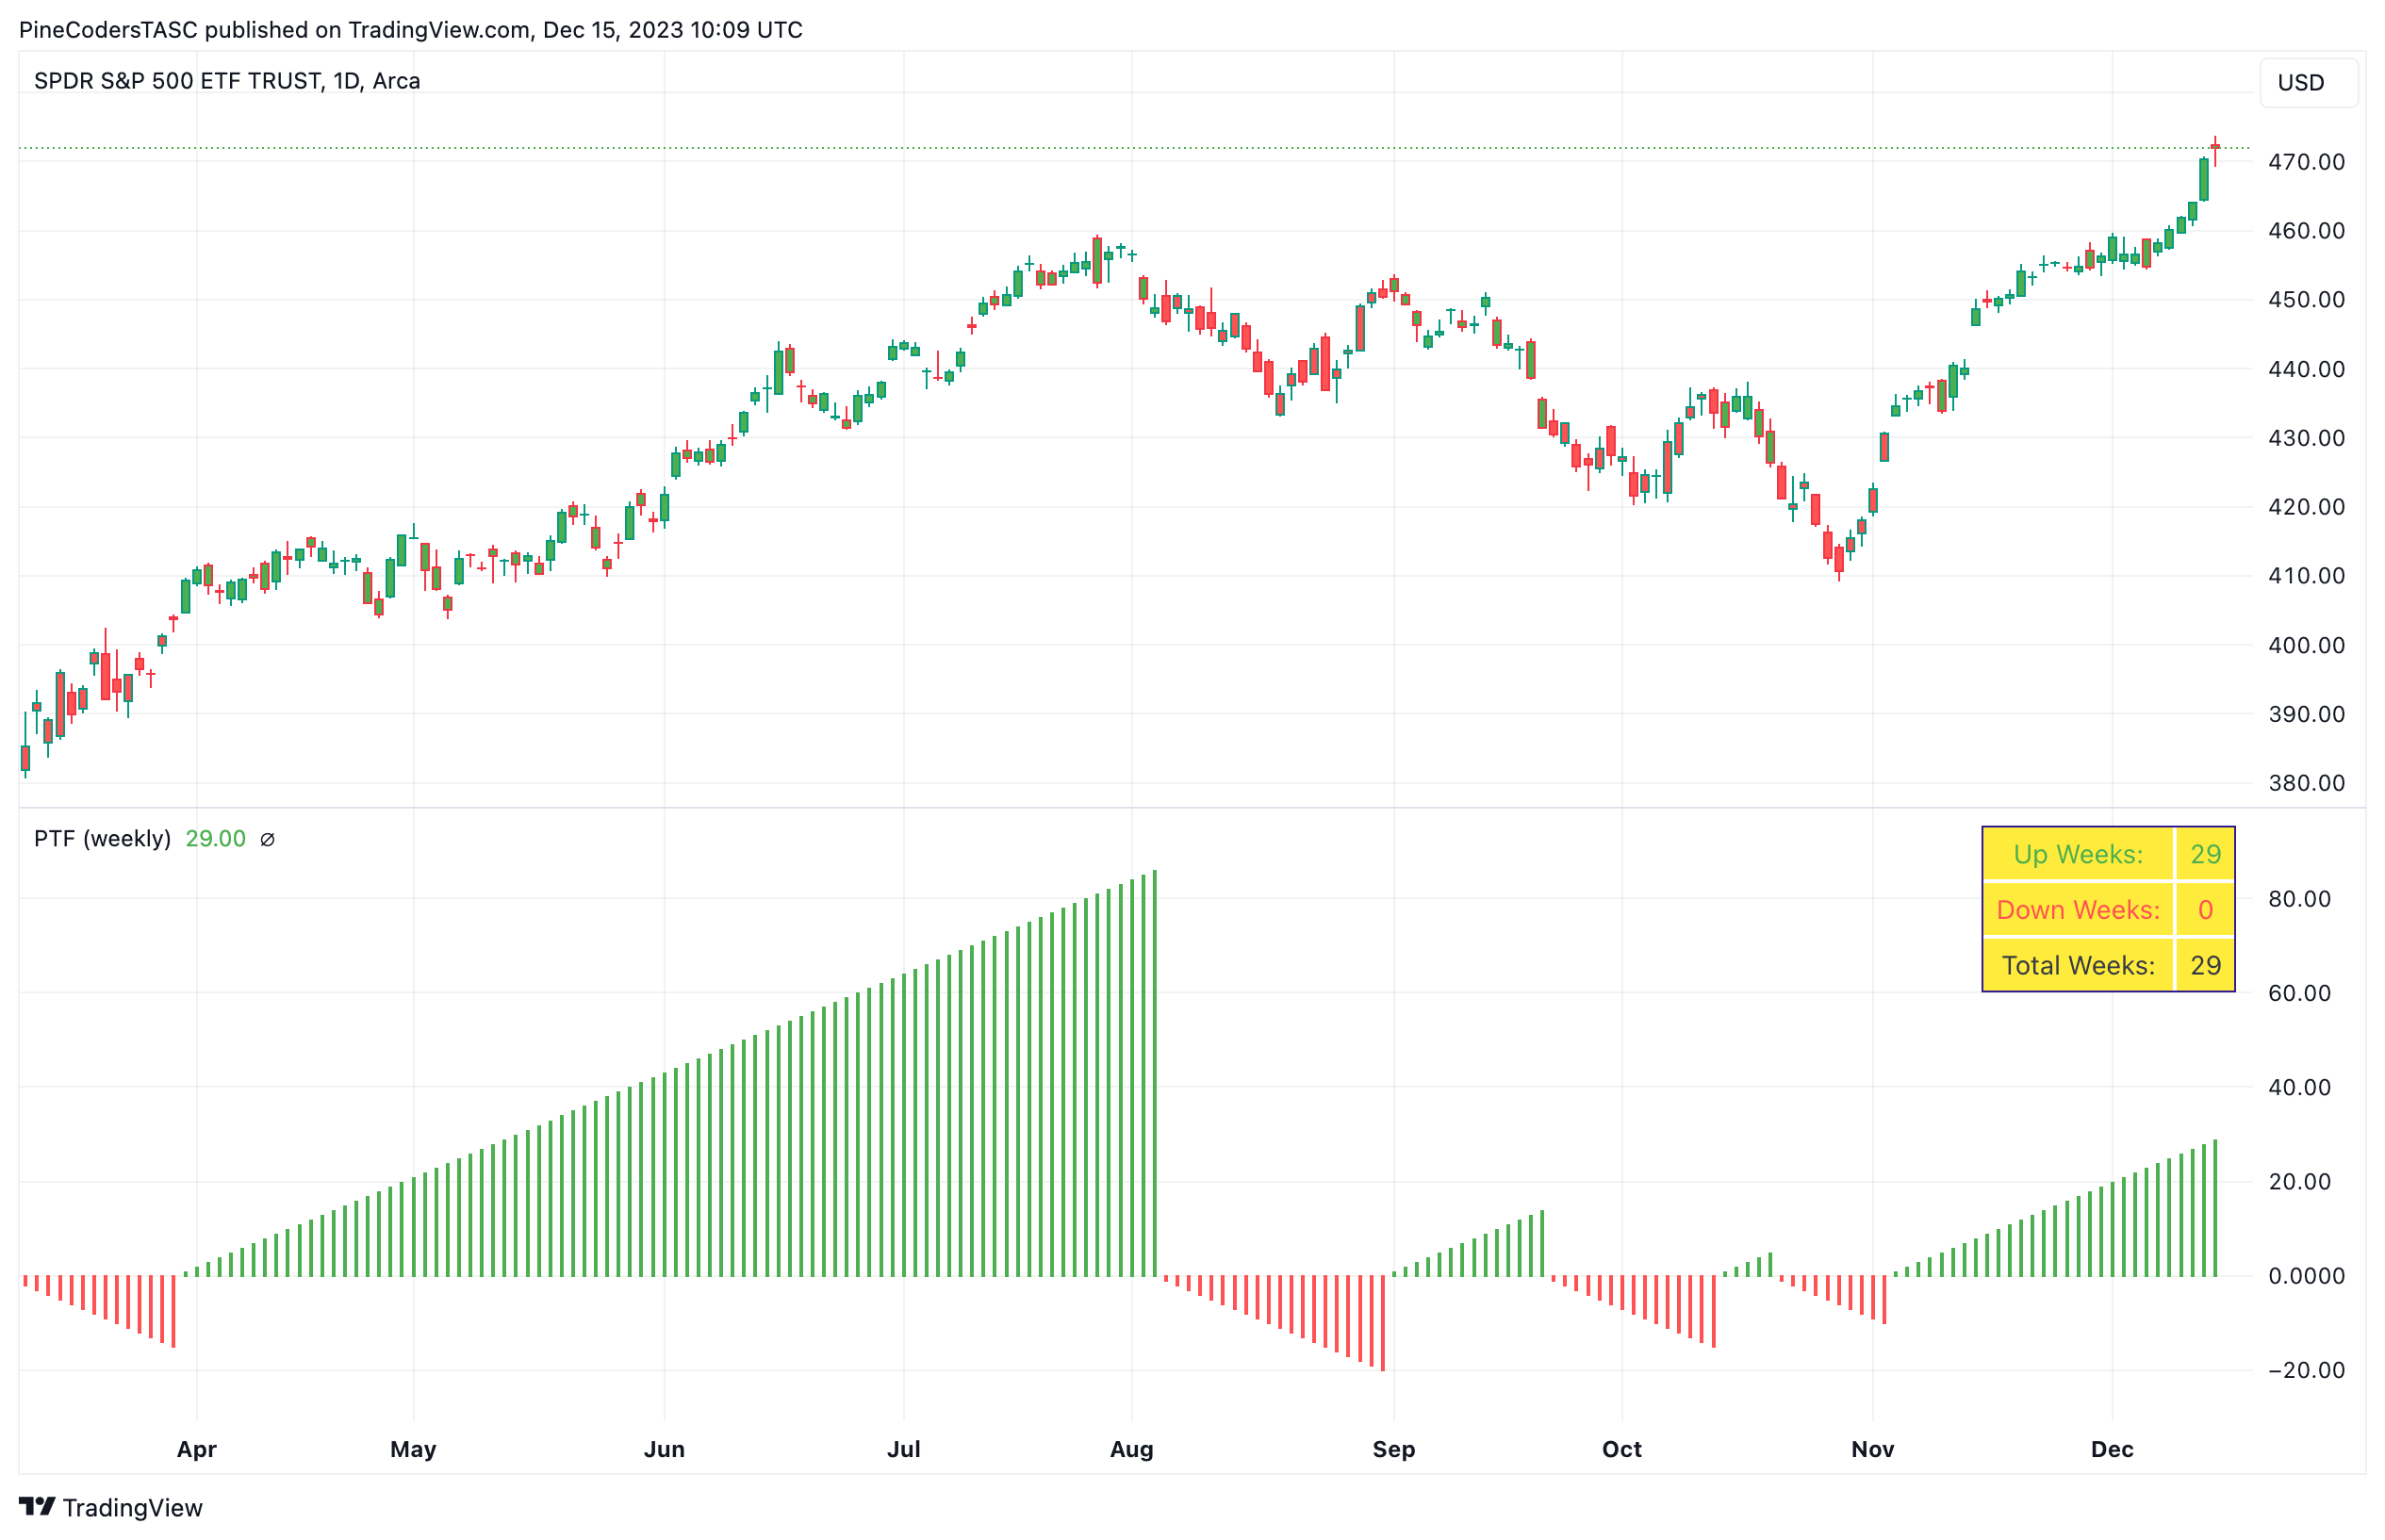
FIGURE 6: TRADINGVIEW. Here’s an example of the weekly and monthly StrongTrend indicator on a chart of Nasdaq-100 futures. The TradingView script visualizes identified trends by coloring price bars in the main chart and it plots the trend filter in a subchart by counting the number of bars in uptrends and downtrends on the price chart.
—PineCoders, for TradingView
www.TradingView.com
BACK TO LIST

Neuroshell Trader: February 2024
To implement the trend identification indicators that are described by Alfred François Tagher in his article in this issue, “Trend Identification By Price And Time Filtering,” in NeuroShell Trader, here are the steps.
For the weekly indicator, select “new indicator” from the insert menu and use the indicator wizard to create the following indicators:
BarFlag:	Friday(Date)
UpTrend:	And2( BarFlag, A>B(Close, Lag( PriceHigh(High,5),5)) )
DownTrend:	And2( BarFlag, A<B(Close, Lag( PriceLow(Low,5),5)) )
Signal:		Remember2( Add2(1,0), UpTrend, Sub(0,1), DownTrend )
BarsSince:	Add2( BarsSinceCond( A not equal B( Momentum(Signal,1), 0), 0), 1 )
TrendID:	Mul2(Signal, BarsSince)
To implement the monthly trend identification indicator in NeuroShell Trader, calculate Signal, BarsSince, TrendID above using the BarFlag, UpTrend and DownTrend calculations as follows:
BarFlag:	A<B( Momentum( DayOfMonth(Date), 1 ), 0 )
UpTrend:	And2( BarFlag, A>B(Close, Lag( PriceHigh(High,20),20)) )
DownTrend:	And2( BarFlag, A<B(Close, Lag( PriceLow(Low,20),20)) )
The BarsSince and remember indicators can be found in Advanced Indicator Set 2 and 3, respectively.

FIGURE 7: NEUROSHELL TRADER. This NeuroShell Trader chart shows the trend identification indicator on the S&P 500.
Users of NeuroShell Trader can go to the Stocks & Commodities section of the NeuroShell Trader free technical support website to download a copy of this or any previous Traders’ Tips.
—Ward Systems Group, Inc.
sales@wardsystems.com
www.neuroshell.com
BACK TO LIST

Optuma: February 2024
Here is an Optuma script formula based on the article in this issue, “Trend Identification By Price And Time Filtering,” to color the bars green for the weekly version of the filter:
//Get previous week's high;
H1=HIGH(Week(PERIODAMOUNT=1)[1]);
//Get previous week's low;
L1=LOW(Week(PERIODAMOUNT=1)[1]);
//Get current week's close;
C1=CLOSE(Week(PERIODAMOUNT=1));
//Use the switch function to turn on when close > previous high until the close < previous low;
SWITCH(C1>H1, C1<L1)
When the above isn’t true, the bars will be red by default.
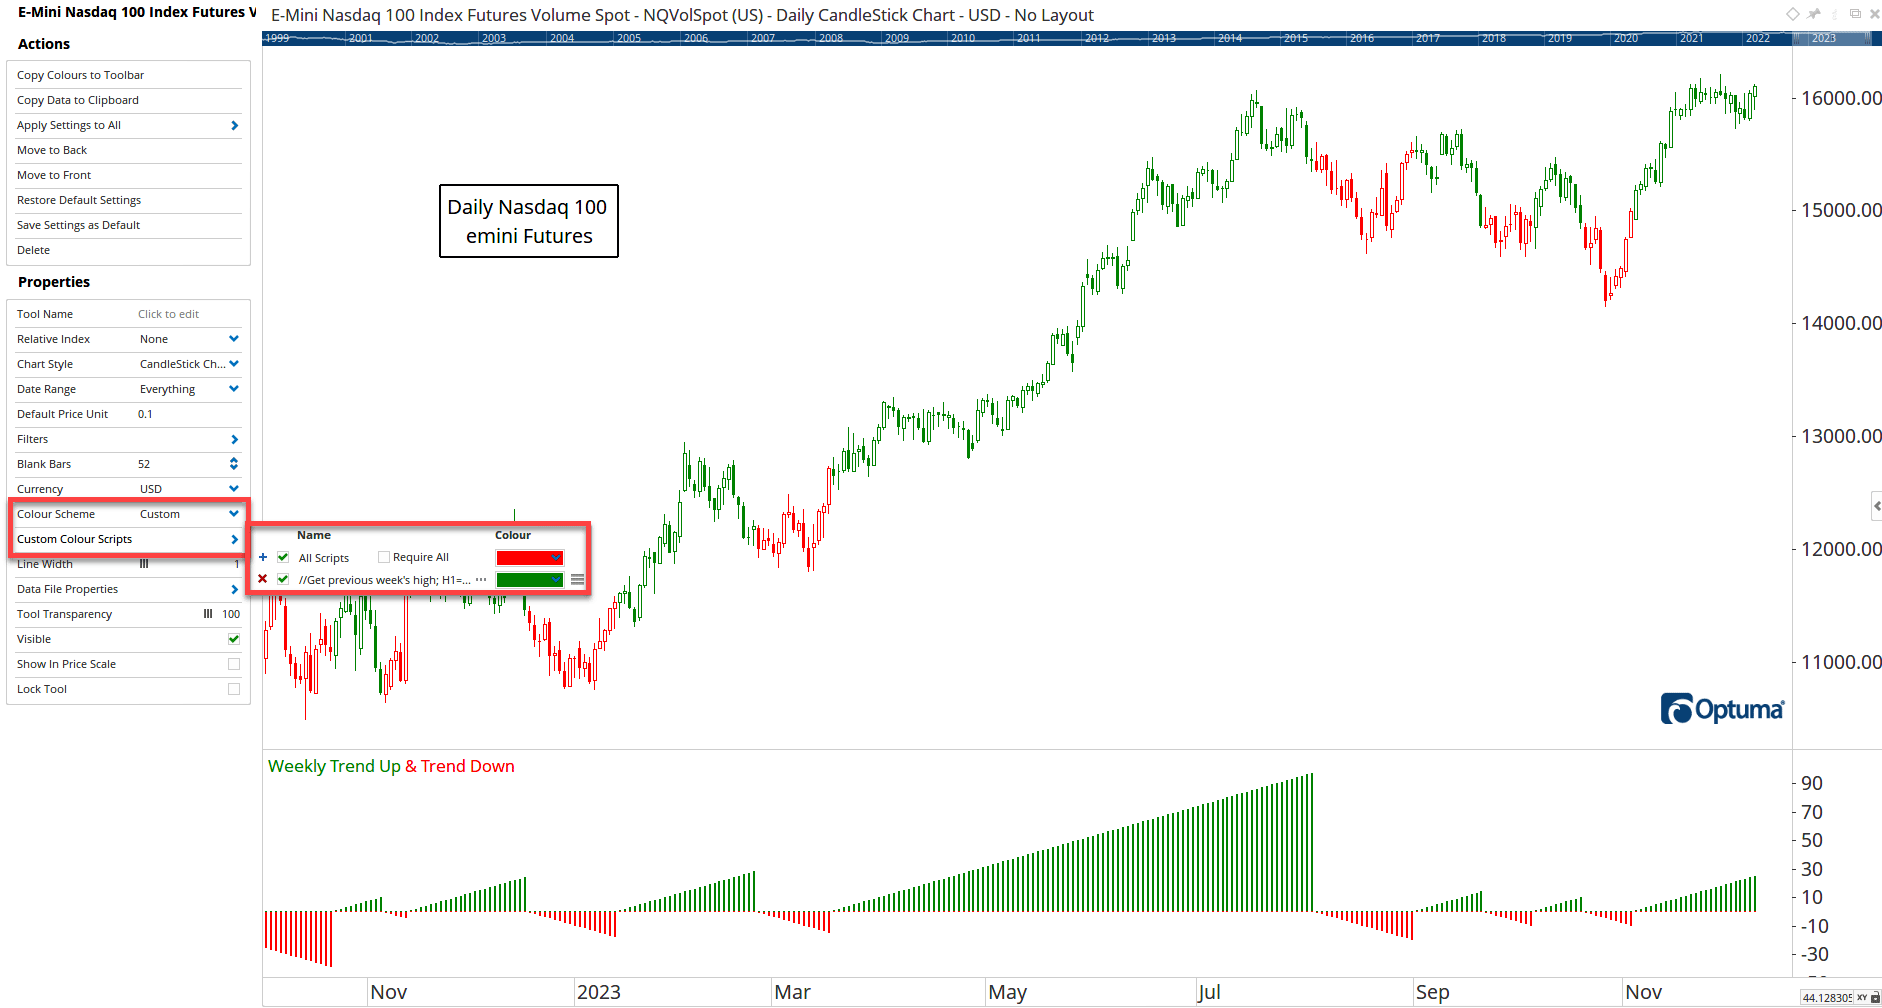
FIGURE 8: OPTUMA. This sample chart displays the weekly trend identification indicator on a chart of NASDAQ-100 emini futures.
Here is an Optuma script to color the bars green for the monthly filter histogram:
//Get previous month's high;
H1=HIGH(MONTH(PERIODAMOUNT=1)[1]);
//Get previous month's low;
L1=LOW(MONTH(PERIODAMOUNT=1)[1]);
//Get current month's close;
C1=CLOSE(MONTH(PERIODAMOUNT=1));
//Use the switch function to turn on when close > previous high until the close < previous low;
R1=SWITCH(C1>H1, C1<L1);
//Count the bars since the switch was false;
TIMESINCESIGNAL(R1==0)
For the red trend down histogram change the last line to:
TIMESINCESIGNAL(R1==1) * -1
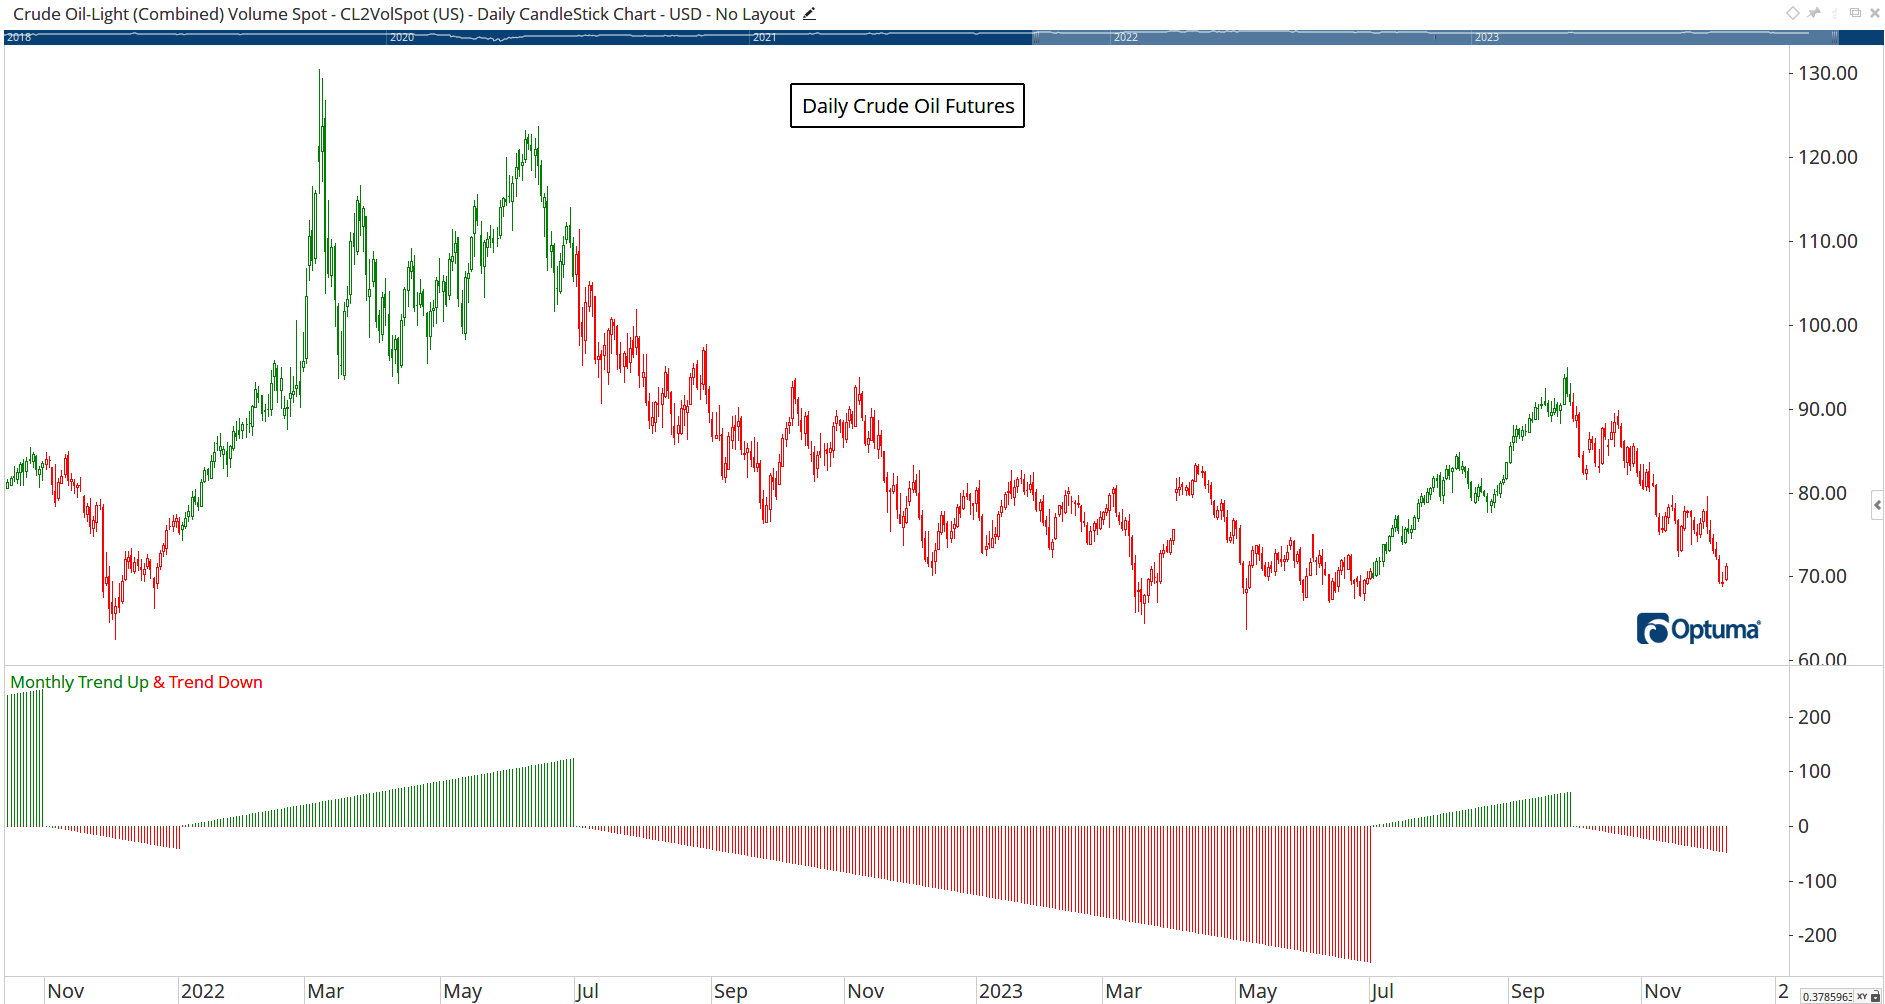
FIGURE 9: OPTUMA. This sample chart displays the monthly trend identification indicator on a chart of crude oil futures.
—support@optuma.com
BACK TO LIST

Trade Navigator: February 2024
We have created a downloadable file to make it easy to download the library based on the article in this issue, “Trend Identification By Price And Time Filtering” by Alfred François Tagher. The file name is “SC202402.”
To download it, click on Trade Navigator’s blue telephone button, select download special file, then erase the word “upgrade” and type in “SC202402.” Then click the start button. When prompted to upgrade, click the yes button. If prompted to close all software, click on the continue button. Your library will now download.
This library contains two indicators: PriceTime Filter W and PriceTime Filter M. (Figures 10 and 11 show a screenshot of the coding for these two indicators.)
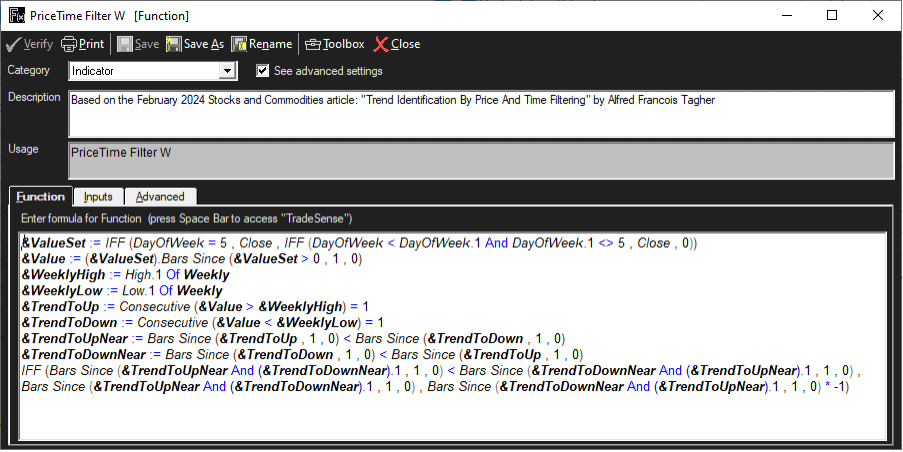
FIGURE 10: TRADE NAVIGATOR. The code shown is for the indicator named “PriceTime Filter W” for the weekly indicator.
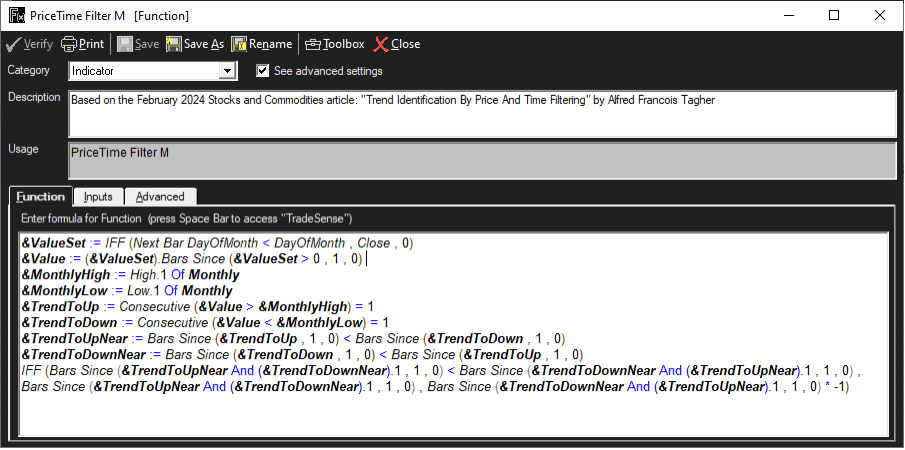
FIGURE 11: TRADE NAVIGATOR. The code shown is for the indicator named “PriceTime Filter M” for the monthly indicator.
There are four highlight bars:
PriceTime Filter W Dn
PriceTime Filter W Up
PriceTime Filter M Dn
PriceTime Filter M Up
(See Figures 12–15 for a screenshot of the coding for these four functions.)
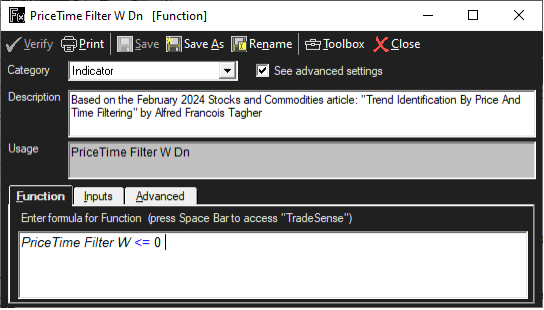
FIGURE 12: TRADE NAVIGATOR. The code shown is for the indicator named “PriceTime Filter W Dn.”
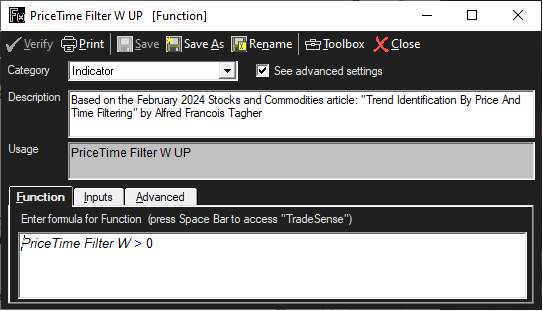
FIGURE 13: TRADE NAVIGATOR. The code shown is for the indicator named “PriceTime Filter W Up.”
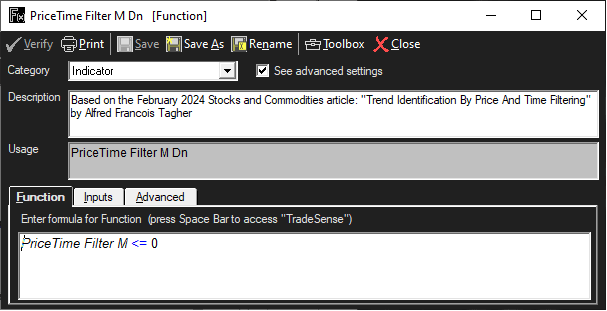
FIGURE 14: TRADE NAVIGATOR. The code shown is for the indicator named “PriceTime Filter M Dn.”
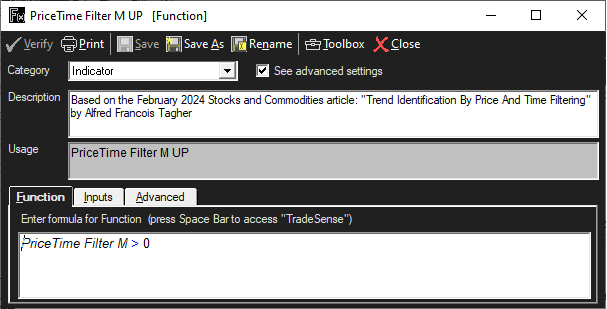
FIGURE 15: TRADE NAVIGATOR. The code shown is for the indicator named “PriceTime Filter M Up.”
It also comes with two studies, “Monthly PriceTime Filter” and “Weekly PriceTime Filter,” as well as a template named “S&C PriceTime Filter” that can be applied to your chart (see Figure 16).
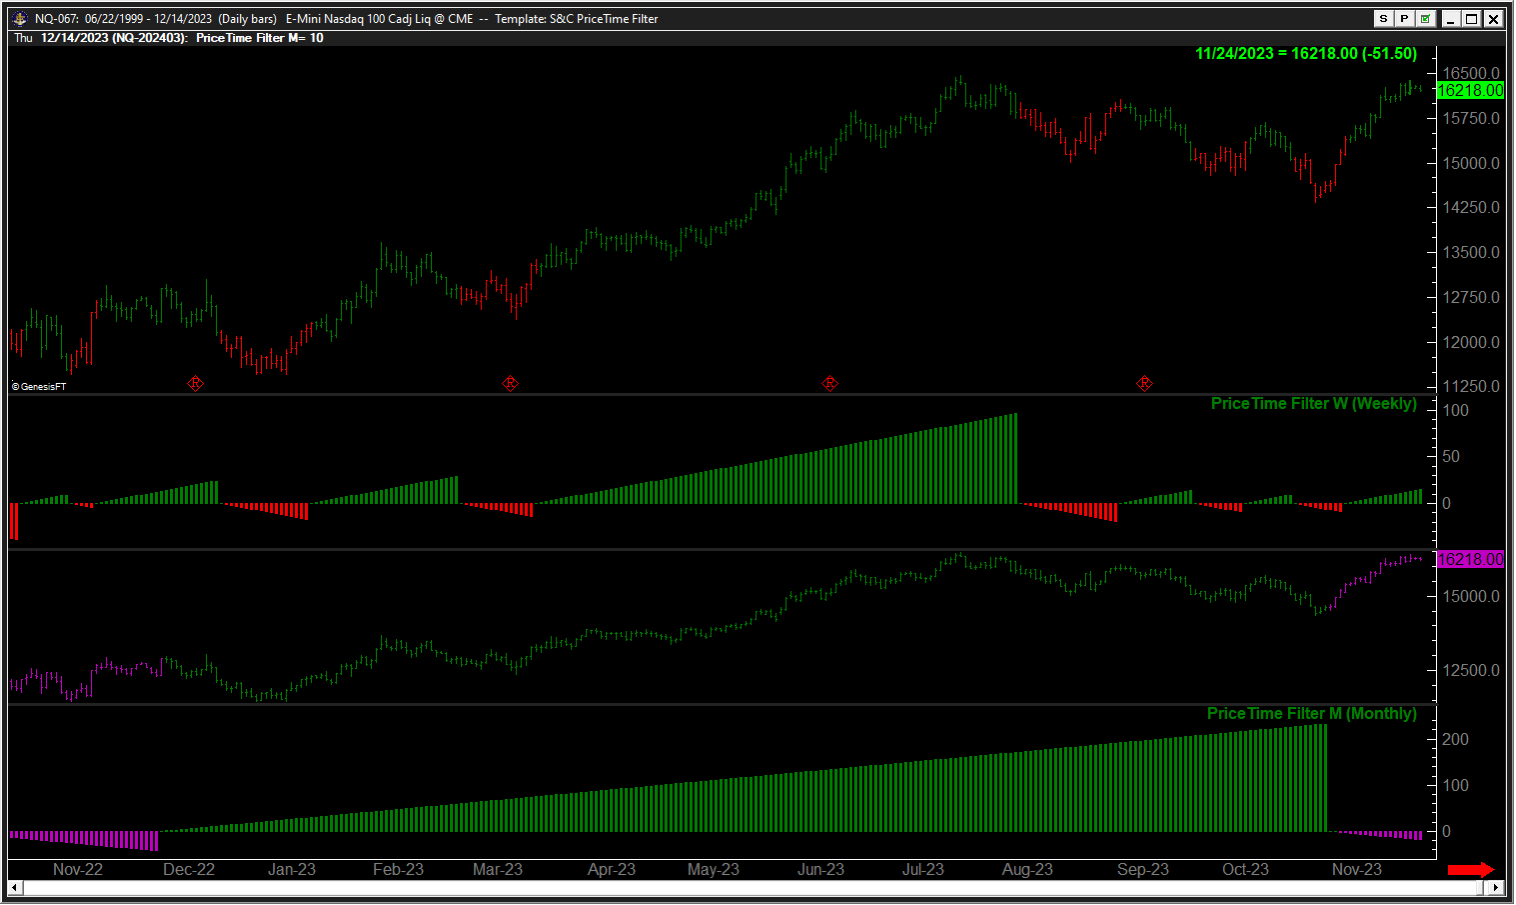
FIGURE 16: TRADE NAVIGATOR. Here, the S&C PriceTime Filter template is shown applied to a chart.
Manually creating indicators
If you would like to create these indicators manually, click on the edit dropdown menu and open the trader’s toolbox (or use CTRL + T) and click on the functions tab. Now click on the new button, and a new function dialog window will open. In its text box, input the code. Ensure that there are no extra spaces at the end of each line. When completed, click on the verify button. If all is well, when you click on the function tab, the code you entered will convert to italic font. Now click on the save button and type a name for the function.
Adding to your chart
You can insert these indicators onto your chart by opening the charting dropdown menu, selecting the “add to chart” command, then on the indicators tab, find your named indicator, select it, then click on the “add” button. Repeat this procedure for additional indicators if you wish.
Template
The template can be inserted onto your chart by opening the charting dropdown menu, then select the templates command, then select the “S&C PriceTime Filter” template.
If you need assistance using the indicators and/or template, our friendly technical support staff would be happy to help. Call 719 284-1616 or click on the live chat tool located under Trade Navigator’s help menu or near the top of the homepage. Our support hours are M–F 7am–5pm US Mountain Time. Happy Trading!
—Genesis Financial Data
Tech support 719 884-0245
www.TradeNavigator.com
BACK TO LIST
Originally published in the February 2024 issue of
Technical Analysis of STOCKS & COMMODITIES magazine.
All rights reserved. © Copyright 2024, Technical Analysis, Inc.


