TRADERS’ TIPS
March 2024

For this month’s Traders’ Tips, the focus is Richard Poster’s article in this issue, “Taming The Effects Of Whipsaw.” Here, we present the March 2024 Traders’ Tips code with possible implementations in various software.
You can right-click on any chart to open it in a new tab or window and view it at it’s originally supplied size, often much larger than the version printed in the magazine.
The Traders’ Tips section is provided to help the reader implement a selected technique from an article in this issue or another recent issue. The entries here are contributed by software developers or programmers for software that is capable of customization.

TradeStation: March 2024
In the article “Taming The Effects Of Whipsaw” in this issue, author Richard Poster explains the process of utilizing a whipsaw filter to identify and manage whipsaw data, thereby diminishing the likelihood of false entry signals in a strategy centered on trend following. The number of alternating up and down zigzag segments within a window is tracked to create a rate of directional change (RODC) that is smoothed over a specified period. The RODC declines in trending environments and increases with whipsaw movements.
Indicator: Rate of Directional Change (RODC)

// TASC MAR 2024
// Rate of Directional Change (RODC)
// RODC based on zigzag
// Copyright 2023–2024, Richard Poster

inputs:
	int BkData( 30 ),   // Window
	double Lamda( 15.0 ),   // Zigzag Threshold
	int PerSmth( 3 );   // Smooth Period

variables:
		int NumUp( 0 ),
		int NumDn( 0 ),
		int NumUD( 0 ),
		int Idx( 0 ),
		bool ModeUp( false ),
		double Digits( 0 ),
		double ExtZigzag( 0 ),
		double OneTick( 0 ),
		double LamUp( 0.0 ),
		double LamDn( 0.0 ),
		double MULT( 0 ),
		double Smoothed( 0 ),
		double Xcls( 0 ),
		double Xext( 0 );

once
begin
	OneTick = MinMove / PriceScale;
	Digits = NumDecimals(PriceScale);
	MULT = Iff(Digits = 5 or Digits = 3, 10, 1);
	LamUp = Lamda;
	LamDn = Lamda;
end;

NumUp = 1; // Assume starting in mode up
NumDn = 0;
NumUD = 1;
ModeUp = true; // Starting value
Xext = Close[BkData];

for Idx = 1 to BkData - 1
begin
    Xcls = Close[Idx];

    if ModeUp = false then
    begin
        if Xext > Xcls then // Still mode down
        begin
            Xext = Xcls;
        end
        else if (Xcls - Xext)
         / (MULT * OneTick) >= LamDn then
        begin
        	// New mode
            ModeUp = true;
            Xext = Xcls;
            NumUp += 1; // Increment up mode counter
            NumUD += 1; // Increment mode counter
        end;
    end
    else
    begin
        if Xext < Xcls then // Still mode up
        begin
            Xext = Xcls;
        end
        else if (Xcls - Xext)
         / (MULT * OneTick) <= -LamUp then
        begin
        	// New mode
 			ModeUp = false;
 			Xext = Xcls;
 			NumDn += 1; // Increment down mode counter
 			NumUD += 1; // Increment mode counter
 		end;
 	end;
end;

if NumUD = 0 then // Trend length > window size
	ExtZigzag = 100 / BkData
else
	ExtZigzag = 100 * NumUD / BkData;

Smoothed = Average( ExtZigzag, PerSmth );
Plot1( Smoothed, "RODC" );
A sample chart is shown in Figure 1.

FIGURE 1: TRADESTATION. A TradeStation 60-minute chart of EURUSD shows a portion of December 2023 with the study applied.
This article is for informational purposes. No type of trading or investment recommendation, advice, or strategy is being made, given, or in any manner provided by TradeStation Securities or its affiliates.
—John Robinson
TradeStation Securities, Inc.
www.TradeStation.com
BACK TO LIST

Wealth-Lab.com: March 2024
A large part of the coding for the rate of directional change indicator (RODC), discussed in Richard Poster’s article in this issue titled “Taming The Effects Of Whipsaw,” is natively encapsulated in WealthLab’s PeakTroughCalculator class. We simply created a SegmentCount routine the navigates and counts the segments in the PeakTrough list generated by calculator, storing the result in a TimeSeries that becomes the RODC indicator after applying simple moving average smoothing.
Here, you’ll find the code to mock up an RODC indicator in Wealth-Lab. We didn’t apply the RODC to a trading strategy, but you can use the sliders to see how changing parameters affect the indicator. The reversal parameter is set up for forex pips. You’ll need much larger values to produce a zigzag for stocks or futures contracts.
A sample chart is in Figure 2 showing the rate of directional change (RODC) indicator plotted with a close-to-close ZigZig.

FIGURE 2: WEALTH-LAB. Here you see an example of the rate of directional change (RODC) indicator plotted with a close-to-close ZigZig.
using WealthLab.Backtest;
using System;
using WealthLab.Core;
using WealthLab.Data;
using WealthLab.Indicators;
using System.Collections.Generic;

namespace WealthScript2023
{
	public class TASCMarch2024 : UserStrategyBase
	{
		TimeSeries _rodc;
		PeakTroughCalculator _ptc;

		public TASCMarch2024()
		{
			AddParameter("Reversal Pips", ParameterType.Int32, 15, 10, 50, 5);
			AddParameter("Window Bars", ParameterType.Int32, 30, 20, 50, 5);
			AddParameter("Smoothing Bars", ParameterType.Int32, 3, 1, 10, 1);
		}

		public override void Initialize(BarHistory bars)
		{
			double reversal = Parameters[0].AsInt / 10000d;
			int window = Parameters[1].AsInt;
			int smooth = Parameters[2].AsInt;
			DrawHeaderText($"Reversal: {reversal:N4} pts", WLColor.Gold, 14);

			// show the zigzag
			ZigZag zz = ZigZag.Series(bars.Close, reversal, PeakTroughReversalType.Point, false);
			PlotIndicator(zz, WLColor.Gold, PlotStyle.ZigZag);

			// _rodc indicator
			_ptc = new PeakTroughCalculator(bars.Close, reversal, PeakTroughReversalType.Point);
			_rodc = new TimeSeries(bars.DateTimes, 0);

			for (int n = window; n < bars.Count; n++)
				_rodc[n] = SegmentCount(n, _ptc, window);

			_rodc = 100 * _rodc / window;
			_rodc = SMA.Series(_rodc, smooth);	// smoothing

			PlotTimeSeries(_rodc, $"RODC({window}, {smooth})", "_rodc", WLColor.NeonGreen);
		}

		int SegmentCount(int bar, PeakTroughCalculator ptc, int lookback)
		{
			int count = 0;	// author's code initializes "nUD" count to 1
			PeakTrough pt = ptc.GetPeakTrough(bar);

			while (pt != null && bar - pt.DetectedAtIndex < lookback)
			{
				count++;
				pt = ptc.GetPrevPeakTrough(pt);
			}
			return count;
		}

		public override void Execute(BarHistory bars, int idx)
		{
			// use _rodc in your trading rules here
		}
	}
}
—Robert Sucher
Wealth-Lab team
www.wealth-lab.com
BACK TO LIST

NinjaTrader: March 2024
The smoothed rate of directional change indicator discussed in the article “Taming The Effects Of Whipsaw” by Richard Poster in this issue is available for download at the following link for NinjaTrader 8:
Once the file is downloaded, you can import the indicator into NinjaTrader 8 from within the control center by selecting Tools → Import → NinjaScript Add-On and then selecting the downloaded file for NinjaTrader 8.
You can review the indicator source code in NinjaTrader 8 by selecting the menu New → NinjaScript Editor → Indicators folder from within the control center window and selecting the file.
A sample chart displaying the indicator is shown in Figure 3.

FIGURE 3: NINJATRADER. The smoothed rate of directional change indicator is plotted here on a 60-minute chart of EURUSD.
NinjaScript uses compiled DLLs that run native, not interpreted, to provide you with the highest performance possible.
—NinjaTrader, LLC
www.ninjatrader.com
BACK TO LIST

TradingView: March 2024
This TradingView Pine Script code implements the rate of directional change (RODC) indicator discussed in “Taming The Effects Of Whipsaw” in this issue by Richard Poster.
//  TASC Issue: March 2024 - Vol. 42, Issue 3
//     Article: Taming The Effects Of Whipsaw.
//              Improve Trading Performance With
// 				A Whipsaw Filter.
//  Article By: Richard Poster
//    Language: TradingView's Pine Script™ v5
// Provided By: PineCoders, for tradingview.com


//@version=5
string title = 'TASC 2024.03 Rate of Directional Change'
string stitle = 'RODC'
indicator(title, stitle, false)


// --- Global ---
DIGITS = syminfo.pricescale
float MULT = 1.0
float _point = syminfo.mintick
float lamUp = 1.0
float lamDn = 1.0


// --- Inputs ---
int  bkData = input.int(30, "Window")
float lamda = input.float(15.0, "Zigzag Threshold")
int perSmth = input.int(3, "Smooth Period")


// --- Indicator initialization ---
if(DIGITS == 100000 or DIGITS == 1000)
    MULT  := 10.0
    lamUp := lamda
    lamDn := lamda


// --- Main loop ---
// Initialize for each bar, assuming mode up
bool modeUp = true
int     nUp = 1    // up mode counter
int     nDn = 0    // down mode counter
int     nUD = 1    // node counter for new mode
// Iterate over bars within lookback window
int   limit = bkData + perSmth + 1
if bar_index > limit
    float xext = close[bkData]
    for jj = bkData - 1 to 0
        float xcls = close[jj]
        if not modeUp
            if xext > xcls
                // still mode down
                xext := xcls
            else
                if ((xcls-xext)/(MULT*_point)) >= lamDn
                    // reversal to mode up
                    modeUp := true
                    nUp    += 1
                    nUD    += 1
                    xext   := xcls
        else
            if modeUp
                if xext < xcls
                    // still mode up
                    xext := xcls
                else
                    if ((xcls-xext)/(MULT*_point)) <= -lamUp
                        // reversal to mode down
                        modeUp := false
                        nDn    += 1
                        nUD    += 1
                        xext   := xcls
// Calculate RDOC indicator
float RDOC = nUD==0?(100.0/bkData):(100.0*(nUD/bkData))
// Calculate smoothed RDOC
float smaRDOC = ta.sma(RDOC, perSmth)


// --- Plotting ---
plot(smaRDOC, 'RDOC Smoothed', color.blue, 2)
The indicator is available on TradingView from the PineCodersTASC account: https://www.tradingview.com/u/PineCodersTASC/#published-scripts.
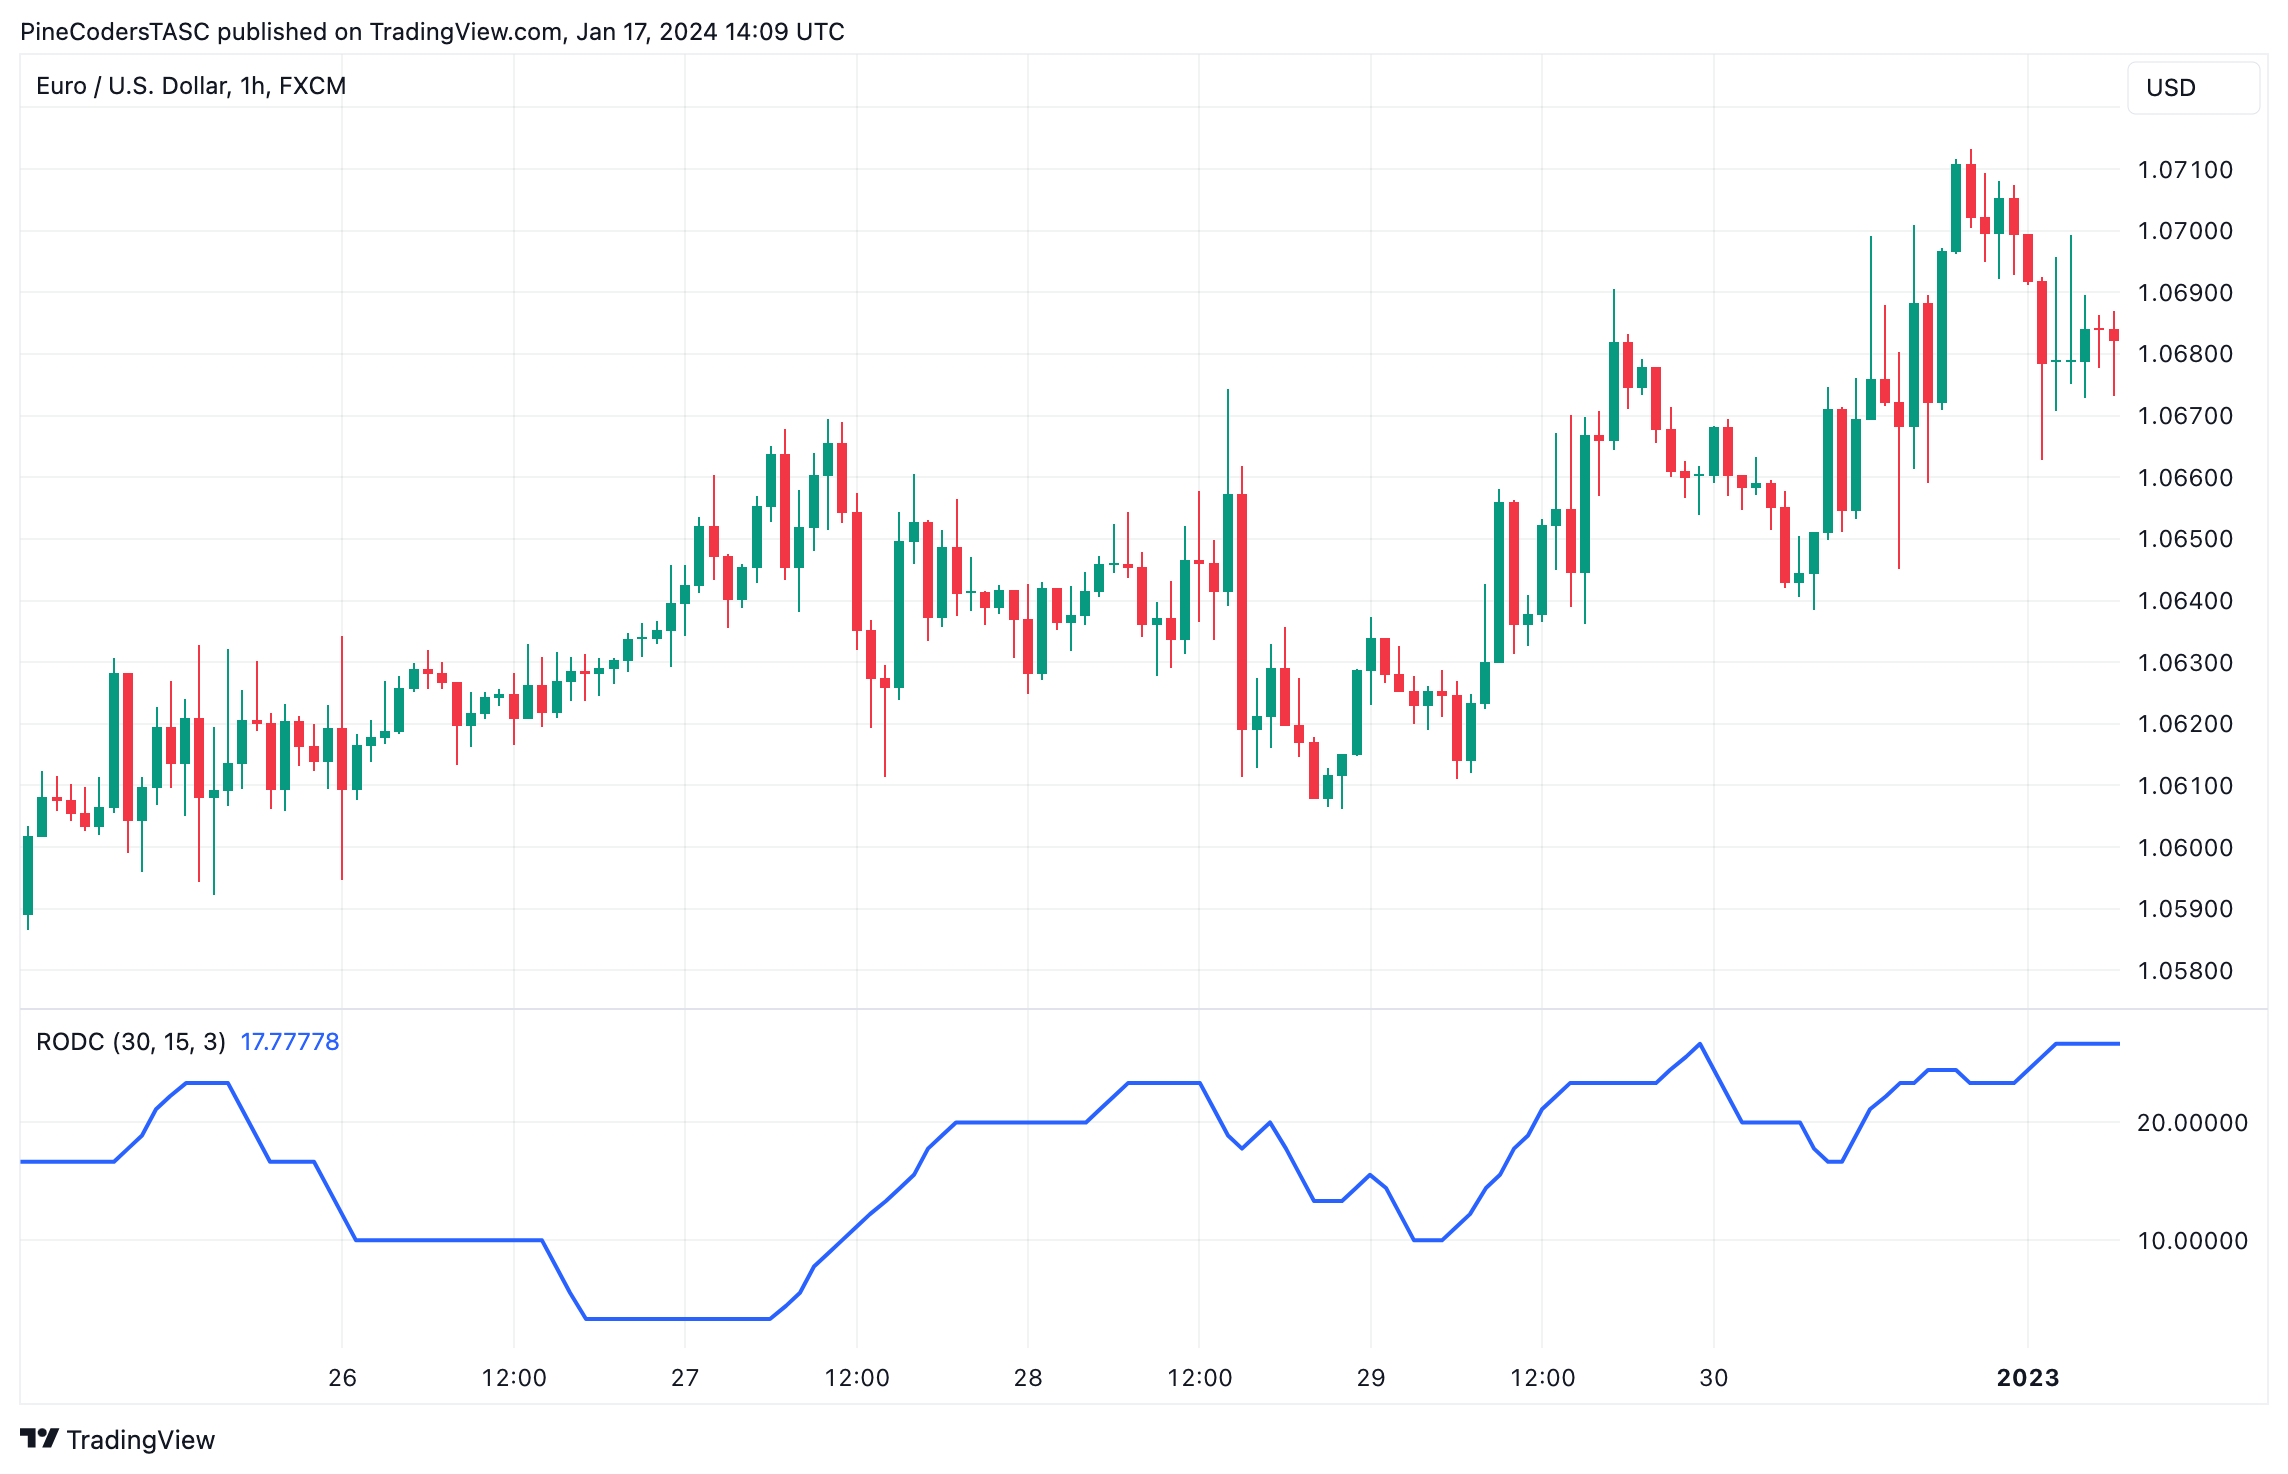
An example chart displaying the indicator in TradingView is shown in Figure 4.

FIGURE 4: TRADINGVIEW. The rate of directional change indicator (RODC 30/15/3) is plotted here on a 60-minute chart of EURUSD.
—PineCoders, for TradingView
www.TradingView.com
BACK TO LIST

Neuroshell Trader: March 2024
To implement the rate of direction change (RODC) indicator in NeuroShell Trader, simply select “New indicator…” from the insert menu and use the indicator wizard to create the following indicator:
NumSegments:	Sum(A<B(Momentum(TPbars(High,Low,Close,3,1,0),1),0), BARS)
RODC: 		Mul2(100,Divide(NumSegments, BARS))
To calculate the average zigzag duration during analysis and modeling of whipsaws, simply create the indicator shown here:
AvgDuration: Avg2(PVmeanbars(High,Low,3, BARS),VPmeanbars(High,Low,3, BARS))
The TPbars, PVmeanbars and VPmeanbars indicators can be found in Turning Points add-on.
A sample chart is in Figure 5 showing the RODC and AvgDuration for EUR/USD.

FIGURE 5: NEUROSHELL TRADER. This NeuroShell Trader chart shows the RODC and AvgDuration for EUR/USD.
Users of NeuroShell Trader can go to the Stocks & Commodities section of the NeuroShell Trader free technical support website to download a copy of this or any previous Traders’ Tips.
—Ward Systems Group, Inc.
sales@wardsystems.com
www.neuroshell.com
BACK TO LIST

RealTest: March 2024
In “Taming The Effects Of Whipsaw” in this issue, Richard Poster introduces a filter based on the rate of directional change (RODC) indicator and the principles of zigzag.
Here is coding in text format for use in RealTest (mhptrading.com) that implements the author’s technique:
Parameters:
    lookback:    30
    pips:    60 // produces about as many flips in 150 days as 15 does in 150 hours
    smoothing:    3

Data:
    // zigzag is calculated as a self-referential data array
    // abs(zigzag) is latest peak or trough price
    // sign(zigzag) is the direction flag

    zigzag:    if(barnum = 1, c,
            if(zigzag[1] < 0,
                if(c > -zigzag[1] * (1 + pips/10000), c, -min(-zigzag[1], c)),
            // else
                if(c < zigzag[1] * (1 - pips/10000), -c, max(zigzag[1], c))))

    flip:     sign(zigzag) <> sign(zigzag[1])

    flips:    100 * Sum(flip, lookback) / lookback

    RDOC:    Avg(flips, smoothing)

Charts:
    zigzag:    abs(zigzag)
    flip:    if(flip, sign(zigzag), 0) {^}
    RDOC:    rdoc {|}
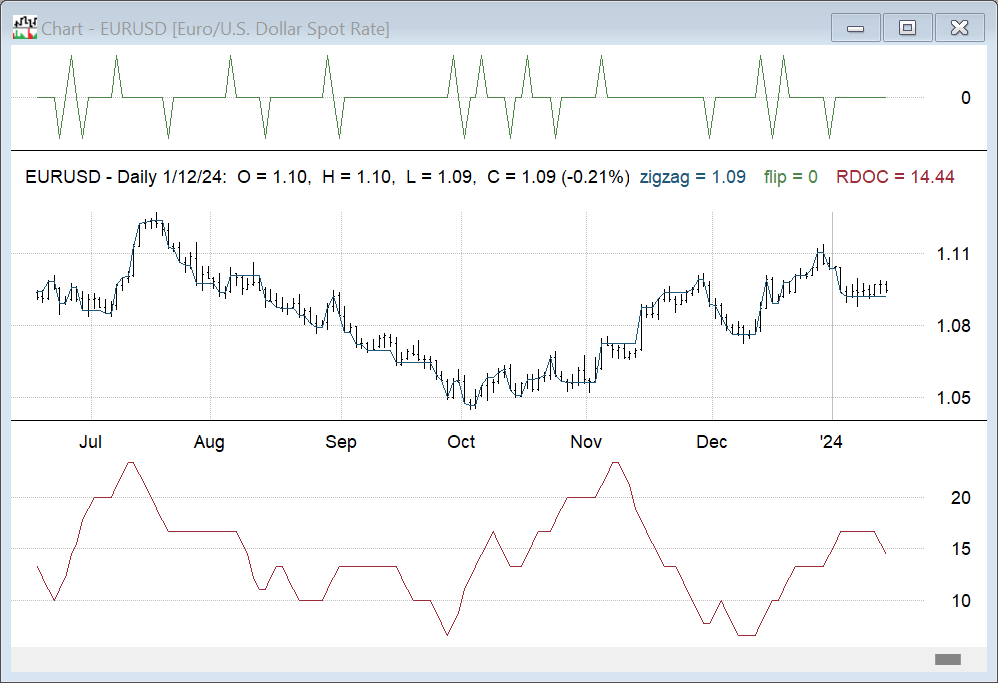
Figure 6 shows a ReatTest chart with RODC (lower pane) calculated for 150 daily bars of EURUSD.

FIGURE 6: REALTEST. This example chart shows the rate of directional change (RODC) in the lower pane, calculated for 150 daily bars of EURUSD. The upper pane shows where the flips occur, and the zigzag peak or trough price line is plotted on the price bars.
Note that the example chart in Poster’s article shows 150 hourly bars. Since RealTest does not have hourly data, we adjusted the pips parameter to produce the equivalent number of zigzag flips in 150 days as the author showed for 150 hours.
The upper pane shows where the flips occur, and the zigzag peak or trough price line is plotted on the price bars.
—Marsten Parker
MHP Trading, Mhptrading.com
mhp@mhptrading.com
BACK TO LIST
Originally published in the March 2024 issue of
Technical Analysis of STOCKS & COMMODITIES magazine.
All rights reserved. © Copyright 2024, Technical Analysis, Inc.


