TRADERS’ TIPS
August 2024

For this month’s Traders’ Tips, the focus is Buff Pelz Dormeier’s article in this issue, “Volume Confirmation For A Trend System.” Here, we present the August 2024 Traders’ Tips code with possible implementations in various software.
You can right-click on any chart to open it in a new tab or window and view it at it’s originally supplied size, often much larger than the version printed in the magazine.
The Traders’ Tips section is provided to help the reader implement a selected technique from an article in this issue or another recent issue. The entries here are contributed by software developers or programmers for software that is capable of customization.

TradingView: August 2024
The following Pine Script code for TradingView implements the ADX, the trend thrust indicator (TTI), and the volume price confirmation indicator (VPCI) that constitutes the trend-following trading system described in Buff Dormeier’s article in this issue, “Volume Confirmation For A Trend System.”
//  TASC Issue: August 2024 - Vol. 42
//     Article: Volume Confirmation For A Trend System.
//              The Trend Thrust Indicator And
//              Volume Price Confirmation Indicator.
//  Article By: Buff Pelz Dormeier
//    Language: TradingView's Pine Scriptª v5
// Provided By: PineCoders, for tradingview.com


//@version=5
string title = 'TASC 2024.08 Volume Confirmation For A Trend System'
string stitle = 'VCTS'
strategy(title, stitle, false)


// Input
lenADX  = input.int(14, 'ADX Length', 1)
smt     = input.int(14, 'ADX Smoothing', 1, 50)
fastTTI = input.int(13, 'TTI Fast Average', 1)
slowTTI = input.int(26, 'TTI Slow Average', 1)
smtTTI  = input.int(9,  'TTI Signal Length', 1)
shortVP = input.int(5,  'VPCI Short-Term Average', 1)
longVP  = input.int(25, 'VPCI Long-Term Average', 1)


// ADX
upDM =  ta.change(high)
dwDM = -ta.change(low)
pDM  = na(upDM) ? na : upDM > dwDM and upDM > 0 ? upDM : 0
mDM  = na(dwDM) ? na : dwDM > upDM and dwDM > 0 ? dwDM : 0
ATR  = ta.atr(lenADX)
pDI  = fixnan(100 * ta.rma(pDM, lenADX) / ATR)
mDI  = fixnan(100 * ta.rma(mDM, lenADX) / ATR)
ADX  = 100*ta.rma(math.abs((pDI - mDI) / (pDI + mDI)), smt)


// TTI
// ref: https://www.tradingview.com/script/B6a7HzVn/
fastVWMA = ta.vwma(close, fastTTI)
slowVWMA = ta.vwma(close, slowTTI)
VWMACD   = fastVWMA - slowVWMA
volMult  = math.pow((fastVWMA / slowVWMA), 2)
VEFA     = fastVWMA * volMult
VESA     = slowVWMA / volMult
TTI      = VEFA - VESA
signal   = ta.sma(TTI, smtTTI)


// VPCI
// ref: https://www.tradingview.com/script/n8puJoAS/
VPC      = ta.vwma(close, longVP) - ta.sma(close, longVP)
VPR      = ta.vwma(close, shortVP) / ta.sma(close, shortVP)
VM       = ta.sma(volume, shortVP) / ta.sma(volume, longVP)
VPCI     = VPC * VPR * VM


// Plot
col1  = #4daf4a50
col2  = #e41a1c20
col0  = #ffffff00
adxL1 = plot(ADX,    "ADX", #984ea3)
adxL0 = plot(30,     "ADX Threshold", #984ea350)
ttiL1 = plot(TTI,    "TTI", #ff7f00)
ttiL0 = plot(signal, "TTI Signal", #ff7f0050)
vpcL1 = plot(VPCI*10,"VPCI", #377eb8)
vpcL0 = plot(0,      "VPCI Zero", #377eb850)
fill(adxL1, adxL0, ADX > 30 ? col1 : col0)
fill(ttiL1, ttiL0, TTI > signal ? col1 : col0)
fill(vpcL1, vpcL0, VPCI > 0 ? col1 : col2)


// Strategy entry/exit rules
if ADX > 30
    if TTI > signal
        if VPCI > 0
            strategy.entry("entry", strategy.long)
if VPCI < 0
    strategy.close_all('exit')
The script is available on TradingView from the PineCodersTASC account: https://www.tradingview.com/u/PineCodersTASC/#published-scripts.
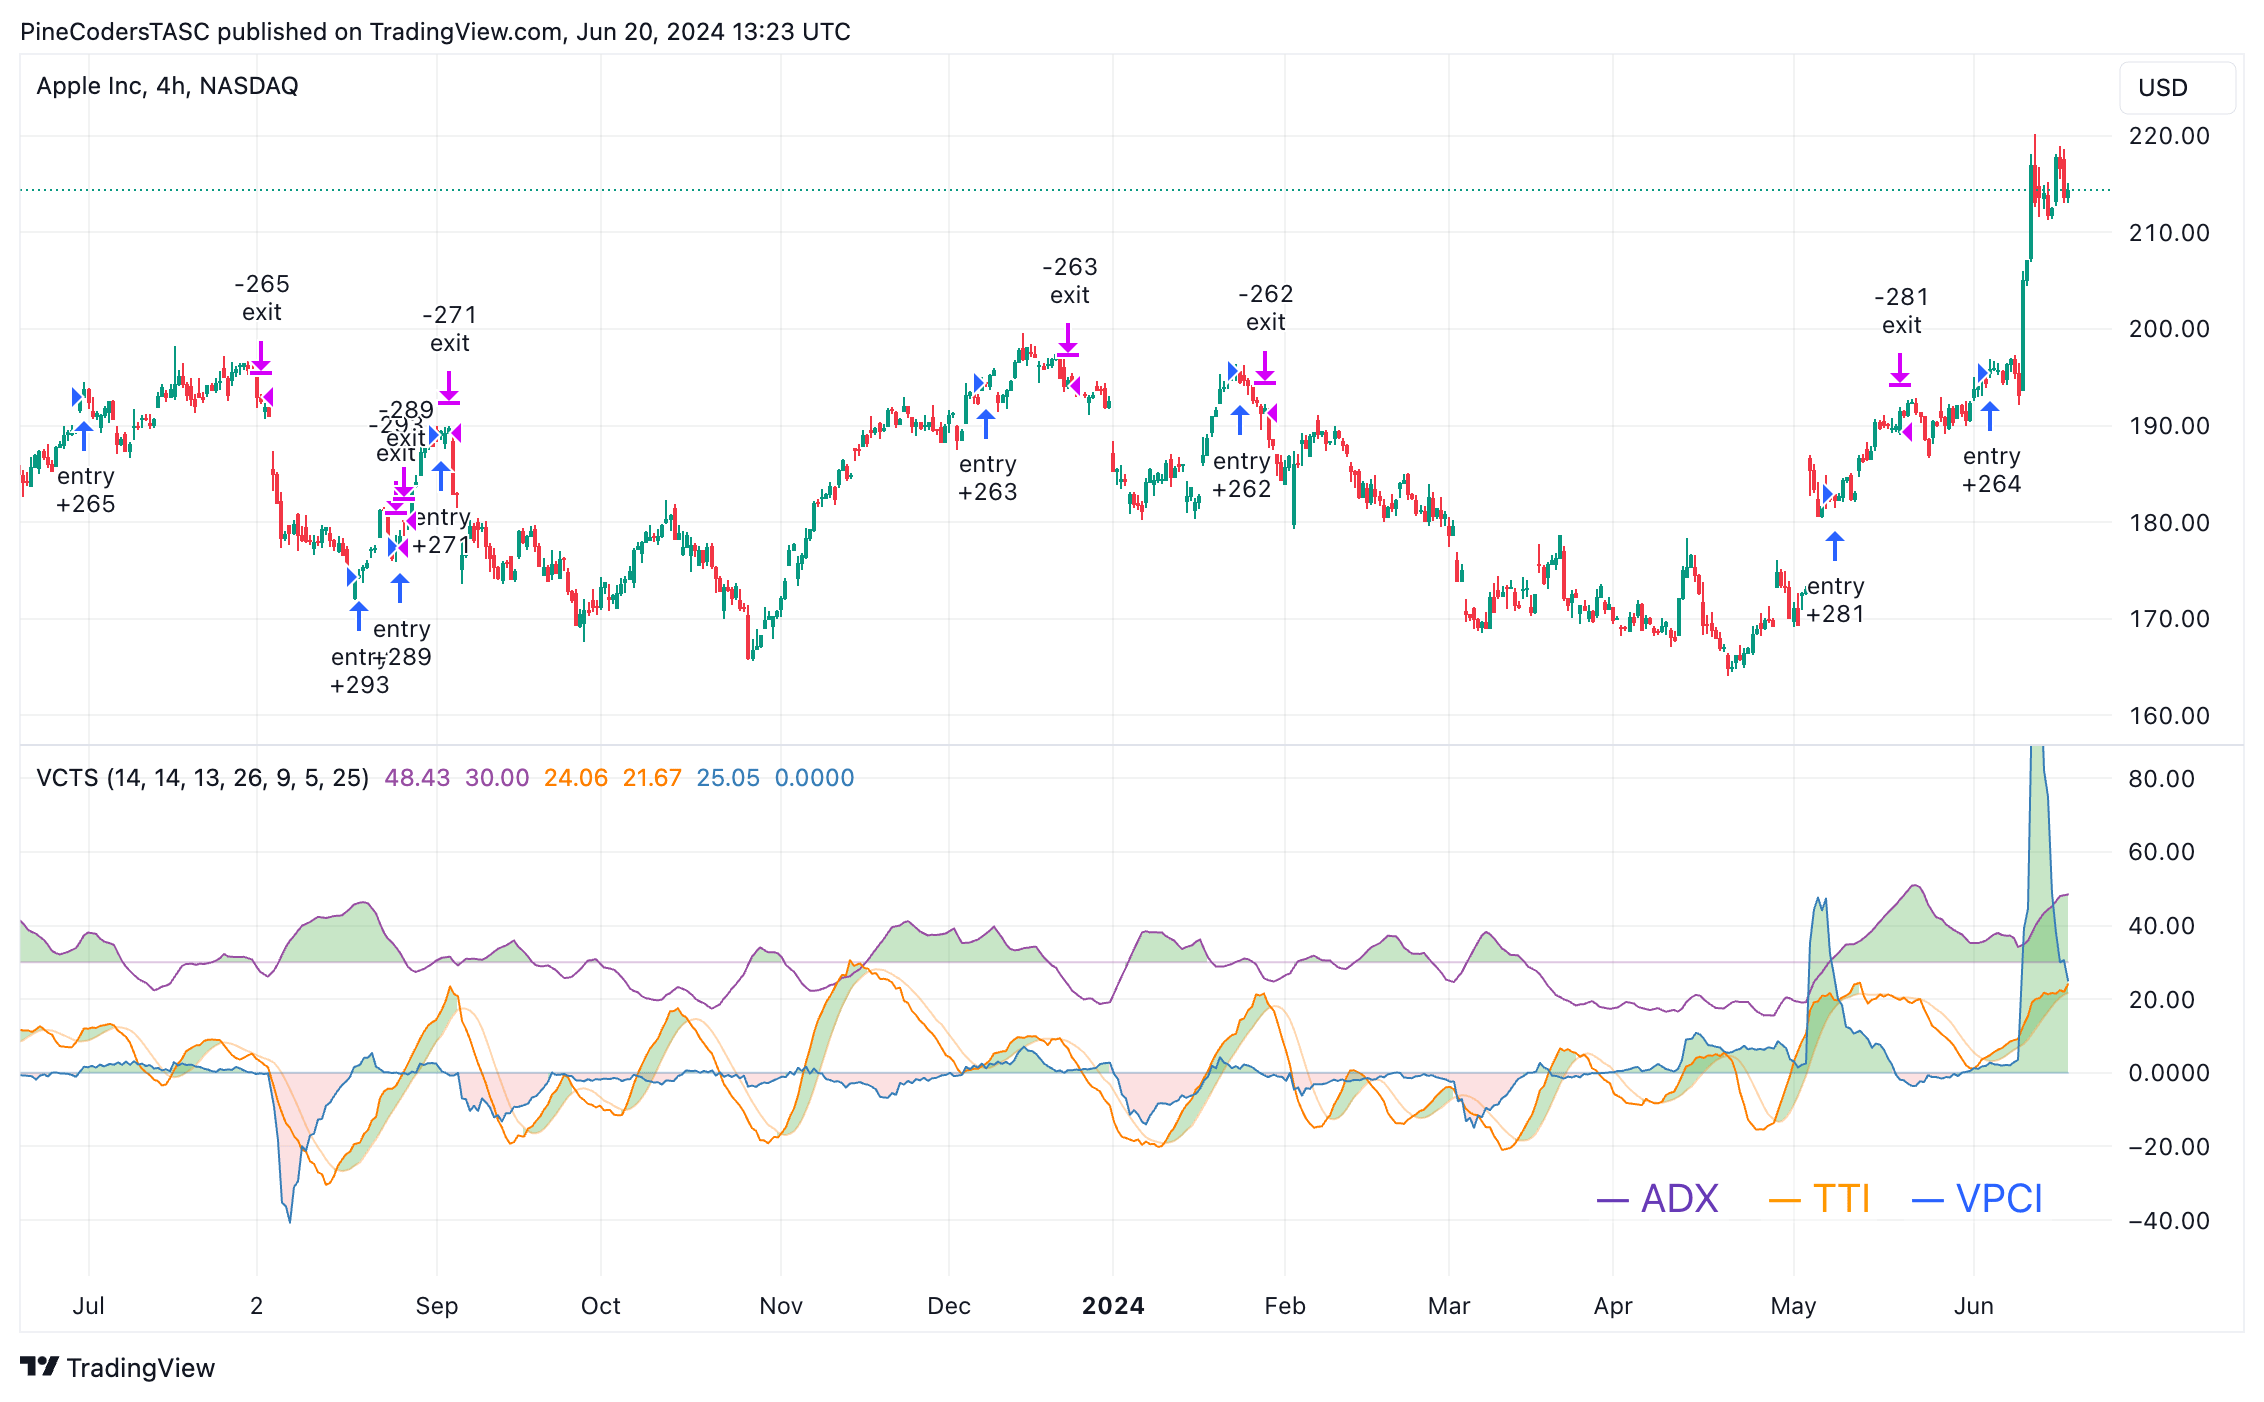
An example chart is shown in Figure 1.

FIGURE 1: TRADINGVIEW. This demonstrates the trend-following trading system using the ADX, the trend thrust indicator (TTI), and the volume price confirmation indicator (VPCI).
—PineCoders, for TradingView
www.TradingView.com
BACK TO LIST

RealTest: August 2024
In “Volume Confirmation For A Trend System” in this issue, Buff Dormeier discusses several indicators and discusses his development of a trend-following system based on the indicators. Provided here is a RealTest script that implements the indicators and backtests. There are some notes in the script itself providing some additional details about the script.
Notes:
	Buff Pelz Dormeier "Volume Confirmation For A Trend System", TASC, August 2024.
	Implements all the indicators mentioned in the article and used in the research.
	Shows how to run the sequence of backtests the author describes.
	This example uses Norgate data with historical index constituency series.

Import:
	DataSource:	Norgate
	IncludeList:	.S&P 500 Current & Past
	IncludeList:	SPY
	StartDate:	1993-01-01
	EndDate:	Latest
	SaveAs:	spx.rtd

Settings:
	DataFile:	spx.rtd
	StartDate:	Earliest
	EndDate:	Latest
	BarSize:	Daily
	AccountSize:	100000	// 100k
	// generates a meaningful test name when looping over the methods
	TestName:	Item("name{#}", method)

Library:
	// names for test loop output
	name1:	"MACD only"
	name2:	"MACD and OBV"
	name3:	"MACD and VPCI"
	name4:	"TTI and VPCI"

Parameters:
	// trend signal methods tested by the author
	method:	from 1 to 4 // loop over test types
	// indicator parameters
	len_macd_fast:	12
	len_macd_slow:	26
	len_macd_smooth:	9
	len_obv_smooth:	8
	len_vpci_fast:	7
	len_vpci_slow:	28
	len_vpci_smooth:	9
	len_tti_fast:	12
	len_tti_slow:	26
	len_tti_smooth:	9
	len_adx:	7

Data:
	// --- Indicator Calculations ---

	// MACD
	macd_line:	MACD(len_macd_fast, len_macd_slow)
	macd_signal:	MACDS(len_macd_fast, len_macd_slow, len_macd_smooth)
	macd_buy:	Cross(macd_line, macd_signal)
	macd_sell:	macd_line < macd_signal

	// OBV
	obv_line:	nonan(obv_line[1]) + V * sign(C - C[1])
	obv_signal:	MA(obv_line, len_obv_smooth)
	obv_confirm:	obv_line > obv_signal
	obv_sell:	obv_line < obv_signal

	// VPCI (charts match author's examples)
	vpci_fast_avg:	VWMA(C, len_vpci_fast)
	vpci_slow_avg:	VWMA(C, len_vpci_slow)
	vpci_vpc:	vpci_slow_avg - MA(C, len_vpci_slow)
	vpci_vpr:	vpci_fast_avg / MA(C, len_vpci_fast)
	vol_ratio:	MA(V, len_vpci_fast) / MA(V, len_vpci_slow)
	vpci_line:	vpci_vpc * vpci_vpr * vol_ratio
	vpci_signal:	MA(vpci_line, len_vpci_smooth)
	vpci_confirm:	vpci_line > vpci_signal
	vpci_sell:	vpci_line < vpci_signal

	// TTI (chart matches IBM example on Optuma website)
	// translated from TS code in author's Oct-2011 letter to the magazine
	tti_fast_avg:	VWMA(C, len_tti_fast)
	tti_slow_avg:	VWMA(C, len_tti_slow)
	tti_ema_diff:	EMA(C, len_tti_fast) - EMA(C, len_tti_slow)
	tti_v_factor:	VWMA(V, len_tti_fast) / EMA(V, len_tti_slow) * 10
	tti_iv_factor:	VWMA(V, len_tti_slow) / EMA(V, len_tti_fast) * 10
	tti_fast:	tti_fast_avg / (tti_v_factor / tti_iv_factor)
	tti_slow:	(tti_iv_factor / tti_v_factor) * tti_slow_avg
	tti_spread:	tti_fast - tti_slow
	tti_v_avg:	VWMA(tti_v_factor, len_tti_fast) / EMA(tti_iv_factor, tti_slow) * len_tti_smooth
	tti_avg_spread:	Round(VWMA(tti_spread, tti_v_avg), 0.001)
	tti_line:	tti_spread
	tti_signal:	tti_avg_spread
	tti_buy:	Cross(tti_line, tti_signal)

	// ADX
	adx_value:	ADX(len_adx)
	adx_buy:	adx_value > 30

	// --- Trading Signals for each method tested ---

	// MACD only
	buy1:	adx_buy and macd_buy
	sell1:	macd_sell

	// MACD and OBV
	buy2:	adx_buy and macd_buy and obv_confirm
	sell2:	obv_sell

	// MACD and VPCI
	buy3:	adx_buy and macd_buy and vpci_confirm
	sell3:	vpci_sell

	// TTI and VPCI
	buy4:	adx_buy and tti_buy and vpci_confirm
	sell4:	vpci_sell

	// Method-specific signal selection
	buy:	Item("buy{#}", method)
	sell:	Item("sell{#}", method)

Strategy: spx_stocks
	Side:	Long
	Quantity:	5
	QtyType:	Percent
	MaxExposure:	100
	// the author does not say how he ranked setups when there were too many
	// here the ADX value is used
	SetupScore:	adx_value
	EntrySetup:	buy and InSPX // was historical constituent on that date
	ExitRule:	sell

Benchmark: spy_index_hold
	Side:	Long
	EntrySetup:	Symbol=$SPY

Charts:
	// {^} means upper pane, {|} means lower pane
	// comment indicators in/out as desired
	// (realtest only supports two non-bar panes and one scale per pane)

	// MACD
//	macd_line:	macd_line {|}
//	macd_signal:	macd_signal {|}
	// OBV
//	obv_line:	obv_line {^}
//	obv_signal:	obv_signal {^}
	// VPCI
	vpci_line:	vpci_line {^}
	vpci_signal:	vpci_signal {^}
	// TTI
	tti_line:	tti_line {|}
	tti_signal:	tti_signal {|}
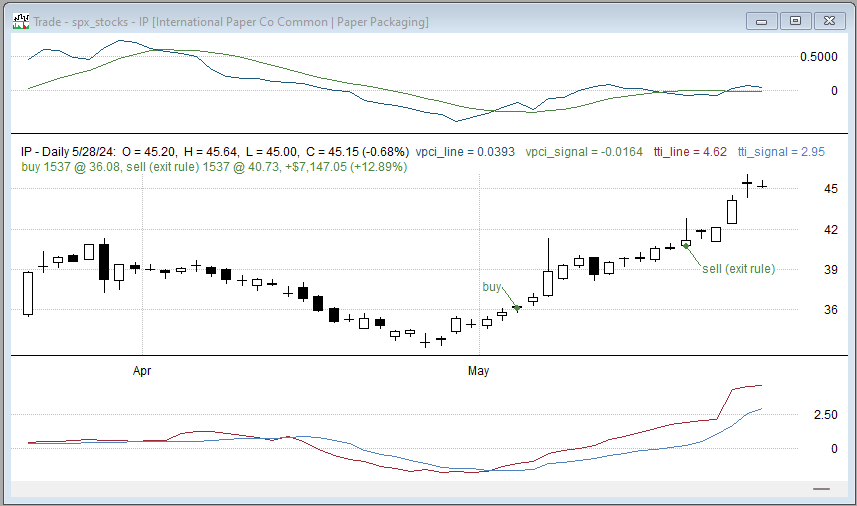
Figure 2 shows an example trade from the backtest with the VPCI and TTI plotted in the upper and lower panes.

FIGURE 2: REALTEST. This shows an example trade signal from a backtest of the trend system. The VPCI and TTI are plotted in the upper and lower panes, respectively.
—Marsten Parker
MHP Trading, Mhptrading.com
mhp@mhptrading.com
BACK TO LIST

Wealth-Lab.com: August 2024
In “Volume Confirmation For A Trend System” in this issue, Buff Dormeier discusses his development of a trend-following system based on several indicators, including the ADX, TTI, and VPCI.
Since the exact rules of the trading system aren’t given in the article, we used his description of his earlier version of the model and we modified those rules to suit his latest additions to the system, as follows:
- Assign 5% equity to a position
- ADX greater than 30
- TTI indicator crosses above its signal line
- VPCI turns up for trend confirmation
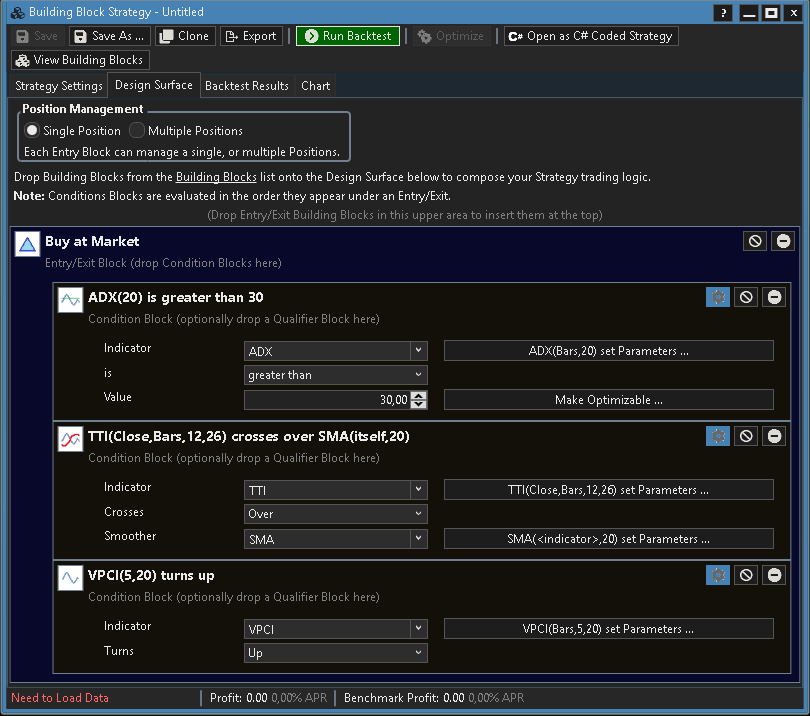
Figure 3 demonstrates using Wealth-Lab’s Building Blocks feature to express the trading system’s rules without having to use code or without having to code the rules yourself.

FIGURE 3: WEALTH-LAB. This screenshot shows the rules for the trend-following system as expressed in the Building Blocks feature, which lets the user build a system without code.
The resulting system requires you to install two Wealth-Lab Extensions to function properly:
- the latest build of Advanced Smoothers (to use the TTI indicator)
- PowerPack (to use the VPCI indicator)
As for exit rules, you could make up an exit block to mirror the VPCI condition, that is, change it to “VPCI turns down” to reflect contradicting behavior.
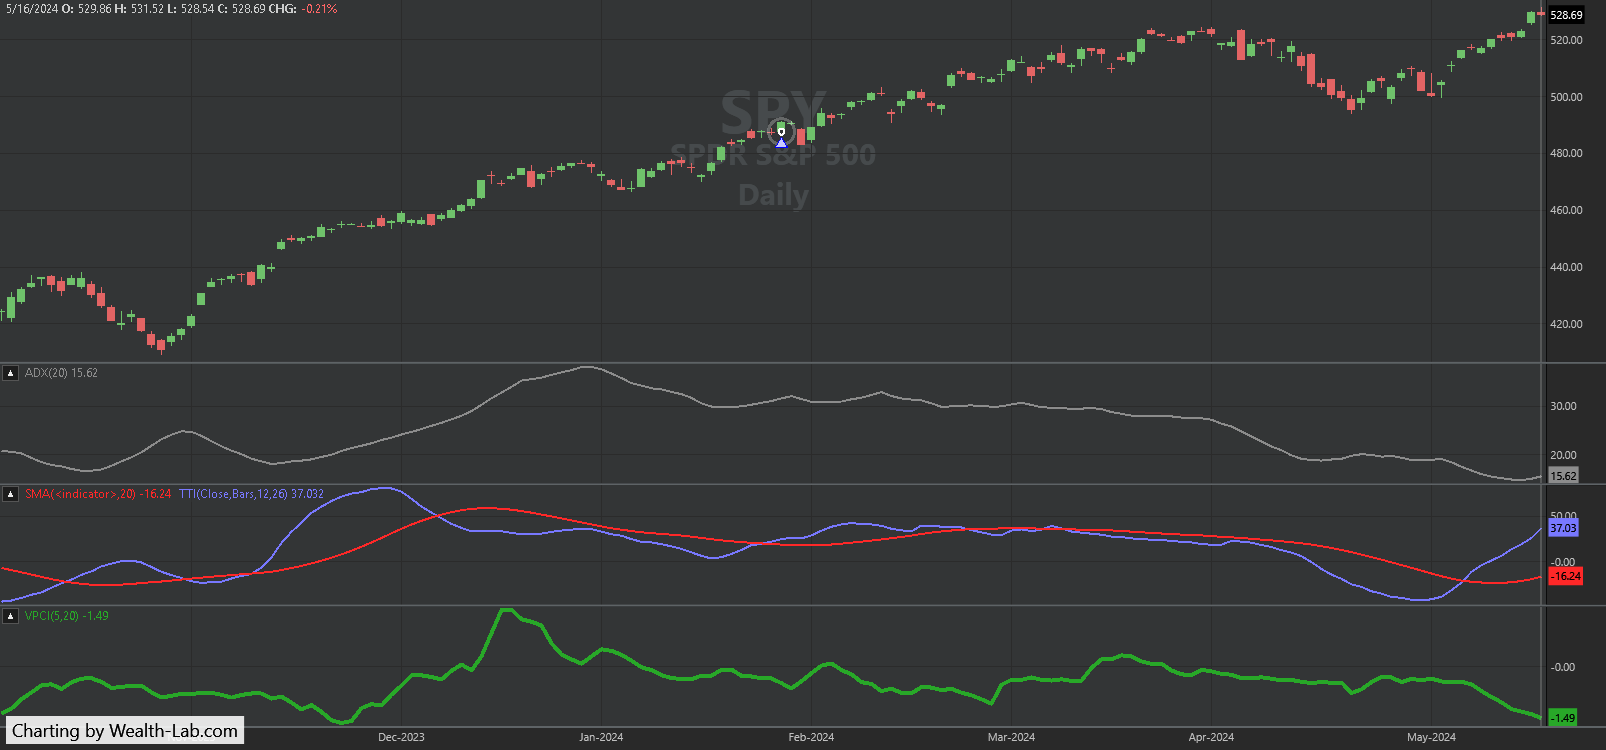
Figure 4 shows an example of the indicator combo in action, showing the TTI with its signal line and VPCI and ADX in plots at the bottom.

FIGURE 4: WEALTH-LAB. This demonstrates a sample trade signal from the trend-following system in SPY. The TTI is shown with its signal line and the VPCI and ADX are plotted in the lower panes.
—Gene Geren (Eugene)
Wealth-Lab team
www.wealth-lab.com
BACK TO LIST

Neuroshell Trader: August 2024
The volume price confirmation indicator (VPCI) can be easily implemented in NeuroShell Trader by combining a few of NeuroShell Trader’s 800+ indicators. To implement the VPCI, select “New indicator ...” from the insert menu and use the indicator wizard to create the following indicators:
VWMA:
     VolWgtMovAvg ( Close, Volume, 50 )

VPC:
     Subtract (VolWgtMovAvg ( Close, Volume, 50 ), MovAvg ( Close, 50 ) )

VPR:
     Divide (VolWgtMovAvg ( Close, Volume, 10 ), MovAvg ( Close, 10 )

VM:
     Divide ( MovAvg (Volume, 10 ), MovAvg (Volume, 10 ) )

VPCI:
     Multiply3 ( VPC, VPR, VM )
Users of NeuroShell Trader can go to the Stocks & Commodities section of the NeuroShell Trader free technical support website to download a copy of this or any previous Traders’ Tips.

FIGURE 5: NEUROSHELL TRADER. This example chart plots the volume price confirmation indicator (VPCI).
—Ward Systems Group, Inc.
sales@wardsystems.com
www.neuroshell.com
BACK TO LIST
Microsoft Excel: August 2024
In the article “Volume Confirmation For A Trend System” in this issue, Buff Dormeier recounts his earlier development of his volume price confirmation indicator (VPCI) and his trend thrust indicator (TTI) along with a discussion of the testing process he used over the years to validate his conclusions along the way.
The spreadsheet provided here demonstrates each of these as standalone indicators (Figure 6).

FIGURE 6: EXCEL. The spreadsheet displays the VPCI and TTI indicators.
Due to time constraints, I was not able to incorporate a trading system using either indicator, so I leave that up to the reader to do.
Instead, I recently have spent a good deal of time building a repair for a problem that began to occur when I tried to use my past spreadsheets, due to a change at the data source.
A fix for the “Who moved my cheese” historical data retrieval failure
On or just before April 15, 2024, all my Excel spreadsheets that I prepared and created for the Traders’ Tips section of this magazine began to fail (see Figure 7) when retrieving historical data.

FIGURE 7: EXCEL. On or just before April 15, 2024, my past Excel spreadsheets began to give error messages when retrieving historical data from Yahoo Finance.
The spreadsheet I am providing for this issue, the August 2024 issue, is the first that has been “adjusted” to correct the April 15, 2024 data retrieval failure caused by Yahoo Finance changing their Stock Summary web page.
The changes to Yahoo Finance’s Stock Summary web page took effect on, or slightly before, April 15, 2024. (And yes, it is their web page after all, so they can certainly make a change to it as they please!)
It took me a while to figure out what changed in their Stock Summary feature and how to once again reliably locate the information I use in these Traders’ Tips.
The result is a complete rewrite (410 VBA code and comment lines) of my data retrieval logic as it applies to the information I need from the Yahoo Finance Stock Summary web page.
Unfortunately, there is no quick, simple fix to one or two VBA code lines, for those of you might wish to restore older Traders’ Tips to service.
To make the necessary repairs manageable, I have included in this month’s Traders’ Tips spreadsheet the capability to “fix” older spreadsheets by replacing the appropriate section of VBA code, plus a couple of code tweaks elsewhere, using the fully functional code contained in this August 2024 spreadsheet as my template.
The automation is a case of VBA code modifying VBA code and will require just a bit of intervention on your part to set the Excel application permissions to allow VBA to alter other VBA on the fly.
See the tab labeled “April 15 Repairs” (Figure 8) in this month’s spreadsheet for step-by-step instructions to get Excel permissions set correctly and then begin the process of repairing your older spreadsheets.

FIGURE 8: EXCEL. A tab labeled “April 15 Repairs” in this month’s spreadsheet gives step-by-step instructions to get Excel permissions set correctly and then begin the process of repairing older spreadsheets provided in the Traders’ Tips feature of this magazine.
See the notes tab for a bit more discussion of the problem that began on April 15, 2024 and the solution.
This Automated Repair mechanism should be able to repair any Traders’ Tips spreadsheets from May 2021 (RateOfChangeWithBands.xlsm) to May 2024 (EhlersUltimateChannelsAndBands.xlsm).
Attempting to use older spreadsheets without the fix will most likely fail, with any of a number of possible error messages and error codes.
To download this spreadsheet: The spreadsheet file for this Traders’ Tip can be downloaded here. To successfully download it, follow these steps:
- Right-click on the Excel file link, then
- Select “save as” (or “save target as”) to place a copy of the spreadsheet file on your hard drive.
—Ron McAllister
Excel and VBA programmer
rpmac_xltt@sprynet.com
BACK TO LIST

AIQ: August 2024
The AIQ code for VPCI and related indicators is given below. This code can be used to develop trading systems, or the indicator can be used as a filter for existing systems. I tried different plotted indicator displays and decided that two smoothed VPCI indicators plotted as a historigram, which shows the difference between the two smoothed indicators, would give the most useful display. The indicator plot shown in Figure 9 uses parameters of 50 and 10 days to compute the VPCI, then takes two simple averages of this VPCI using 5 days and 10 days. The difference between these two smoothed indictors is then plotted as a historigram.
!! CONNECITON & AFFINITY BETWEEN PRICE & VOLUME
! Author: Buff Dormeier, TASC July 2007
! Coded by: Richard Denning 5/11/07

! PARAMETERS
Price 	is [close].
LT	is 50.
ST	is 10.
S	is 5.
SS	is 10.

! SIMPLE MOVING AVERAGE OF PRICE (SMA)
SMA_L 	is sum(Price,LT) / LT.
SMA_S	is sum(Price,ST) / ST.
V	is [volume].

! VOLUME-WEIGHTED MOVING AVERAGE (VWMA)
VTOT_L 	is sum(V,LT).
VWMA_L	is sum(Price * (V / ^VTOT_L),LT).

VTOT_S	is sum(V,ST).
VWMA_S	 is sum(Price * (V / ^VTOT_S),ST).

! VOLUME-PRICE CONTRADICITION/CONFIRMATION (VPC + / - )
VPC	is VWMA_L - SMA_L.

! VOLUME PRICE RATIO (VPR)
VPR 	is  VWMA_S / SMA_S.

! VOLUME MULTIPLIER (VM)
VMA_S	is sum(V,ST) / ST.
VMA_L	is sum(V,LT) / LT.
VM	is VMA_S / VMA_L.

! VOLUME-PRICE CONFIRMATION INDICATOR (VPCI)
VPCI	is VPC * VPR * VM.

! SMOOTHED VOLUME-PRICE CONFIRMATION INDICATOR(sVPCI)
sVPCI	is sum(VPCI,S) / S.
ssVPCI	is sum(VPCI,SS) / SS.

! INDICATOR FOR HISTORIGRAM PLOTTING.
dsVPCIss is sVPCI - ssVPCI.

FIGURE 9: AIQ. SPY shown with 50-day VWMA (red), 10-day VWMA (yellow) and sVPCI, ssVPCI (50,10,5,10) historigram (lower indictor plot in white).
—Richard Denning
rdencpa@gmail.com
for AIQ Systems
BACK TO LIST
Originally published in the August 2024 issue of
Technical Analysis of STOCKS & COMMODITIES magazine.
All rights reserved. © Copyright 2024, Technical Analysis, Inc.


