TRADERS’ TIPS
September 2024

For this month’s Traders’ Tips, the focus is John F. Ehlers’ article in this issue, “Precision Trend Analysis.” Here, we present the September 2024 Traders’ Tips code with possible implementations in various software.
You can right-click on any chart to open it in a new tab or window and view it at it’s originally supplied size, often much larger than the version printed in the magazine.
The Traders’ Tips section is provided to help the reader implement a selected technique from an article in this issue or another recent issue. The entries here are contributed by software developers or programmers for software that is capable of customization.

TradeStation: September 2024
In “Precision Trend Analysis” in this issue, author John Ehlers describes a method for effective trend detection and confirmation. The indicator can be easily interpreted: it suggests a long position when positive and a short position when negative. Provided here are two EasyLanguage functions and the indicator itself.
Function - $HighPass

{
 $HighPass Function
 (C) 2004-2024 John F. Ehlers
}
inputs:
	Price(numericseries),
	Period(numericsimple);

variables:
	a1( 0 ),
	b1( 0 ),
	c1( 0 ),
	c2( 0 ),
	c3( 0 );

a1 = ExpValue(-1.414 * 3.14159 / Period);
b1 = 2 * a1 * Cosine(1.414 * 180 / Period);
c2 = b1;
c3 = -a1 * a1;
c1 = (1 + c2 - c3) / 4;

if CurrentBar >= 4 then
 	$HighPass = c1*(Price - 2 * Price[1] + Price[2]) +
	 c2 * $HighPass[1] + c3 * $HighPass[2];
if Currentbar < 4 then
	$HighPass = 0;


Function - $SuperSmoother

{
 SuperSmoother Function
 (C) 2004-2024 John F. Ehlers
}
inputs:
	Price(numericseries),
	Period(numericsimple);

variables:
	a1( 0 ),
	b1( 0 ),
	c1( 0 ),
	c2( 0 ),
	c3( 0 );

a1 = ExpValue(-1.414 * 3.14159 / Period);
b1 = 2 * a1 * Cosine(1.414 * 180 / Period);
c2 = b1;
c3 = -a1 * a1;
c1 = 1 - c2 - c3;

if CurrentBar >= 4 then
	$SuperSmoother = c1*(Price + Price[1]) / 2
	 + c2 * $SuperSmoother[1] + c3 * $SuperSmoother[2];
if CurrentBar < 4 then
	$SuperSmoother = Price;

Indicator – Trend Analysis

{
	TASC SEP 2024
	Trend Analysis Indicator
	(c) 2024 John F. Ehlers
}
inputs:
	Length1( 250 ),
	Length2( 40 );

variables:
	HP1( 0 ),
	HP2( 0 ),
	Trend( 0 ),
	ROC( 0 );

HP1 = $Highpass(Close, Length1);
HP2 = $Highpass(Close, Length2);
Trend = HP1 - HP2;
ROC = (Length2 / 6.28) * (Trend - Trend[1]);
Plot1(Trend, "Trend", Red );
Plot2(ROC, "ROC", Blue );
Plot3(0, "Zero", Black);
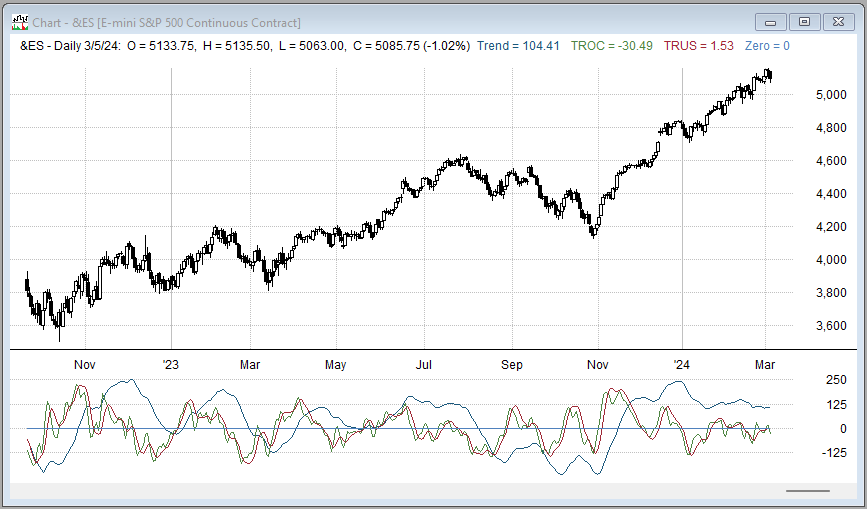
A sample chart is shown in Figure 1.

FIGURE 1: TRADESTATION. This demonstrates a daily chart of the emini S&P continuous futures contract with the indicator applied showing a portion of 2024.
This article is for informational purposes. No type of trading or investment recommendation, advice, or strategy is being made, given, or in any manner provided by TradeStation Securities or its affiliates.
—John Robinson
TradeStation Securities, Inc.
www.TradeStation.com
BACK TO LIST

Wealth-Lab.com: September 2024
At the core of both indicators discussed in John Ehlers’ article in this issue, “Precision Trend Analysis,” and its companion “ROC” indicators is a highpass filter, now shipped with Wealth-Lab 8 out of the box.
As Ehlers suggests in his article, crossings of the ROC of trend analysis indicator over and under zero pinpoint the onset of a new trend.
Is the ROC effective for timing signals? Here, we provide some C# code for a sample trading system with rules simple enough for users to get a look and feel of the new indicators:
- Enter next bar at market when the ROC of the trend analysis indicator crosses above zero
- Exit next bar at market when the ROC of the trend analysis indicator crosses below zero
You can view some example signals for this trading system in Figure 2. As you can see, for this simple trading system, the ROC of the trend analysis crossovers indicate trend changes but produce quite a bit of whipsaws, as Ehlers discusses in his article.

FIGURE 2: WEALTH-LAB. Sample trades in ES=F (emini S&P 500). Data courtesy Yahoo! Finance.
using WealthLab.Backtest;
using System;
using WealthLab.Core;
using WealthLab.TASC;

namespace WealthScript1
{
    public class TASCSep2024 : UserStrategyBase
    {
		public TASCSep2024() : base()
		{
			AddParameter("Period 1", ParameterType.Int32, 250, 10, 250, 10);
			AddParameter("Period 2", ParameterType.Int32, 40, 2, 40, 2);
		}

		public override void Initialize(BarHistory bars)
		{
			period1 = Parameters[0].AsInt;
			period2 = Parameters[1].AsInt;
			StartIndex = Math.Max(period1, period2);

			hp1 = HighPass.Series(bars.Close, period1);
			hp2 = HighPass.Series(bars.Close, period2);
			ta = (hp1 - hp2);
			_roc = ((period2 / 6.28) * (ta - (ta >> 1)));

			PlotTimeSeries( ta, "Trend Analysis", "ta", WLColor.DarkRed, PlotStyle.ThickLine, default);
			PlotTimeSeries( _roc, "ROC of TA", "ta", WLColor.DarkBlue, PlotStyle.ThickLine, default);
			DrawHorzLine( 0, WLColor.White, 1, LineStyle.Dashed, "ta");
		}

		HighPass hp1, hp2;
		TimeSeries ta, _roc;
		int period1, period2;

        public override void Execute(BarHistory bars, int idx)
        {
            if (!HasOpenPosition(bars, PositionType.Long))
            {
                if(_roc.CrossesOver(0, idx))
			PlaceTrade( bars, TransactionType.Buy, OrderType.Market);
            }
            else
            {
			if (_roc.CrossesUnder(0, idx))
				PlaceTrade( bars, TransactionType.Sell, OrderType.Market);
            }
        }
    }
}
—Gene Geren (Eugene)
Wealth-Lab team
www.wealth-lab.com
BACK TO LIST

RealTest: September 2024
Provided here is coding for use in the RealTest platform to implement John Ehlers’ indicators described in his article in this issue, “Precision Trend Analysis.”
Notes:
	John Ehlers "Precision Trend Analysis", TASC September 2024.
	Implements and plots the indicators as in the article, with the addition of a smoothed ROC line.
	Adds two simple strategies to test the long and short sides separately and together.

Import:
	DataSource:	Norgate
	IncludeList:	&ES
	StartDate:	Earliest
	EndDate:	Latest
	SaveAs:	es.rtd

Settings:
	DataFile:	es.rtd
	BarSize:	Daily

Parameters:
	Length1:	250
	Length2:	40
	Smooth:	20
	Test:	from 1 to 3

Data:
	// Common constants
	decay_factor:	-1.414 * 3.14159
	phase_angle:	1.414 * 180
	two_pi:	6.28

	// Price Value
	price:	Close

	// Highpass Filter Length1
	hp1a1:	exp(decay_factor / Length1)
	hp1b1:	2 * hp1a1 * Cosine(phase_angle / Length1)
	hp1c2:	hp1b1
	hp1c3:	-hp1a1 * hp1a1
	hp1c1:	(1 + hp1c2 - hp1c3) / 4
	HP1:	if(BarNum >= 4, hp1c1 * (price - 2 * price[1] + price[2]) + hp1c2 * HP1[1] + hp1c3 * HP1[2], 0)

	// Highpass Filter Length2
	hp2a1:	exp(decay_factor / Length2)
	hp2b1:	2 * hp2a1 * Cosine(phase_angle / Length2)
	hp2c2:	hp2b1
	hp2c3:	-hp2a1 * hp2a1
	hp2c1:	(1 + hp2c2 - hp2c3) / 4
	HP2:	if(BarNum >= 4, hp2c1 * (price - 2 * price[1] + price[2]) + hp2c2 * HP2[1] + hp2c3 * HP2[2], 0)

	// Trend Indicator
	Trend:	HP1 - HP2
	TROC:	(Length2 / two_pi) * (Trend - Trend[1])

	// Ultimate Smoother of TROC
	trusa1:	exp(decay_factor / smooth)
	trusb1:	2 * trusa1 * Cosine(phase_angle / smooth)
	trusc2:	trusb1
	trusc3:	-trusa1 * trusa1
	trusc1:	(1 + trusc2 - trusc3) / 4
	TRUS:	if(BarNum >= 4, (1 - trusc1) * TROC + (2 * trusc1 - trusc2) * TROC[1] - (trusc1 + trusc3) * TROC[2] + trusc2 * TRUS[1] + trusc3 * TRUS[2], TROC)

	// Trading Signals
	signal1:	Trend
	signal2:	TROC
	signal3:	TRUS
	signal:	Item(Format("signal{#}", Test))
	goLong:	Cross(Signal, 0)
	goShort:	Cross(0, Signal)

Charts:
	Trend:	Trend {|}
	TROC:	TROC {|}
	TRUS:	TRUS {|}
	Zero:	0 {|}

Strategy: trend_long
	Side:	Long
	EntrySetup:	goLong
	ExitRule:	goShort
	Quantity:	1

Strategy: trend_short
	Side:	Short
	EntrySetup:	goShort
	ExitRule:	goLong
	Quantity:	1
Figure 3 shows the indicators plotted below a chart of the S&P emini (ES).

FIGURE 3: REALTEST. Here you an example of John Ehlers’ indicators plotted on a chart of the S&P emini (ES).
—Marsten Parker
MHP Trading
mhp@mhptrading.com
BACK TO LIST

TradingView: September 2024
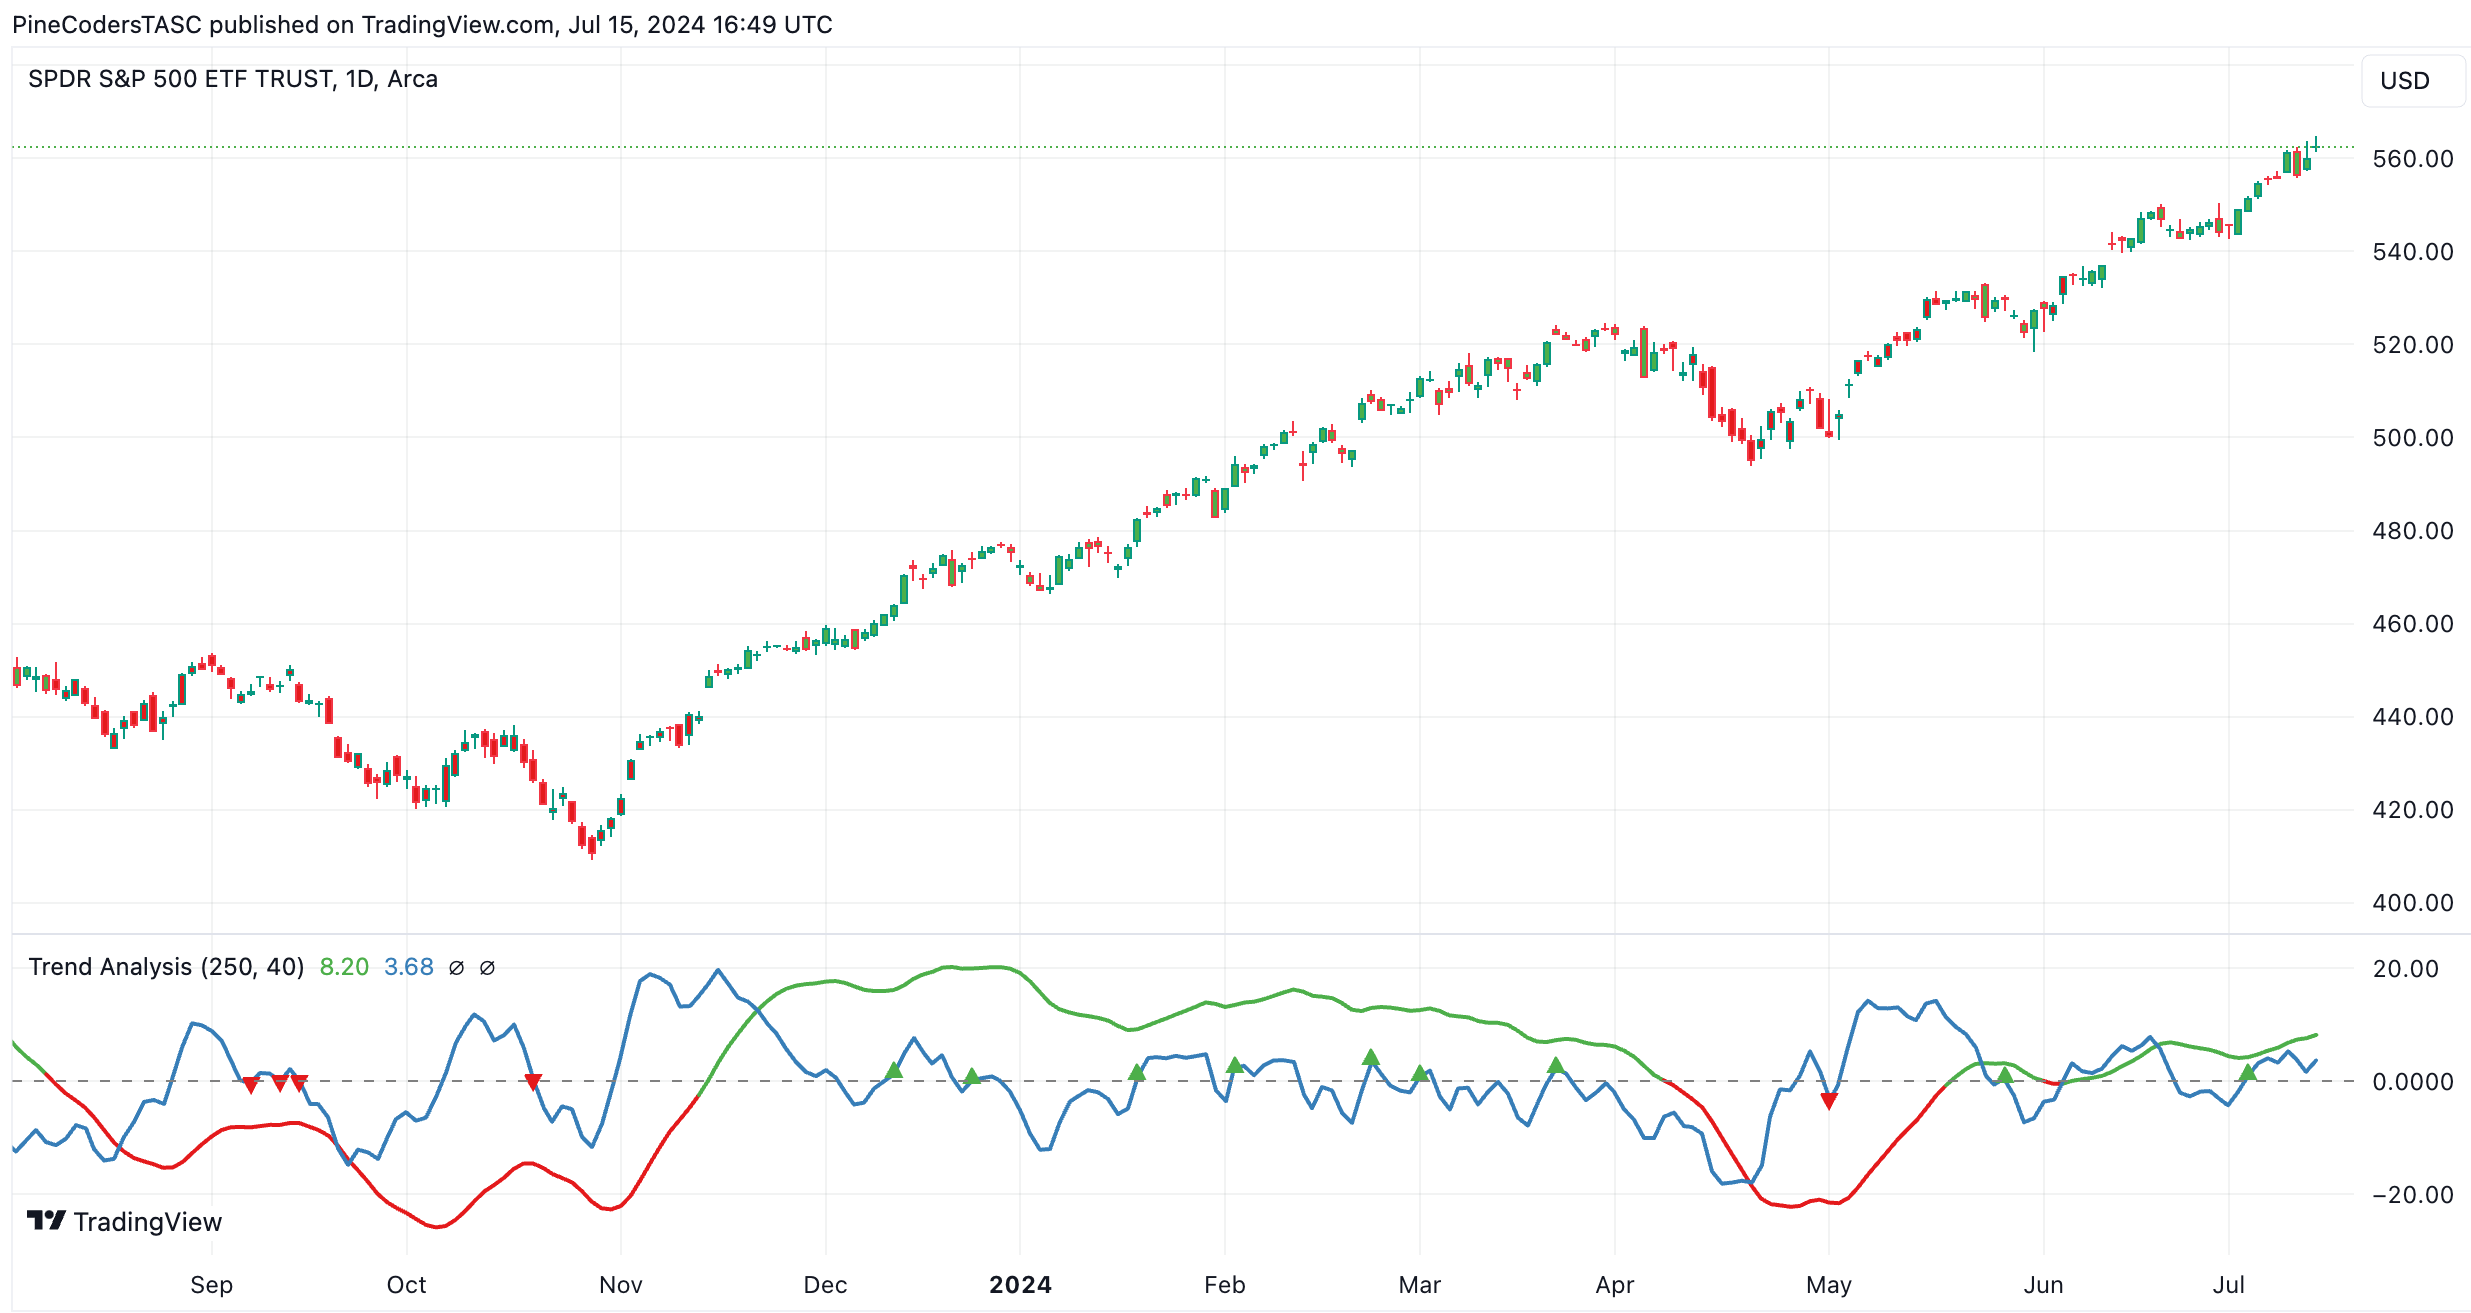
The TradingView Pine Script code presented here implements the trend indicator and its rate of change (ROC), as described in John Ehlers’ article in this issue, “Precision Trend Analysis.” The script generates on-chart signals for trend reversals at peaks and valleys and colors chart bars based on whether the trend indicator is above or below the zero balance point, providing clear visual cues for trend direction and potential trade entry/exit points.
//  TASC Issue: September 2024
//     Article: Precision Trend Analysis.
//              A New Way To Pinpoint Trend.
//  Article By: John F. Ehler
//    Language: TradingView's Pine Script™ v5
// Provided By: PineCoders, for tradingview.com


//@version=5
title ="TASC 2024.09 Precision Trend Analysis"
stitle = "Trend Analysis"
indicator(title, stitle, false)


// --- Inputs ---
int length01 = input.int(250, "Length 1:")
int length02 = input.int( 40, "Length 2:")


// --- Functions ---
highpass(float Source, float Period) =>
    float a1  =  math.exp(-1.414 * math.pi / Period)
    float b1  =  2 * a1 * math.cos(1.414 * math.pi / Period)
    float c2  =  b1
    float c3  = -a1 * a1
    float c1  =  (1.0 + c2 - c3) *0.25
    float hp  =  0.0
    if bar_index >= 4
        hp := c1 * (Source - 2 * Source[1] + Source[2]) +
              c2 * nz(hp[1]) + c3 * nz(hp[2])
    hp


// --- Calculations ---
float HP1   = highpass(close, length01)
float HP2   = highpass(close, length02)
float Trend = HP1 - HP2
float ROC   = (length02 / 6.28) * ta.change(Trend)


// --- Visuals ---
color colTrend = Trend > 0? #4daf4a : #e41a1c
plot(Trend, "Trend Indicator", colTrend, 2)
plot(ROC, "ROC", #377eb8, 2)
hline(0.0, "Zero Point")


plotshape(ta.crossunder(ROC, 0) and Trend < 0 ? ROC : na,
          "Peak", shape.triangledown, location.absolute,
          colTrend, size = size.tiny)
plotshape(ta.crossover(ROC, 0) and Trend > 0 ? ROC : na,
          "Valley", shape.triangleup, location.absolute,
          colTrend, size = size.tiny)


barcolor(colTrend, editable = true)
The script is available on TradingView from the PineCodersTASC account at: https://www.tradingview.com/u/PineCodersTASC/#published-scripts.
An example chart is shown in Figure 4.

FIGURE 4: TRADINGVIEW. Here you an example of John Ehlers’ indicators plotted on a chart of the S&P emini (ES).
—PineCoders, for TradingView
www.TradingView.com
BACK TO LIST

The Zorro Project: September 2024
In his article in this issue, “Precision Trend Analysis,” John Ehlers presents functions for separating the trend from a price curve. Some of these functions, for instance Ehlers’ SuperSmoother, are already available in the indicator library of the Zorro platform. The remaining functions are a 1:1 conversion from the EasyLanguage code provided in Ehlers’ article to C:
var HighPass3(vars Data, int Length)
{
   var f = 1.414*PI/Length;
   var a1 = exp(-f);
   var c2 = 2*a1*cos(f);
   var c3 = -a1*a1;
   var c1 = (1+c2-c3)/4;
   vars HP = series(0,4);
   return HP[0] = c1*(Data[0] - 2*Data[1] + Data[2])
      + c2*HP[1] + c3*HP[2];
}

var TROC;
var Trend(vars Data,int Length1,int Length2)
{
   var HP1 = HighPass3(Data,Length1);
   var HP2 = HighPass3(Data,Length2);
   vars Trends = series(HP1-HP2,2);
   TROC = (Length2/6.28)*(Trends[0]-Trends[1]);
   return Trends[0];
}
The filter name is HighPass3 because Zorro already has three other highpass filters in its library.
For comparing our code conversion with Ehlers’ charts in his article, we can apply the functions to an ES chart from 2022–2024, using the following code:
void run()
{
  BarPeriod = 1440;
   StartDate = 20221001;
   EndDate = 20240401;
   LookBack = 250;
   assetAdd("ES","YAHOO:ES=F");
   asset("ES");
   plot("HP",HighPass3(seriesC(),250),NEW,RED);
   plot("Trend",Trend(seriesC(),250,40),NEW,RED);
   plot("ROC",TROC,0,BLUE);
}
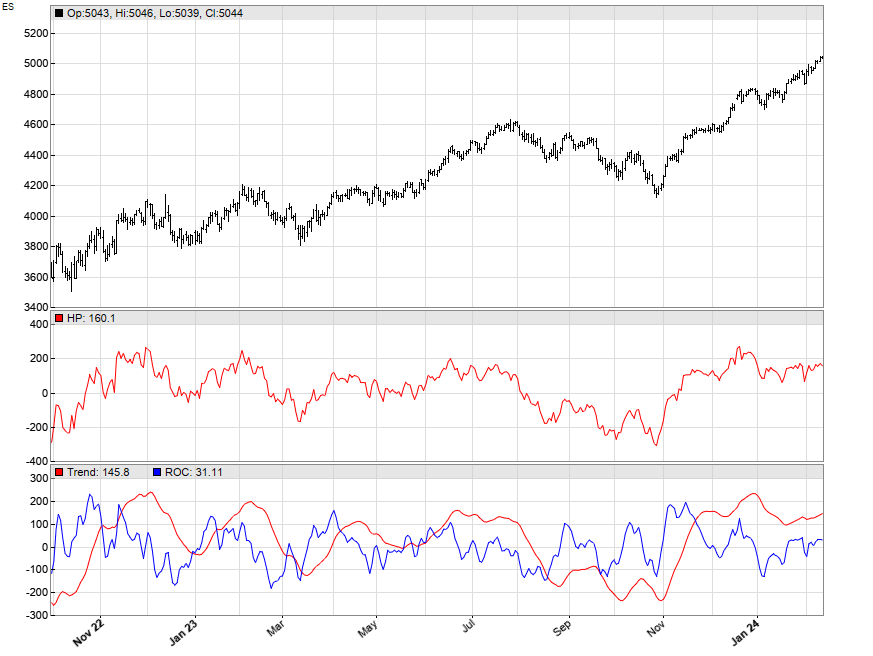
The resulting chart is shown in Figure 5. We can see that the highpass, trend, and ROC lines perfectly replicate Ehlers’ charts given in his article.

FIGURE 5: ZORRO. Here is an example of the highpass, trend, and ROC lines plotted on a chart of ES.
The code can be downloaded from the 2024 script repository on https://financial-hacker.com. The Zorro platform can be downloaded from https://zorro-project.com.
—Petra Volkova
The Zorro Project by oP group Germany
https://zorro-project.com
BACK TO LIST

Neuroshell Trader: September 2024
John Ehlers’ trend indicator and ROC can be easily implemented in NeuroShell Trader by combining some of NeuroShell Trader’s 800+ indicators. To implement the indicators, select “new indicator” from the insert menu and use the indicator wizard to create the following indicators:
TREND	Subtract( Highpass(Close, 250), Highpass(Close, 40) )
ROC:	Mul2(Divide(40, 6.28), Momentum( TREND, 1 ) )

FIGURE 6: NEUROSHELL TRADER. This NeuroShell Trader chart shows the trend indicator and ROC for the S&P emini futures (ES).
Users of NeuroShell Trader can go to the Stocks & Commodities section of the NeuroShell Trader free technical support website to download a copy of this or any previous Traders’ Tips.
The highpass and SuperSmoother indicators are available for download on the free technical support website with the Traders’ Tip.
—Ward Systems Group, Inc.
sales@wardsystems.com
www.neuroshell.com
BACK TO LIST
Microsoft Excel: September 2024
In his article in this issue, “Precision Trend Analysis,” John Ehlers combines a pair of his high-pass filters at two different cutoff settings to create a new trend analysis indicator that shows the relative strength of a trend in either direction.
Calculating and plotting a rate of change line over this indicator will rather precisely locate points of price trend change (trend analysis indicator inflection points) when the rate of change plot crosses zero.
In Figure 7 you see plots of the longer and shorter high-pass filters and the trend analysis, which is the difference between the high-pass filters.

FIGURE 7: EXCEL. Here you see the trend analysis indicator with its components.
In the bottom of Figure 8 we have our trend indicator with its rate of change. I have positioned the cursor on the most recent bar, where the ROC has just crossed above zero, indicating a positive change of trend.

FIGURE 8: EXCEL. Here is a demonstration of the trend indicator with its rate of change.
In his article, Ehlers acknowledges that the ROC can become a bit choppy (whipsaw) in longer trends and in sideways (nontrending) intervals. He suggests the possibility of applying hysteresis bands to the trend indicator to stand as overbought and oversold levels to help filter entries and exits. He also suggests applying the SuperSmoother to the rate of change indicator to perhaps filter some of the chop.
In Figure 9, I have added the SuperSmoother ROC in green (the checkbox at right controls the SuperSmoother ROC display). As he notes in his article, the SuperSmoother adds a bit of lag proportional to the smoothing length. At a SuperSmoother length of 12 as used here, several of the choppy zero crossings (at the left side) have been eliminated at the cost of the remaining up or down zero crossings lagging by about three bars.

FIGURE 9: EXCEL. Here you see the trend indicator, rate of change, and SuperSmoother (SS) rate of change plotted.
In his article, Ehlers also suggests that the bandpass filtering technique can be applied to other indicators and layered on top of itself to deal with shorter-term bulges.
So, lots to play with here!
To download this spreadsheet: The spreadsheet file for this Traders’ Tip can be downloaded here. To successfully download it, follow these steps:
- Right-click on the Excel file link, then
- Select “save as” (or “save target as”) to place a copy of the spreadsheet file on your hard drive.
—Ron McAllister
Excel and VBA programmer
rpmac_xltt@sprynet.com
BACK TO LIST
Originally published in the September 2024 issue of
Technical Analysis of STOCKS & COMMODITIES magazine.
All rights reserved. © Copyright 2024, Technical Analysis, Inc.


