TRADERS’ TIPS
October 2024

For this month’s Traders’ Tips, the focus is Francesco Bufi’s article in this issue, “Overbought/Oversold Oscillators: Useless Or Just Misused?” Here, we present the October 2024 Traders’ Tips code with possible implementations in various software.
You can right-click on any chart to open it in a new tab or window and view it at it’s originally supplied size, often much larger than the version printed in the magazine.
The Traders’ Tips section is provided to help the reader implement a selected technique from an article in this issue or another recent issue. The entries here are contributed by software developers or programmers for software that is capable of customization.

TradeStation: October 2024
In “Overbought/Oversold Oscillators: Useless Or Just Misused?” in this issue, author Francesco Bufi presents a strategy based on the relative strength index (RSI) that continuously adjusts the buying level. Within the general tab of the strategy properties for all window, the setting “Maximum number of bars study will reference” should be set to 200.
Function: BAT

{
	TASC OCT 2024
	BAT Function: Bufi Adaptive Threshold
	Francesco P. Bufi - © 2024 - all rights reserved
}

inputs:
	Price( numericseries ),
	Len( numericsimple );

Value1 = StdDev( Price, Len );
Value2 = TLSlopeEasy( Price, 0{1}, Len);

if Value1 <> 0 then Value3 = Value2 / Value1;
if Value3 > 0.5 then Value3 = 0.5;
If Value3 < -0.5 then Value3 = -0.5;

BAT = Value3;

Strategy: Adaptive Thresholds

{
	TASC OCT 2024
	Oscillators: Useless Or Misused?
	Francesco P. Bufi - © 2024 - all rights reserved
}

inputs:
	Sys( 1 ),
	RsiLen( 2 ),
	BuyLevel( 14 ),
	EhlersLen( 2 ),
	EhlersLevel( 10 ),
	TrendLen( 200 ),
	UpBuyLev( 12 ),
	DnBuyLev( 4 ),
	AdaptLen( 8 ),
	KAdaptive( 6 ),
	AdaptLen2( 5 ),
	KAdaptive2( 7.2 ),
	AdaptLen3( 5 ),
	KAdaptive3( 7.2 ),
	AdaptLen4( 5 ),
	KAdaptive4( 7.2 ),
	ExitBars( 29 ),
	DollarStp( 1600 );

variables:
	Osc( 0 ),
	Trend( 0 ),
	Ehlersosc( 0 );

if Close > Average(Close, TrendLen) then
	Trend = 1
else
	Trend = -1;

Osc = RSI(Close, RsiLen);

if Sys = 1 and Osc < BuyLevel then
	Buy next bar at market; // Traditional way

if Sys = 2 and Osc < BuyLevel and Trend = 1 then
	Buy next bar at market; // Trend filtering

if Sys = 3 then
begin // Trend driven levels
	if Trend = 1 and Osc < UpBuyLev then
		Buy next bar at market;
	if Trend = -1 and Osc < DnBuyLev then
		Buy next bar at market;
end;

if Sys = 4 and Osc < BuyLevel
 * KAdaptive * BAT(Close, AdaptLen) then
	Buy next bar at market; // With BAT

SetStopContract;

if DollarStp > 0 then
	SetStopLoss( DollarStp );
if BarsSinceEntry > ExitBars then
	Sell next bar at market;
A sample chart is shown in Figure 1.

FIGURE 1: TRADESTATION. This 60-minute chart of the continuous emini S&P 500 futures contract (ES) displaying a segment from August 2024 demonstrates the adaptive thresholds strategy applied.
This article is for informational purposes. No type of trading or investment recommendation, advice, or strategy is being made, given, or in any manner provided by TradeStation Securities or its affiliates.
—John Robinson
TradeStation Securities, Inc.
www.TradeStation.com
BACK TO LIST

RealTest: October 2024
Provided here is coding for use in the RealTest platform to implement Francesco P. Bufi’s technique as described in his article in this issue, “Overbought/Oversold Oscillators: Useless Or Just Misused?”
Notes:
	Bufi Adaptive Threshold example
	TASC Trader's Tips for October 2024 article by Francesco P. Bufi

Parameters:
	// version of system to test
	Sys:	From 1 to 4
	// author's defaults for other parameters
	RsiLen:	2
	BuyLevel:	14
	TrendLen:	200
	UpBuyLev:	12
	DnBuyLev:	4
	AdaptLen:	8
	KAdaptive:	6
	ExitBars:	29
	DollarStop:	1600

Data:
	value1:	StdDev(C, AdaptLen)
	value2:	(C - C[AdaptLen]) / AdaptLen // "TLSlopeEasy" calculation
	//value2:	Slope(c, AdaptLen) // standard linear regression slope function for comparison
	value3:	value2/value1
	BAT:	Bound(value3, -0.5, 0.5)
	OSC:	RSIF(C, RsiLen)
	Trend:	C > Avg(C, TrendLen)

Strategy: AdaptThreshTest
	Side:	Long
	Quantity:	1 // contract

	EntrySetup:	Select(
		Sys=1, OSC < BuyLevel, // traditional way
		Sys=2, OSC < BuyLevel and Trend, // trend filtering
		Sys=3, OSC < if(Trend, UpBuyLev, DnBuyLev), // trend-driven levels
		Sys=4, OSC < BuyLevel * KAdaptive * BAT) // author's way with BAT

	ExitRule:	BarsHeld > ExitBars // time stop
	ExitStop:	FillPrice - (DollarStop / PointValue) // max dollar loss stop
—Marsten Parker
MHP Trading
mhp@mhptrading.com
BACK TO LIST

TradingView: October 2024
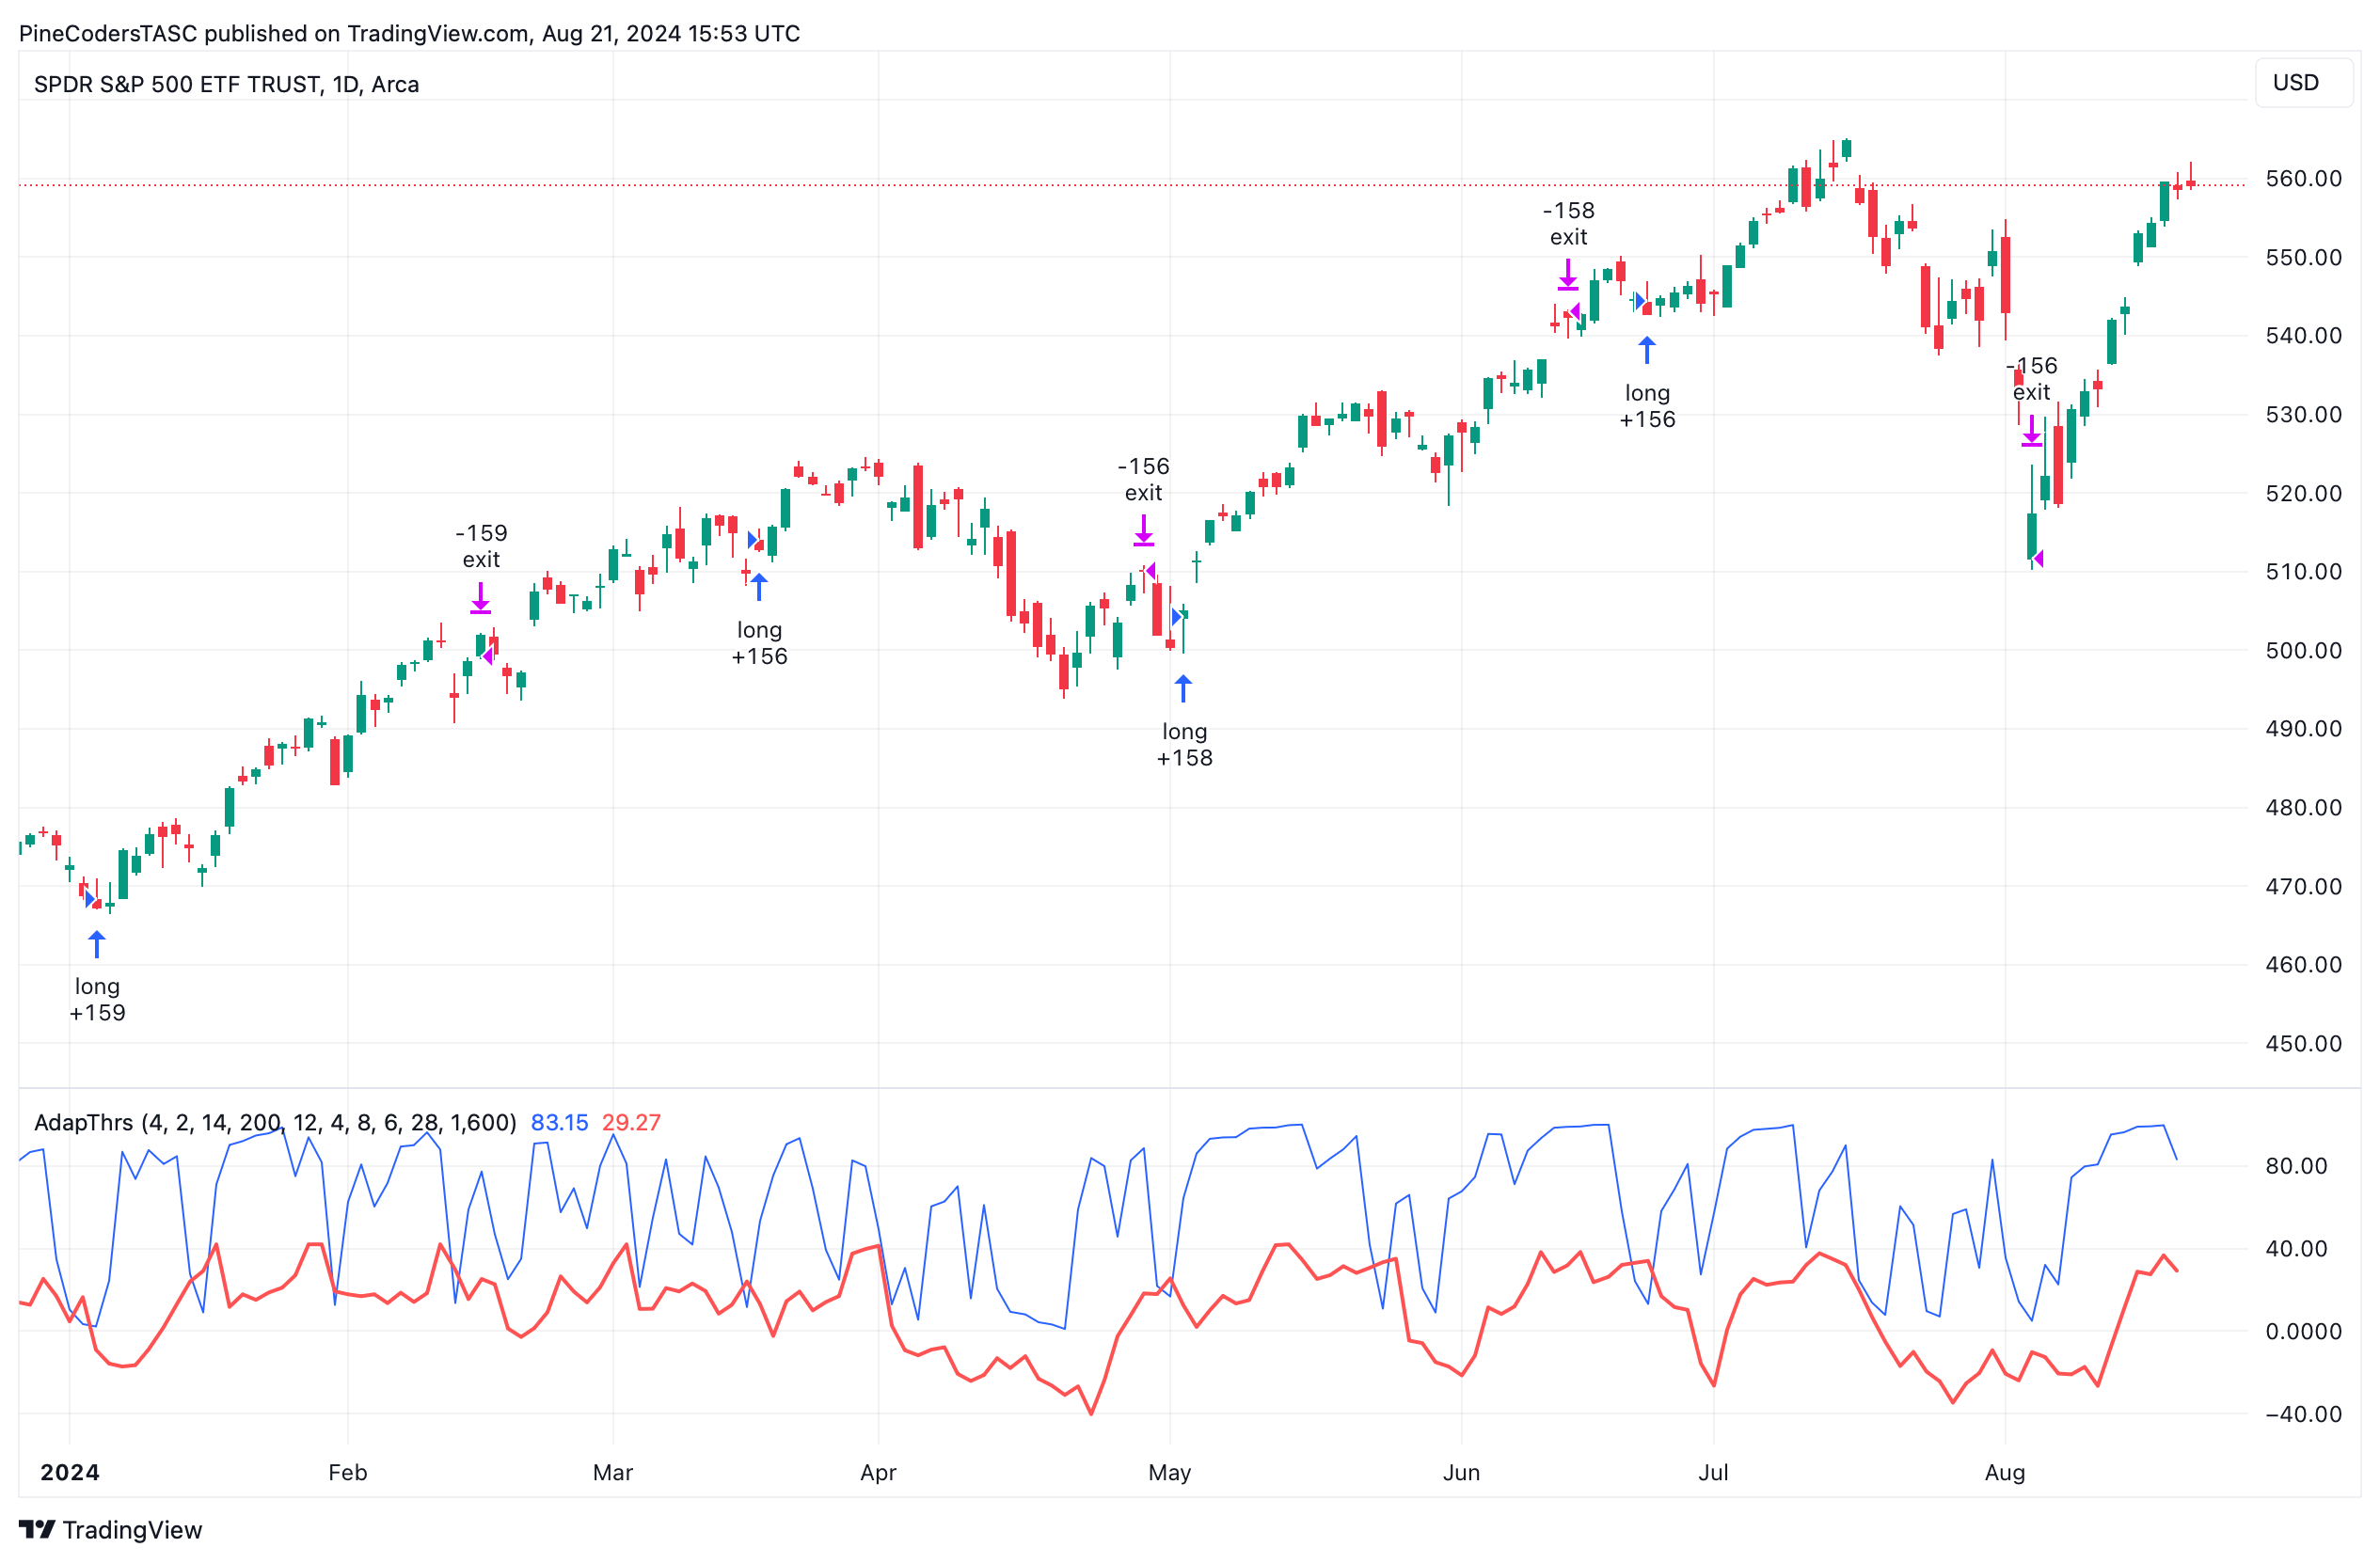
The TradingView Pine Script code presented here demonstrates the use of a dynamic buy level in an oscillator-based system, as described in Francesco Bufi’s article in this issue, “Overbought/Oversold Oscillators: Useless Or Just Misused?” The script presented here based on Bufi’s article provides four test systems, all based on the relative strength index (RSI) oscillator but with different entry conditions. The primary focus is on system 4, which applies the author’s adaptive threshold formula.
//  TASC Issue: October 2024
//     Article: Overbought/Oversold
//              Oscillators: Useless Or Just Misused
//  Article By: Francesco P. Bufi
//    Language: TradingView's Pine Script™ v5
// Provided By: PineCoders, for tradingview.com


//@version=5
title ='TASC 2024.10 Adaptive Thresholds'
stitle = 'AdapThrs'
strategy(title, stitle, false)


// --- Inputs ---
int sys        = input.int(1, options=[1, 2, 3, 4])
int rsiLen     = input.int(2)
int buyLevel   = input.int(14)
int trendLen   = input.int(200)
int upBuyLev   = input.int(12)
int dnBuyLev   = input.int(4)
int adapLen    = input.int(8)
int adapK      = input.int(6)
int exitBars   = input.int(28)
float dollarSL = input.float(1600)


// --- Functions ---
//  Bufi Adaptive Threshold
BAT (float price, int length) =>
    float sd = ta.stdev(price, length)
    float lr = ta.linreg(price, length, 0)
    float slope = (lr - price[length]) / (length + 1)
    math.min(0.5, math.max(-0.5, slope / sd))


// --- Calculations ---
float avg = ta.sma(close, trendLen)
int trend = close > avg ? 1 : -1
float osc = ta.rsi(close, rsiLen)


// Strategy entry rules
// traditional system
if sys == 1 and osc < buyLevel
    strategy.entry("long", strategy.long)
// trend filtering system
if sys == 2 and osc < buyLevel and trend == 1
    strategy.entry("long", strategy.long)
// trend driven system
if sys == 3
    if trend == 1 and osc < upBuyLev
        strategy.entry("long", strategy.long)
    if trend == -1 and osc < dnBuyLev
        strategy.entry("long", strategy.long)
// BAT system
float thrs = buyLevel * adapK * BAT(close, adapLen)
if sys == 4 and osc < thrs
    strategy.entry("long", strategy.long)
plot(osc, "RSI", color.blue, 1)
plot(sys == 4 ? thrs : na, "Threshold", color.red, 2)


// Strategy exit rules
int nBar = bar_index - strategy.opentrades.entry_bar_index(0)
float SL = strategy.opentrades.entry_price(0) - dollarSL
// fixed-bar exit
if exitBars > 0 and nBar >= exitBars
    strategy.close("long", "exit")
// dollar stop-loss
if dollarSL > 0 and ta.crossunder(close, SL)
    strategy.close("long", "Stop-loss")
The script is available on TradingView from the PineCodersTASC account https://www.tradingview.com/u/PineCodersTASC/#published-scripts.
An example chart is shown in Figure 2.

FIGURE 2: TRADINGVIEW. Here’s an example of implementing the adaptive thresholds technique on a chart of SPY.
—PineCoders, for TradingView
www.TradingView.com
BACK TO LIST

Neuroshell Trader: October 2024
The overbought/oversold trading systems discussed in Francesco Bufi’s article in this issue can be easily implemented in NeuroShell Trader by combining some of NeuroShell Trader’s 800+ indicators. To implement the trading systems, select “new strategy” from the insert menu and use the trading strategy wizard to create the following strategies:
System #1 – Buy Conditions
BUY LONG CONDITIONS: [All of which must be true]
     A<B(RSI(Close,2),14)
System #2 – Buy Conditions
BUY LONG CONDITIONS: [All of which must be true]
     Price>Avg(Close,200)
     A<B(RSI(Close,2),14)

System #3 – Buy Conditions
BUY LONG CONDITIONS: [All of which must be true]
     A<B(RSI(Close,2),IfThenElse(Price>Avg(Close,200),12,4))

System #4 – Buy Conditions
BUY LONG CONDITIONS: [All of which must be true]
     A<B( RSI(Close,2),
               Mul3(14,6,Min2(Max2(Divide(LinTimeReg Slope(Close,8),StndDev(Close,8)),-0.5),0.5)))

All Systems – Stop and Exit Conditions
LONG TRAILING STOP PRICES:
     PriceFloorPnts(Trading Strategy #4,32)
SELL LONG CONDITIONS: [All of which must be true]
     BarsSinceFill=X(Trading Strategy #4,29)
Users of NeuroShell Trader can go to the Stocks & Commodities section of the NeuroShell Trader free technical support website to download a copy of this or any previous Traders’ Tips.

FIGURE 3: NEUROSHELL TRADER. This NeuroShell Trader chart shows the overbought/oversold trading systems applied to the S&P 500 emini contract (ES).
—Ward Systems Group, Inc.
sales@wardsystems.com
www.neuroshell.com
BACK TO LIST

AIQ: October 2024
The AIQ code is provided here for Francesco Bufi’s adaptive thresholds technique and his four test systems, as described in his article in this issue (“Overbought/Oversold Oscillators: Useless Or Just Misused?”).
Since the author optimized the test systems for intraday trading and the AIQ code provided here is based on daily bar trading, the parameters may need to be adjusted to get a realistic test.
!Overbought/Oversold Oscillators: Useless Or Just Misused?
!Author: Francesco P. Bufi, TASC October 2024
!Coded in AIQ by: Richard Denning, 8/17/2024

!INPUTS:
C is [close].
C1 is valresult(C,1).
H is [high].
L is [low].
TrendLen is 200.
RSILen is 2.
BuyLevel is 14.
UpBuyLevel is 12.
DnBuyLevel is 4.
AdaptLen is 8.
KAdaptive is 6.
ExitBars is 3.

!BAT:
StdDev is sqrt(variance(C,AdaptLen)).
value1 is StdDev.
value2 is slope2(C,AdaptLen).
value3 is value2/value1.
value3a is iff(value3>0.5,0.5,iff(value3<-0.5,-0.5,value3)).
BAT is value3a.

!TREND:
SMA is simpleavg(C,TrendLen).
Trend is iff(C > SMA,1,-1).

!! RSI WILDER
!To convert Wilder Averaging to Exponential Averaging use this formula:
!ExponentialPeriods = 2 * WilderPeriod - 1.
U is C - C1.
D is C1 - C.
W1 is RSILen.
rsiLen1 is 2 * W1 - 1.
AvgU is ExpAvg(iff(U>0,U,0),rsiLen1).
AvgD is ExpAvg(iff(D>=0,D,0),rsiLen1).
rsi is 100-(100/(1+(AvgU/AvgD))).

!SYSTEMS FOR TESTING:
! Sys1:
Buy1 if rsi<BuyLevel.

!Sys2:
Buy2 if rsi<BuyLevel and Trend=1.

!Sys3:
Buy3 if (Trend=1 and rsi<UpBuyLevel) or (Trend=-1 and rsi<DnBuyLevel).

!Sys4:
BL is BuyLevel*KAdaptive*BAT.
Buy4 if rsi<BuyLevel*KAdaptive*BAT.

Sell if {position days} >= ExitBars.

ShowValues if 1.
—Richard Denning
rdencpa@gmail.com
for AIQ Systems
BACK TO LIST
Originally published in the October 2024 issue of
Technical Analysis of STOCKS & COMMODITIES magazine.
All rights reserved. © Copyright 2024, Technical Analysis, Inc.


