BASIC TECHNIQUES
Trading The MACD
by Jayanthi Gopalakrishnan
You can trade Gerald Appel's moving average convergence/divergence profitably in relatively flat markets. Here's how.
The moving average convergence/divergence (MACD) is a momentum oscillator developed by Gerald Appel in the early 1970s. For this oscillator, momentum implies that fluctuations in prices are reflected in the MACD; if there is a sudden increase in price, the MACD will move upward. It fluctuates above and below a zero line -- which is why it is known as an oscillator. The zero line is the horizontal equilibrium line and if the indicator is above the zero line, it is a bullish signal and if below the zero line, a bearish signal.

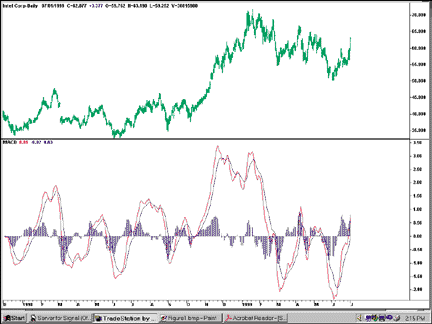
FIGURE 1: INTEL CORP. A moving average convergence-divergence (MACD) crossing close to the zero line successfully anticipates the beginning of a strong trend. The crossing of the fast line (in red) above the signal line (blue) is a buy signal.The MACD does what its name suggests: it measures the divergence or convergence of a shorter moving average with a longer moving average. It is represented in two ways, one as a line form and the other as a histogram. Figure 1 illustrates the line and histogram versions of the MACD for the same security.
In the line version, there are two lines, one red and one blue. The red line, which is the MACD "fast" line, displays the difference between two exponential moving averages (Ema). I use the 12- and 26-period EMA, which is commonly favored. The blue line, or signal line, is the EMA of the MACD fast line. To calculate the signal line, I use the nine-period EMA. You can use different periods based on your own preferences. You can even use one set of periods for generating buy signals and another for generating sell signals.
The MACD histogram displays the difference between the MACD fast line and the MACD signal line. This difference is plotted as vertical bars above or below the zero line. Both representations are similar; however, the histogram reflects the variance between the fast line and the signal line. An upward slope in the bars indicates rising prices, whereas a downward movement generally reflects falling prices, making this display a good coincident indicator.
FORMULA
We'll spare you the computation of MACD here. It's all covered in the sidebar "MACD spreadsheet," with exemplary Excel code. Put simply, the formula used to calculate the MACD is:
Fast line = (12-period EMA) – (26-period EMA)
Signal line = (Nine-period EMA of fast line)
USING THE MACD
MACD can be used to analyze crossovers, divergences, and overbought/oversold conditions, depending on particular circumstances. It is helpful in determining the price direction of a security and if used correctly, it will benefit a trader in several ways.
Jayanthi Gopalakrishnan is a Staff Writer for STOCKS & COMMODITIES magazine.
Excerpted from an article originally published in the October 1999 issue of Technical Analysis of STOCKS & COMMODITIES magazine. All rights reserved. © Copyright 1999, Technical Analysis, Inc.
Return to October 1999 Contents