BASIC TECHNIQUES
Gann Swings And Intraday Trading
by Thom Hartle
Swing trading is one of the oldest technical methods in technical trading literature. Even though it's little used these days, this classic technique is hardly outmoded and can be useful in trading today's volatile stock market.
To some, today's overheated stock market must seem like the land o' opportunity: just step right up and jump on board the train to make a profit. Unfortunately, some days the market looks more like a train wreck than a weekend trip to your favorite resort. In fact, the volatility in some stocks would make a seasoned soybean trader think he or she were trading grains during a major drought. The hottest stocks have doubled in a matter of a few weeks, only to give back 50% in a few days. Top traders know that the way to cope -- that is, make money -- is to approach these volatile markets with a well-thought-out plan of action. Don't go into the fray with a seat-of-the-pants attitude, or your emotions will make mincemeat of your account.

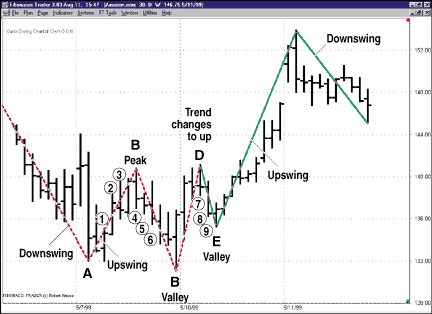
FIGURE 1: AMAZON.COM, 30-MINUTE BARS. Points A and C are valleys. The swing changes from down to up after the two consecutive higher highs from bars 1, 2, and 3. The trend changes from down to up (the line is solid) when the peak at point B is surpassed at point D.That means you need a set of procedures, a trading plan with the steps you will follow depending on what the market does. Such a plan was introduced in the STOCKS & COMMODITIES article "The New Gann Swing Chartist," written by trader Robert Krausz. There, Krausz detailed a Gann swing trading technique for end-of-day traders originally published in his A W.D. Gann Treasure Discovered. I'll update the technique with a look at intraday trading for a stock.
TWO-DAY SWINGS
The basis of Krausz's work was an original document from a trading course by W.D. Gann. The course itself, "The Mechanical Method And Trend Indicator For Trading Grains," was dated June 1933. Most interesting were a few handwritten alterations done in early 1955 prior to Gann's death. One in particular, scribbled over the section titled "Three-day chart or main trend indicator," noted: "Use two-day charts and rules better than three day," with Gann's signature.
Krausz took this information and researched it thoroughly for his book, creating a set of trading plans built around the two-day swing rules and using his own indicators.
TODAY'S MARKETS
With today's hyperactive stock market, trends that used to take weeks for a stock to go through now unfold in just a few days. That sounds like an opportunity, so I'll apply the concepts of swing trading to one very active stock, Amazon.com. (Figure 1 is a 30-minute bar chart of that stock.)
Thom Hartle is vice president of Wizard On Wall Street, a firm offering professional-level study courses for traders. He can be reached via E-mail at Tbonds@halcyon.com, or via Internet at https://www.THE-WOW.com.
Excerpted from an article originally published in the October 1999 issue of Technical Analysis of STOCKS & COMMODITIES magazine. All rights reserved. © Copyright 1999, Technical Analysis, Inc.
Return to October 1999 Contents