CLASSIC TECHNIQUES
How The Pros Use Average Directional Index
by Barbara Star, Ph.D.
Here's how technicians Charles LeBeau, Paul Rabbitt, and Linda Bradford Raschke integrate the average directional index into their trading plans.
How would you like to look over the shoulders of professional traders using one of your favorite indicators? Here's your chance. I spoke with three well-known traders who put their own money at risk daily. I asked them to show me what they do with the average directional index (ADX), one of the longest-lived and most popular trend indicators around.

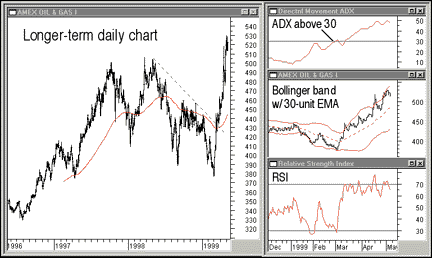
FIGURE 1: RABBITT TEMPLATE, XOI OIL AND GAS INDEX. Paul Rabbitt's screen template shows both the overall price action and the indicators at the same time. The original template consists of a black background, white price bars, and yellow trendlines. Those colors were changed for this article to provide better contrast.I asked Charles LeBeau, Paul Rabbitt, and Linda Raschke how they integrate ADX into their own trading analysis and trading tactics. Here, largely in their own words, these traders explain the thinking that guides their decision-making. Hopefully, some of their strategies might make you think about how this indicator can improve your trading.
PAUL RABBITT
Paul Rabbitt is a well-known quantitative strategist. During his 20-year affiliation with the Oppenheimer Co., he created and ran their quantitative department. He also developed the "Q" stock ranking system, a 12-factor stock risk/return model. He was a senior portfolio strategist when he left the firm in 1998 to form his own company. Currently, he advises institutional clients and provides sector and industry forecasts. Rabbitt's analyses and investments include stocks, bonds, various financial indices, and Spyder sectors. Market comments and quantitative rankings on individual stocks are available on his Website. (For the URL see "Related resources" at the end of this article.)
Rabbitt uses a 14-unit ADX with end-of-day data as a rough gauge of momentum. "I use a very simplistic interpretation of ADX. If I have a rising ADX, but it is only at the 15 or 20 level, I consider it a weak momentum situation. If it is above 30, I consider it a stronger momentum situation. Even if ADX changes direction, as long as it remains above 30, I regard it as a momentum situation. And the higher the level, the greater the strength of the momentum. I don' t try to refine ADX too much," he comments.
Entries and exits: Given his background, Rabbitt relies on fundamentals, such as earnings announcements, earnings surprises, or company developments to form the basis for selecting buy or sell candidates. Then he looks at his technical tools. ADX helps determine entry and exit points on preselected securities. "ADX is the accelerator/decelerator in the trading process. ADX does not dictate whether I stay in or out of a trade," he goes on to say. "ADX only postpones a sale or accelerates a sale or postpones a purchase or accelerates a purchase.
"My goal is to invest rather than trade, so I try to slow my activity as much as I can and stay in situations as long as I can," he explains. "What I am trying to do is create what I call tax-efficient investment calls. I am trying to create long-term capital gains."
Barbara Star, Ph.D., university professor and part-time trader, provides individual instruction and consultation to those interested in technical analysis. She leads a MetaStock users group and is a past vice president of the Market Analysts of Southern California.
Excerpted from an article originally published in the October 1999 issue of Technical Analysis of STOCKS & COMMODITIES magazine. All rights reserved. © Copyright 1999, Technical Analysis, Inc.
Return to October 1999 Contents