TRADING TECHNIQUES
Trade Against The Gap
by Stéphane Reverre
Here's a systematic way of trading from close to close, depending on the amplitude of the move from one day to the next.
Does it pay to trade against a one-day price move of a certain size? That price action is a gap, and last issue, I explored how trading into a gap from the open to the close on the same day could be profitable. This time, I used descriptive statistics to develop the same strategy trading from close to close: depending on the amplitude of the move from yesterday to today, I took a position against the gap at today's close, and then I unwound these positions at the close of tomorrow or the next day.

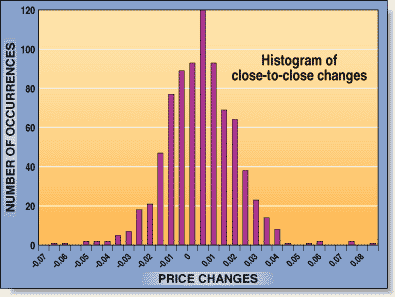
FIGURE 1A: GE'S PRICE CHANGES. As GE ascends in 1999, its day-to-day price changes are nearly normally distributed despite the uptrend. The contrast shows why you should use descriptive statistics such as histograms to see what is really happening.
As in my previous article, I assumed that a correction was probable if the gap -- the distance between closes -- was greater than a given minimum length. There are two important questions that had to be asked: "What level of a close-to-close gap is appropriate to trade?" and "What is the appropriate holding period for these positions?"
To answer the first question, I decided to study the activity of a stock. I chose GE because it is one of the most liquid stocks in the Dow 30 and is widely followed by analysts. If it exhibits a particular behavior, chances are good that other stocks will exhibit the same behavior. I studied GE's day-to-day gaps and came up with the result that can be seen in Figure 1A, the nearly symmetrical distribution of the close-to-close price changes. This occurred despite GE's nearly continuous uptrend in this period (Figure 1B). (See sidebar, "Distribution details.")
I am assuming this is a normal distribution of price changes. Thus, beyond two standard deviations, 5% of all gaps will not be of normal, bell-shaped distribution, and with that in mind, I should see them 13 times a year (5% of 250 trading days). If I wanted to trade more often -- say, once a week, or 50 times a year -- I would have to keep 20% of all occurrences, about 1.28 standard deviations. In this distribution, that would give me an interval of -1.96% to 2.24%. I would trade price changes greater than 2.24% up or 1.96% down. This information lets me set my trading frequency, but I still don't know how long to hold the position-- one day or several?
In order to answer the second question, consider a three-wave pattern: the first wave is the move from yesterday to today, the second wave is the move from today to tomorrow, and the final wave is the move from today to the day after tomorrow.
Stéphane Reverre is working toward an MBA at Harvard Business School. Previously, he worked at a French leading financial institution as an equity derivatives trader in Tokyo and New York. He can be reached at sreverre@hotmail.com.
Excerpted from an article originally published in the December 1999 issue of Technical Analysis of STOCKS & COMMODITIES magazine. All rights reserved. © Copyright 1999, Technical Analysis, Inc.
Return to December 1999 Contents