TRADING TECHNIQUES
As The Bond Turns
by Alex Saitta
Quick! Is that a turn in the bond market you see? Well, don't jump right away. Trend reversals take time.
Trend reversals take time: I've heard this time and time again. After an uptrend, for instance, you'll often hear technicians say: "Don't get short yet. It will take time before this uptrend is reversed. Tops take time to form." Intrigued, I decided to find out if this was correct. As it turns out, it is correct, at least in the bond market. Here's the evidence and a technique you can use to test your favorite trading instrument.

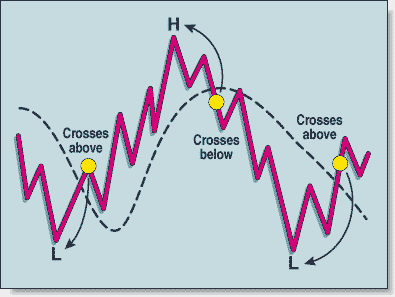
FIGURE 1: HIGHS AND LOWS. Highs and lows are labeled as the market crosses its 20-day moving average. This definition is the first step in defining the length of tops and bottoms.
The theory that tops and bottoms take time to form is rooted in the belief that the longer-term price movement of a security is guided by its underlying fundamentals. The fundamentals in most markets are byproducts of the business cycle. The business cycle has four phases -- up, top, down, and bottom -- and because the cycle moves along slowly, the time length of these phases tend to be proportional to each other.
For example, traditionally, the business cycle has moved in a continuous cycle -- from recovery to expansion to recession to depression to recovery again. If a depression -- the bottom phase of the cycle -- lasts a few years, the following recovery and expansion usually lasts for years as well, not just for a few months. In the same vein, when the up phase of the cycle is long, it is unlikely that the reversal will be quick. Economic fundamentals such as inflation, Gross Domestic Product (GDP), and the supply and demand of credit are cyclical. Therefore, the bond market's uptrends, tops, downtrends, and bottoms should be proportional in time.
I studied the bond market's price action to see if there was supporting evidence for this logic and if there were any truth to the notion that as a rule, a significant length of time passed before one price trend was reversed by another. To find out, I employed the following five-step approach:
1 We identified the market's reactionary lows and highs by using the 20-day moving average. When the market crossed above the moving average, we labeled the lowest price when the market was below the average as a reactionary low. When the market crossed below the moving average, we labeled the highest price when the market was above the average as a reactionary high. As the market crossed above and below the average, successive lows and highs were labeled (Figure 1).
2 Not every upmove between a successive low and successive high is long enough to be an uptrend, and not every downmove is long enough to be classified as a downtrend. When the distance between a low and a high was more than 4% of the starting price level, we identified it as an uptrend (Figure 2). When the distance between a successive high and low was more than 4%, we classified it as a downtrend.
3 When an uptrend was next followed by a downtrend or a downtrend was next followed by an uptrend, we examined the reversals. When an uptrend was next followed by an uptrend or a downtrend followed by a downtrend, it wasn't a trend reversal, so we ignored it.
For example, on April 27, 1990, the Treasury bond made a low. It rose, and then remained above its 20-day moving average for several weeks (Figure 3). On June 14, the contract peaked. From the low price to the high price, the upmove was 6.9% long, so it was considered an uptrend.
Contributing Writer Alex Saitta is a technical analyst and vice president for Salomon Smith Barney. Yuxin Li contributed to this article.
Excerpted from an article originally published in the December 1999 issue of Technical Analysis of STOCKS & COMMODITIES magazine. All rights reserved. © Copyright 1999, Technical Analysis, Inc.
Return to December 1999 Contents