The Inverse Fisher Helps Clear The Way
The Inverse Fisher Transform
by John F. Ehlers
How often have you been indecisive about entering or exiting a trade? Here's one way to get a clear indication.
The purpose of technical indicators is to help time your decisions to buy or sell. Ideally, their signals should be clear and unequivocal, but more often than not you will find yourself crossing your fingers before pulling the trigger. Even if you have placed only a few trades, you will have experienced this.
INVERSE FISHER TRANSFORM
In this article I will show you a way to program your oscillator-type indicators to give clear, black-and-white indications of when to buy or sell. I will do this by using the inverse Fisher transform to alter the probability distribution function (PDF) of your indicators.
In the past, I have noted that the PDF of price and indicators do not have a Gaussian, or normal, probability distribution. A Gaussian PDF is the familiar bell-shaped curve in which the long "tails" mean that wide deviations from the mean do not occur frequently. The Fisher transform can be applied to almost any normalized dataset to make the resulting PDF nearly Gaussian, with the result that the turning points are sharply peaked and easy to identify. The Fisher transform is defined by the equation:

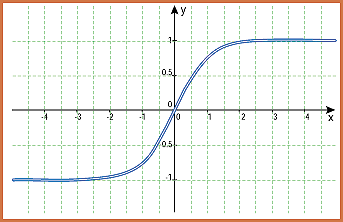
Figure 1: transform response of the inverse fisher transform. The output is compressed to be between -1 and +1.
...Continued in the May issue of Technical Analysis of
STOCKS & COMMODITIES
Excerpted from an article originally published in the May 2004 issue of Technical Analysis of STOCKS & COMMODITIES magazine. All rights reserved. © Copyright 2004, Technical Analysis, Inc.
Return to May 2004 Contents