May 2004
TRADERS' TIPS
You can copy these formulas and programs for easy use in your spreadsheet or analysis software. Simply "select" the desired text by highlighting as you would in any word processing program, then use your standard key command for copy or choose "copy" from the browser menu. The copied text can then be "pasted" into any open spreadsheet or other software by selecting an insertion point and executing a paste command. By toggling back and forth between an application window and the open webpage, data can be transferred with ease.
This month's tips include formulas and programs for:
TradeStation: Inverse Fisher Transform
MetaStock: Inverse Fisher Transform
AmiBroker: Inverse Fisher Transform
Wealth-Lab: Inverse Fisher Transform
TradingSolutions: Inverse Fisher Transform
NeuroShell Trader: Inverse Fisher Transform
AIQ TradingExpert: Inverse Fisher Transform
NeoTicker: Inverse Fisher Transform
Prophet.net: Inverse Fisher Transform
StockWiz: Inverse Fisher Transform
Aspen Graphics: Inverse Fisher Transform
Financial Data Calculator: Inverse Fisher Transform
TechniFilter Plus: Inverse Fisher Transform
eSignal: Inverse Fisher Transform
TRADESTATION: Inverse Fisher Transform
John Ehlers' article in this issue, "The Inverse Fisher Transform,"
describes the calculation and use of the inverse Fisher transform. The
transform is applied to any indicator with a known probability distribution
function, but the article offers two sample transforms: RSI and cyber cycle.
The article already includes indicator code written in EasyLanguage, so
here we offer sample strategy code for both. We have created inputs for
the trigger levels for entry and exit so that the user may adjust these
levels as desired.
Strategy: InvFisher-RSI
{INVERSE FISHER TRANSFORM OF RSI}
inputs:
 Price( ( High + Low ) / 2 ),
 Alpha( 0.1 ),
 RSILength( 5 ),
 WAverageLen( 9 ),
  BuyLine( 0.5 ),
 SellLine( -0.5 ),
  BuyLine2( -0.5 ),
 SellLine2( 0.5 ) ;
variables:
 IFish( 0 ) ;
Value1 = Alpha * ( RSI( Price, RSILength ) - 50 ) ;
Value2 = WAverage( Value1, WAverageLen ) ;
IFish = ( ExpValue( 2 * Value2 ) - 1 )
 / ( ExpValue( 2 * Value2 ) + 1 ) ;
if IFish crosses over BuyLine or IFish crosses over
 BuyLine2 then
 Buy next bar at market ;
if IFish crosses under SellLine or IFish crosses under
 SellLine2 then
 SellShort next bar at market ;
Strategy: InvFisher-CyberCycle
{CYBER CYCLE WITH INVERSE FISHER TRANSFORM}
inputs:
 Price( ( H + L ) / 2 ),
 Alpha( 0.07 ),
 BuyLine1( 0.5 ),
 BuyLine2( -0.5 ),
 SellLine1( 0.5 ),
 SellLine2( -0.5 ) ;
variables:
 Smooth( 0 ),
 Cycle( 0 ),
 ICycle( 0 ) ;
Smooth = ( Price + 2 * Price[1] + 2 * Price[2]
 + Price[3] ) / 6 ;
Cycle = ( 1 - 0.5 * Alpha ) * ( 1 - 0.5 * Alpha )
 * ( Smooth - 2 * Smooth[1] + Smooth[2] ) + 2
 * ( 1 - Alpha ) * Cycle[1] - ( 1 - Alpha )
 * ( 1 - Alpha ) * Cycle[2] ;
if CurrentBar < 7 then
 Cycle = ( Price - 2 * Price[1] + Price[2] ) / 4 ;
ICycle = ( ExpValue( 2 * Cycle ) - 1 ) / ( ExpValue( 2
 * Cycle ) + 1 ) ;
if ICycle crosses over BuyLine1 or ICycle crosses over
 BuyLine2 then
 Buy next bar at market ;
if ICycle crosses under SellLine1 or ICycle crosses
 under SellLine2 then
 SellShort next bar at market ;
This strategy code will be available for download from the EasyLanguage
Exchange on www.tradestationworld.com. Look for the file "InverseFisher.eld."
A sample chart is shown in Figure 1.
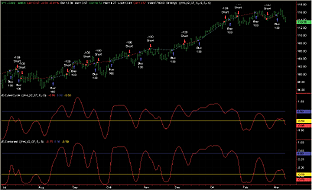
Figure 1: TradeStation, Inverse Fisher Transform. This sample TradeStation chart shows the inverse Fisher transform.
--Mark MillsBACK
MarkM@TSSec at www.TradeStationWorld.com
EasyLanguage Questions Forum
TradeStation Securities, Inc.
METASTOCK: Inverse Fisher Transform
John Ehlers' article in this issue, "The Inverse Fisher Transform," includes the TradeStation code for two indicators. The MetaStock code for those same indicators is listed below.
To enter this indicator into MetaStock, do the following:
1. In the Tools menu, select "Indicator Builder."
2. Click New to open the Indicator Editor for a new indicator.
3. Type the name of the formula.
4. Click in the larger window and type in the formula.
Name: Inverse Fisher Transform of RSI:
Formula:
v1:= .1*(RSI(5)-50);
v2:= Mov(v1,9,W);
.5;
-.5;
(Exp(2*v2)-1)/(Exp(2*v2)+1)
Name: Cyber Cycles with Inverse Filter Transform
Formula:
pr:= (H+L)/2;
a:= 0.07;
sp:= (pr+(2*Ref(pr,-1))+(2*Ref(pr,-2))+Ref(pr,-3))/6;
cycle:=Power(1-(.5*a),2)*(sp-(2*Ref(sp,-1))+Ref(sp,-2))+(2*(1-a))*PREV-(Power(1-a,2)*Ref(PREV,-1));
.5;
-.5;
(Exp(2*cycle)-1)/(Exp(2*cycle)+1)
John Ehlers' cyber cycle concept is included in the second formula.
Here is the formula for the cyber cycles without the transform:
Name: Cyber Cycles
Formula:
pr:= (H+L)/2;
a:= 0.07;
sp:= (pr+(2*Ref(pr,-1))+(2*Ref(pr,-2))+Ref(pr,-3))/6;
Power(1-(.5*a),2)*(sp-(2*Ref(sp,-1))+Ref(sp,-2))+(2*(1-a))*PREV-(Power(1-a,2)*Ref(PREV,-1))
In his article, Ehlers states the inverse Fisher transform can work
with any oscillator, and that values between -5 and 5 are more suited for
the transform calculations. Here is another version of the inverse Fisher
transform of RSI. This version takes the highest and lowest value of the
RSI and normalizes the scale to a range of -5 to 5.
Name: Normalized RSI with IFT
Formula:
plot:= RSI(5);
ph:=LastValue(Highest(plot));
pl:=LastValue(Lowest(plot));
pf:=10/(ph-pl);
v1:= ((plot-pl)*pf)-5;
v2:= Mov(v1,9,W);
.5;
-.5;
(Exp(2*v2)-1)/(Exp(2*v2)+1)
Figure 2 shows a chart comparing the two versions of the formula
(the blue line is Ehlers' version). A third indicator shows the difference
in values. As you can see, while the amplitude of the move may be different,
the curve is the same.

Figure 2: MetaStock, Inverse Fisher Transform. This MetaStock chart compares the two versions of the IFT formula (the blue line is Ehlers' version). A third indicator shows the difference in values. While the amplitude of the move may be different, the curve is the same.
The different values are caused by the normalization. Where Ehlers'
formula keeps the same ratio of the RSI to its maximum and minimum, the
second formula sets the highest RSI value to be the upper boundary (f)
and lowest value to be the lower boundary (-5). This causes the second
formula's swings to be a bit more pronounced.
This second version of the formula can be used with any oscillator by
substituting the formula for your oscillator with the formula for the RSI
on the first line. For example, to use the formula on the stochastic oscillator,
change the first line from this:
BACKplot:= RSI(5); to this: plot:= Stoch(5,3);--William Golson
Equis International
AMIBROKER: Inverse Fisher Transform
In "The Inverse Fisher Transform," John Ehlers shows how to use the inverse Fisher transform (IFT) to compress oscillator-type indicators to give clear trading indications of when to buy or sell.
The Ift is a nonlinear transformation that changes the probability distribution, so for example, unbounded indicators can be transformed into bounded indicators with a high probability of being either +1 or -1.
Implementing the Fisher transform as well as Ehlers' cyber cycle indicator as presented in the article is easy using AmiBroker Formula Language.
We have created general-purpose functions for both. Listing 1 shows
the code for the Ift-transformed RSI, while Listing 2 shows the code for
the cyber cycle with Ift. To plot both indicators in AmiBroker (Figures
3 and 4), select Indicator Builder from Analysis menu, click the "Add"
button, enter the formula, and then press "Apply."

Figure 3: AmiBroker, Inverse Fisher Transform. This AmiBroker screenshot shows the price chart of QQQ (upper pane) and inverse Fisher RSI (lower pane), reproducing the chart presented in John Ehlers' article.
Figure 4: AmiBroker, Cyber Cycle Indicator. This AmiBroker screenshot shows the price chart of SPY (upper pane); the unbounded cyber cycle indicator (middle pane); and the IFT-transformed cyber cycle indicator (lower pane), reproducing the chart presented in John Ehlers' article.
LISTING 1
// General - purpose Inverse Fisher Transform function
function InvFisherTfm( array )
{
  e2y = exp( 2 * array );
  return ( e2y - 1 )/( e2y + 1 );
}
Value1 = 0.1 * ( RSI( 5 ) - 50 );
Value2 = WMA( Value1, 9 );
Plot( InvFisherTfm( Value2 ), "IFT-RSI", colorRed, styleThick );
PlotGrid( 0.5 );
PlotGrid(-0.5 );
LISTING 2
SetBarsRequired( 200, 0 );
// General - purpose Inverse Fisher Transform function
function InvFisherTfm( array )
{
  e2y = exp( 2 * array );
  return ( e2y - 1 )/( e2y + 1 );
}
function CyberCycle( array, alpha )
{
  smooth = ( array + 2 * Ref( array, -1 ) +
             2 * Ref( array, -2 ) + Ref( array, -3 ) ) / 6;
  // init value
  Cycle = ( array[ 2 ] - 2 * array[ 1 ] + array[ 0 ] )/4;
  for( i = 6; i < BarCount; i++ )
  {
     Cycle[ i ] = ( ( 1 - 0.5 * alpha) ^ 2 ) *
                  ( smooth[ i ] - 2 * smooth[ i - 1 ] + smooth[ i - 2] ) +
                  2 * ( 1 - alpha ) * Cycle[ i - 1 ] -
                  ( ( 1 - alpha) ^ 2 ) * Cycle[ i - 2 ];
  }
  return Cycle;
}
Cycle = CyberCycle( (H+L)/2, 0.07 );
ICycle = InvFisherTfm( Cycle );
//Plot( Cycle, "CyberCycle", colorBlue );
Plot( ICycle, "ICyberCycle", colorRed, styleThick );
PlotGrid( 0.5 );
PlotGrid(-0.5 );
--Tomasz Janeczko, AmiBroker.com
www.amibroker.com
WEALTH-LAB: Inverse Fisher Transform
Visitors to the Wealth-Lab website can run the inverse Fisher demo script, which incorporates plots of the cyber cycle and simple trading rules suggested in John Ehlers' article, by choosing "ChartScripts|Search" in the menu. Enter Fisher in the Title Search and press the Submit button. Then select the script from the list, enter any US stock symbol, and finally click "Execute ChartScript." A sample chart is in Figure 5.

Figure 5: Wealth-Lab, Inverse Fisher Transform. The system trades only crossovers of the inverse Fisher transform (IFT) of a smoothed RSI. Raw and IFT cyber cycle plots are shown for reference.
We've added the inverse Fisher and cyber cycle indicators to the
code library so that Wealth-Lab users can retrieve them via the Community|Download
ChartScripts feature in Wealth-Lab Developer's main menu.
{$I 'CyberCycle'}
{$I 'InverseFisher'}
var
  Bar, p, hRSI, hRSIx, hIF_RSI, RSIPane,
  hIF_CC, CCPane, hCCPane, hCC, hCCD: integer;
{ ---- Setup indicators ---- }
hCC := DivideSeriesValue( AddSeries( #High, #Low ), 2 );
hCC := CyberCycleSeries( hCC, 0.07 );
hCCD := OffsetSeries( hCC, -1 ); // delay 1 bar
hIF_CC := InverseFisherSeries( hCC );
hRSI := RSISeries( #Close, 5 );
hRSIx := SubtractSeriesValue( WMASeries( hRSI, 9 ), 50 );
hRSIx := MultiplySeriesValue( hRSIx, 0.1 );
hIF_RSI := InverseFisherSeries( hRSIx );
{ ---- Plot control ---- }
RSIPane  := CreatePane( 100, false, true );
hCCPane := CreatePane( 75, false, true );
CCPane := CreatePane( 75, false, true );
PlotSeriesLabel( hCCD, hCCPane, #Blue, #Thick, 'hCCD=hCC delayed' );
PlotSeriesLabel( hCC, hCCPane, #Teal, #Thick, 'hCC=CyberCycle((H+L)/2,0.07)' );
PlotSeriesLabel( hIF_CC, CCPane, #Red, #Thick, 'hIF_CC=InvFisher(hCC)' );
PlotSeriesLabel( hIF_RSI, RSIPane, #Red, #Thick, 'hIF_RSI=IF(RSI(5))' );
HideVolume;
{ Inverse Fisher RSI System }
for Bar := 40 to BarCount - 1 do
  if LastPositionActive then
  begin
    p := LastPosition;
    if CrossUnderValue( Bar, hIF_RSI, 0.5 )
    or CrossUnderValue( Bar, hIF_RSI, -0.5 ) then
      SellAtMarket( Bar + 1, p, '' );
  end
  else if CrossOverValue( Bar, hIF_RSI, -0.5 ) then
      BuyAtMarket( Bar + 1, '' );
--Robert Sucher, Wealth-Lab, Inc.BACK
www.wealth-lab.com
TRADINGSOLUTIONS: Inverse Fisher Transform
In his article "The Inverse Fisher Transform," John Ehlers presents calculations for indicators that are intended to generate clearer signals. Two examples of using the inverse Fisher transform are given -- one using the RSI and one using cyber cycles.
The calculation for the RSI example and an associated trading system are as follows:
Name: Inverse Fisher Transform of RSI
Short Name: IFish
Inputs: Close
Formula:
Div (Sub (Exp (Mult (2,WMA (Mult (0.1,Sub (RSI (Close,5),50)),9))),1),Add (Exp (Mult
 (2,WMA (Mult (0.1,Sub (RSI (Close,5),50)),9))),1))
Name: Inverse Fisher Transform of RSI System
Inputs: Close
Enter Long when any of these rules are true:
CrossAbove (IFish (Close, -0.5)
CrossAbove (IFish (Close, 0.5)
Enter Short when any of these rules are true:
CrossBelow (IFish (Close, 0.5)
CrossBelow (IFish (Close, -0.5)
The calculation of the cyber cycle example is slightly more complicated
and requires some helper functions:
Name: Cyber Cycle Smoothed Price
Short Name: ICycleSmooth
Inputs: Price
Formula:
Div (Add (Price, Add (Mult (2, Lag (Price,1)), Add (Mult (2, Lag (Price,2)), Lag (Price,3)))),6)
Name: Cyber Cycle Internal Cycle
Short Name: ICycleCycle
Inputs: Price, Alpha
Formula:
If (LT (Bar# (),7), Div (Add3 (Price, Mult (-2, Lag (Price,1)), Lag (Price,2)),4),Sub (Add (Mult3
 (Sub (1, Mult (0.5,Alpha)), Sub (1,Mult (0.5,Alpha)), Add3 (ICycleSmooth (Price), Mult (-2, Lag
 (ICycleSmooth (Price),1)), Lag (ICycleSmooth (Price),2))), Mult3 (2, Sub (1,Alpha),Prev (1))),
 Mult3 (Sub (1,Alpha), Sub (1,Alpha), Prev (2))))
Name: Cyber Cycle with Inverse Fisher Transform (General)
Short Name: ICycleGeneral
Inputs: Price, Alpha
Formula:
Div (Sub (Exp (Mult (2,ICycleCycle (Price,Alpha))),1), Add (Exp (Mult (2,ICycleCycle (Price,Alpha))),1))
Name: Cyber Cycle with Inverse Fisher Transform
Short Name: ICycle
Inputs: High, Low, Alpha
Formula:
ICycleGeneral (Div (Add (High,Low),2),Alpha)
A sample chart of the IFT RSI indicator and cyber cycles indicator
is shown in Figure 6, along with sample entry/exit signals.

Figure 6: TradingSolutions, Inverse Fisher Transform. Here's a sample TradingSolutions chart displaying the inverse Fisher transforms of RSI and cyber cycles, as well as an entry/exit signal based on the inverse Fisher transform of RSI.
These functions are available in a function file that can be downloaded
from the TradingSolutions website in the Solution Library section.
As with many indicators, indicators such as these can make good inputs to neural network predictions. If used directly, you will want to set the preprocessing to "none" for both indicators, since the value stays within a specific range.
--Gary GeniesseBACK
NeuroDimension, Inc.
800 634-3327, 352 377-5144
https://www.tradingsolutions.com
NEUROSHELL TRADER: Inverse Fisher Transform
John Ehlers' discussion of the inverse Fisher transform gives us two
indicators that can be easily implemented in NeuroShell Trader. We used
two different methods to build the indicators. To build the inverse Fisher
RSI, we simply combined a few of the 800 technical indicators included
in NeuroShell Trader. To build the cyber cycle with inverse Fisher transform,
we used NeuroShell Trader's ability to call external dynamic linked libraries.
Dynamic linked libraries may be written in C, C++, Power Basic, and Delphi.
You can download both of these indicators from the NeuroShell Trader free
technical support website. A sample chart is in Figure 7.

Figure 7: NeuroShell Trader, Inverse Fisher Transform. Here's a sample chart in NeuroShell Trader displaying the cyber cycle with inverse Fisher transform and inverse Fisher RSI.
After downloading the custom indicators, you can insert them by
following the instructions below:
1. Select "New Indicator ..." from the Insert menu.
2. Select the Custom Indicator category.
3. Select the cyber cycle with inverse Fisher transform and inverse Fisher RSI indicators.
4. Select the parameters as you desire. (We set the defaults to be the same as the ones Ehlers used.)
5. Select the Finished button.
You can easily insert these custom indicators or combine them with
any of our 800 built-in indicators into a chart, prediction, or trading
strategy. In addition, if you decide to use these indicators in a prediction
or a trading strategy, the coefficients may be optimized by the genetic
algorithm built into NeuroShell Trader Professional. Optimization can produce
custom versions of Ehlers' indicators that may be adapted to different
issues.
Users of NeuroShell Trader can go to the STOCKS & COMMODITIES section of the NeuroShell Trader free technical support website to download this or any previous Traders' Tips.
--Marge Sherald, Ward Systems Group, Inc.BACK
301 662-7950, sales@wardsystems.com
www.neuroshell.com
AIQ TRADINGEXPERT: Inverse Fisher Transform
Here is the code for AIQ TradingExpert based on John Ehlers' article
"The Inverse Fisher Transform." (See Figure 8.)

Figure 8: AIQ, Inverse Fisher Transform. Here's a sample AIQ chart.
! INVERSE FISHER TRANSFORM OF RSI
! Coded by Richard Denning 3/5/04
! FIVE DAY WILDER RSI
U  is [close]-val([close],1).
D  is val([close],1)-[close].
AvgU  is ExpAvg(iff(U>0,U,0),9).
AvgD  is ExpAvg(iff(D>=0,D,0),9).
RSI  is 100-(100/(1+(AvgU/AvgD))).
! IFISHER OF RSI
Value1  is 0.1 * (RSI - 50).
Value2  is expavg(Value1,9).
! Exponential average substituted for weighted averaging.
! The author has indicated that either is acceptable for smoothing.
IFish is  (Exp(2 * Value2) - 1) / (Exp(2 * Value2) + 1) * 100.
! Ehlers' amount x 100 for ease of plotting
! Plot IFish as a custom indicator with upper and lower supports of +50 and - 50
--AIQ SystemsBACK
NEOTICKER: Inverse Fisher Transform
The indicators discussed in John Ehlers' article in this issue, "The Inverse Fisher Transform," can be implemented in NeoTicker using formula language.
To construct the first indicator, the inverse Fisher transform of RSI,
first create a new formula indicator with the name "IFish." This indicator
has three plots and no parameters (Listing 1). Apply the resulting indicator
to a QQQ daily chart to reproduce the QQQ chart presented in the article
(Figure 9).

Figure 9: NeoTicker, Inverse Fisher Transform. Apply the IFish indicator to a QQQ daily chart to reproduce the QQQ chart shown in John Ehlers' article. This indicator has three plots and no parameters.
Next, to construct the cyber cycle with the inverse Fisher transform,
create another formula indicator with the name "ICycle." This indicator
has four plots and two parameters, price and alpha (Listing 2). Apply this
indicator to an SPY daily chart to reproduce the SPY chart presented in
the article (Figure 10).
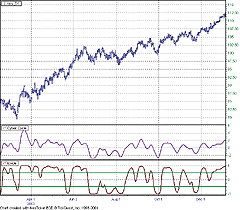
Figure 10: NeoTicker, Inverse Fisher Transform. Apply the ICycle indicator to an SPY daily chart to reproduce the SPY chart presented in John Ehlers' article. This indicator has four plots and two parameters, price and alpha.
To show the cycle values, you can use the "plot value" built-in
indicator. Add the "plot value" indicator to a new pane, and link it to
the ICycle indicator with the parameter plot set to 2, so that the second
plot of the ICycle indicator is displayed.
LISTING 1
Value1 := 0.1*(RSIndexMod(0,data1,5)-50);
Value2 := waverage(0,Value1,9);
plot1 := (exp(2*Value2)-1)/(exp(2*Value2)+1);
plot2 := 0.5;
plot3 := -0.5;
LISTING 2
myprice := fml(0,data1,param1);
myalpha := param2;
mycounter := mycounter+1;
Smooth := (myprice+2*myprice(1)+2*myprice(2)+2*myprice(3))/6;
'Cycle values when gearter than and equal to 7
Cycle_ge_7 := (1-0.5*myalpha)*(1-0.5*myalpha)*
               (Smooth-2*Smooth(1)+Smooth(2))+
               2*(1-myalpha)*Cycle_ge_7(1)-
               (1-myalpha)*(1-myalpha)*Cycle_ge_7(2);
'Cycle values when less than 7
Cycle_lt_7 := (myPrice-2*myPrice(1)+myPrice(2))/4;
'determine which cycle value to return
Cycle := if(mycounter < 7, Cycle_lt_7, Cycle_ge_7);
plot1 := (exp(2*Cycle)-1)/(exp(2*Cycle)+1); 'ICycle
Plot2 := Cycle;
Plot3 := 0.5; 'Sell Ref
Plot4 := -0.5; 'Buy Ref
A downloadable version of the indicators will be available from
the Yahoo! NeoTicker user group file area at https://groups.yahoo.com/group/neoticker/.
--Kenneth Yuen, TickQuest Inc.BACK
www.tickquest.com
PROPHET.NET: Inverse Fisher Transform
The inverse Fisher transform and cyber cycles described by John Ehlers this month are available on the Prophet.Net website to all premium members. No coding is required on the part of the user. Both of these studies, among 140 others, are available in the advanced studies suite in JavaCharts, found at https://www.prophet.net/analyze/javacharts.jsp.
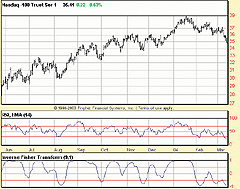
Click on the Tools menu (which you can also access by right-clicking anywhere on a chart) and choose Apply Studies from the Studies menu item. To create a chart similar to the one shown in Figure 3 in Ehlers' article, apply both indicators.
Figure 11 is a chart of the QQQ with the RSI and inverse Fisher transform
indicators. As mentioned in the article, the trading rule is to buy when
the indicator crosses over -0.5 and sell short when the indicator crosses
under +0.5. Figure 12 shows four clear "buy" signals and seven "short"
signals.
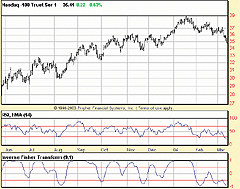
Figure 11: Prophet.net, Inverse Fisher Transform. Here's a sample Prophet.net chart of the QQQ with the RSI and inverse Fisher transform indicators.
Figure 12: Prophet.net, Inverse Fisher Transform. The system based on John Ehlers' Fisher transform buys when the indicator crosses over -0.5 and sells short when the indicator crosses under +0.5. Here, four clear buy signals and seven short signals are shown in this sample chart.
Ehlers extends the power of the inverse Fisher transform with the
cyber cycle, which is an oscillator-type indicator. The amplitude of the
swings help one measure the strength of the anticipated move.
A seven-day, risk-free trial is available at the following link:
https://www.prophet.net/tasc
It will provide immediate access to all premium studies.
--Tim Knight, Prophet.netBACK
https://www.prophet.net
STOCKWIZ: Inverse Fisher Transform
This StockWiz formula calculates the inverse Fisher transform as described
by John Ehlers in his article this issue.
# StockWiz formula that calculates the Inverse Fisher Transform
# as described by John F. Ehlers in the May 2004 issue of
# Technical Analysis of Stocks & Commodities magazine
(SET CLOSE  (GETVECTOR (CURRENT) "CLOSE"))
(SET LOW    (GETVECTOR (CURRENT) "LOW"))
(SET HIGH   (GETVECTOR (CURRENT) "HIGH"))
(SET VOLUME (GETVECTOR (CURRENT) "VOLUME"))
(SET RSI    (RSI CLOSE 5))
(SET VALUE1 (EVAL RSI "(RSI(i)-50.0)*0.1"))
(SET VALUE2 (WMOVAVG VALUE1 9))
(SET IFT    (EVAL VALUE2 "(exp(2*VALUE2(i))-1)/(exp(2*VALUE2(i))+1)"))
(SET LINE1  (EVAL CLOSE "0.5"))
(SET LINE2  (EVAL CLOSE "-0.5"))
(TITLE "INVERSE FISHER TRANSFORM")
(SUBTITLE (CURRENT))
(SUBSETS 5)
(GRAPHSET 1 1 0 0.55 "LINE")
(GRAPHSET 2 1 2 0.25 "LINE")
(GRAPHSET 3 1 0 0.20 "BAR")
(GRAPHADD 1 "GREEN"  "THINSOLID"  CLOSE)
(GRAPHADD 2 "RED"    "THINSOLID"  IFT)
(GRAPHADD 3 "BLUE"   "THINSOLID"  LINE1)
(GRAPHADD 4 "BLUE"   "THINSOLID"  LINE2)
(GRAPHADD 5 "BLACK"  "THINSOLID"  VOLUME)
(LABEL 1 "Close prices")
(LABEL 2 "IFT")
(LABEL 3 "Volume")
(SHOW)
--StockWizBACK
support@stockwiz.com
ASPEN GRAPHICS: Inverse Fisher Transform
Here is the Aspen Graphics code implementing John Ehlers' inverse Fisher
transform study.
size=2>  size=2>InvFishStd(series)={
 MyVal1 = .1 *  (rsi($1.close,5)-50)
 MyVal2 = wavg(MyVal1, 9)
 InvFish =  (Exp(2*MyVal2)-1) / (Exp(2*MyVal2) + 1)
InvFish
} size=2>  size=2>CyberCycl(series, alpha=.07)={
 Cycle = 0
 Smooth =  ($1.midpt + 2*$1.midpt[1] + 2*$1.midpt[2] +  $1.midpt[3])/6
 Cycle=((1-0.5*alpha)^2)*(Smooth-2*Smooth[1]+Smooth[2])+2*(1-alpha)*Cycle[1]-((1-alpha)^2)*Cycle[2]
 if  barcount($1) < 7 then Cycle = ($1.midpt - 2*$1.midpt[1] +  $1.midpt[2])/4
 ICycle = (exp(2*Cycle)-1) /  (exp(2*Cycle)+1)
ICycle
} size=2>
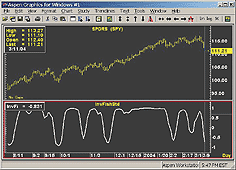
Sample charts are shown in Figures 13 and 14.
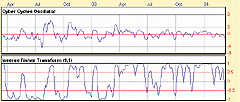
Figure 13: Aspen Graphics, Inverse Fisher Transform of RSI. Here's a sample chart of the inverse Fisher transform of RSI on SPY.
Figure 14: Aspen Graphics, Inverse Fisher Transform of RSI. Here's a sample chart of John Ehlers' cyber cycle indicator on SPY.
--Andy Sewell, Technical Support
Aspen Graphics
asewell@aspenres.com
FINANCIAL DATA CALCULATOR: Inverse Fisher Transform
The article "The Inverse Fisher Transform" by John Ehlers shows how to use this transform to clarify various oscillator-type signals. He applies it to the RSI and to his cyber cycle study.
First, we should note that the inverse Fisher transform is the function usually called the hyperbolic tangent. It is a built-in function of Financial Data Calculator, under the name "tanh." The application of this transform to RSI is contained in the macro "ifish" below; the cyber cycle study is the macro "cycle"; and the transform applied to this cycle is produced by simply typing tanh cycle dataset, where "dataset" is the name of the dataset to which the study is applied.
To produce "ifish," open the macro wizard, choose "new macro," and enter
the following code into the definition window:
c: cl #R
v1: 0.1*(5 rsi #r) - 50
v2: (1|9) wtave v1
tanh v2
Save this macro under the name "ifish." It allows application to
any target dataset. For example, if you entered the line ifish ibm in the
FDC command window, the output would be the ifish for the dataset "Ibm."
If you want the macro to be flexible about the length of the RSI period,
you could enter the following code instead:
c: cl #R
n: #l
v1: 0.1*(#l rsi #r) - 50
v2: (1|9) wtave v1
tanh v2
If this is saved as ifish instead of the previous code, it would
reproduce the previous result by typing in "5 ifish ibm." You could use
any integer length in place of the 5.
For cycle, open the macro wizard, choose New Macro, and enter the following
code into the definition window:
a: 0.07
n1: 1 - .5*a
n2: 1 - a
price: midrange #r
smooth: 1 2 2 1 wtave price
dsmooth: 1 -2 1 wtsum smooth
cycle: 1 -2 1 wtave price first 6
cycle: ((n1^2) * dsmooth) + (2*n2*cycle back 1) - ((n2^2)*cycle back 2)
cycle
It is used in the form cycle "dataset." To use the transformed
cycle, type tanh cycle "dataset."
--Robert C. BusbyBACK
Futures Software Associates, 856 857-9088
www.financialdatacalculator.com
TECHNIFILTER PLUS: Inverse Fisher Transform
Here is the TechniFilter Plus formula based on John Ehlers' article, "The Inverse Fisher Transform."
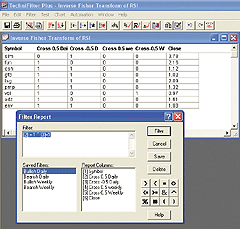
TechniFilter's Filter Report module can be used to scan and filter through
an entire database of stocks to locate stocks that have given a bullish
or bearish signal based on the inverse Fisher transform of the RSI signals
mentioned in the article. This scan can be run simultaneously on both weekly
and daily data (Figure 15). A sample chart is in Figure 16.
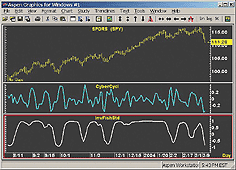
Figure 15: TechniFilter Plus, Inverse Fisher Transform of RSI. After computing the report (or exploration) of the database, you can use a pre-saved filter or build a custom filter using a selection of the Report Columns (formulas). This example locates all stocks that the inverse Fisher transform has either crossed from below to above -0.5 or 0.5. The results can be saved to a list by clicking the "save list" icon. Alternatively, click the Undo button and refilter the results.
Figure 16: TechniFilter Plus, Inverse Fisher Transform of RSI. The red graph is the inverse Fisher transform of the RSI. The red arrows indicate an upcross of the 0.5 line. Brown arrows point to an upcross of the -0.5 line. The blue arrow indicates a downcross of the 0.5 line, and the green arrow, a downcross of the -0.5 line.
The following Filter Report includes the required formulas and filters:
NAME: Inverse Fisher Transform of RSI
DESCRIPTION:
UNITS TO READ: 300
FORMULAS
[1] Symbol
[2] Cross 0.5 Daily(5)
  [1]: 1 * (CG&1-50)
[2]: [1]W9
[3]: ((2 * [2]U10)-1) / ((2 * [2]U10)+1)
[4]: 0.5
[5]: ([3]-[4])U2-Ty1
{Comment: Returns 1 if the IFT crosses from below to above 0.5 and -1 if it crosses
from above to below}
[3] Cross -0.5 Daily(5)
[1]: 1 * (CG&1-50)
[2]: [1]W9
[3]: ((2 * [2]U10)-1) / ((2 * [2]U10)+1)
[4]: -0.5
[5]: ([3]-[4])U2-Ty1
{Returns 1 if the IFT crosses from below to above -0.5 and -1 if it crosses from above to below}
[4] Cross 0.5 weekly(5)
[1]: 1 * (CG&1-50)
[2]: [1]W9
[3]: ((2 * [2]U10)-1) / ((2 * [2]U10)+1)
[4]: 0.5
[5]: ([3]-[4])U2-Ty1
{This formula has the compression set to Weekly. Returns 1 if the IFT crosses from below to
 above 0.5 and -1 if it crosses from above to below}
[5] Cross -0.5 Weekly(5)
[1]: 1 * (CG&1-50)
[2]: [1]W9
[3]: ((2 * [2]U10)-1) / ((2 * [2]U10)+1)
[4]: -0.5
[5]: ([3]-[4])U2-Ty1
{ This formula has the compression set to Weekly. Returns 1 if the IFT crosses from below to
 above -0.5 and -1 if it crosses from above to below}
 [6] Close
       c
FILTERS
       [1]  Bullish Daily  [2] = 1 ^ [3]=1
       [2]  Bearish Daily  [2] = -1 ^ [3]=-1
       [3]  Bullish Weekly  [4] = 1 ^ [5]=1
       [4]  Bearish Weekly  [5] = -1 ^ [5]=-1
The following formula can be used to chart the inverse Fisher transform
of the RSI with the two limit lines:
FORMULA - InverseFisherTransformofRSI
SWITCHES: multiline
PARAMETERS: 5
FORMULA:
[1]: 1 * (CG&1-50)
[2]: [1]W9
[3]: ((2 * [2]U10)-1) / ((2 * [2]U10)+1) {c}{NInvFish}{a}{nc}  {rgb#255}
[4]: 0.5  {c}{rgb#0}
[5]: -0.5 {c}{rgb#0}
Visit the new home of TechniFilter Plus at www.technifilter.com to download
these reports and formulas.
--Benzie PikoosBACK
Brightspark
Tel +61 8 9375-1178, sales@technifilter.com
www.technifilter.com
eSIGNAL: Inverse Fisher Transform
This eSignal code is based on John Ehlers' article in this issue, "The
Inverse Fisher Transform."
// Magazine: Technical Analysis of Stocks & Commodities, May 2004
// Article: The Inverse Fisher Transform by John F. Ehlers
// Study: INVERSE FISHER TRANSFORM OF RSI
// Provided By: TS Support, LLC for eSignal
var RSI = null;
function preMain(){
    setStudyTitle("INVERSE FISHER TRANSFORM OF RSI");
    setCursorLabelName("IFish",0);
    setDefaultBarFgColor(Color.red,0);
    addBand(.5, PS_SOLID, 1, Color.black);
    addBand(-.5, PS_SOLID, 1, Color.black);
    setDefaultBarThickness(2);
    setComputeOnClose();
}
function main(){
    wmaLength = 9;
    rsiLength = 5;
    if (RSI == null) RSI = new RSIStudy(rsiLength,"close");
    var IFish = 0, WtdSum = 0 ;
    Value1 = .1 * (RSI.getValue(RSIStudy.RSI) - 50);
    for(i = 0; i < wmaLength; i++)
        WtdSum += (wmaLength - i) * (.1 * (RSI.getValue(RSIStudy.RSI,-i) - 50)) ;
    CumWt = (wmaLength + 1 ) * wmaLength * .5 ;
    Value2 = WAverage = WtdSum / CumWt ;
    IFish = (Math.exp(2 * Value2) - 1) / (Math.exp(2 * Value2) + 1);
    return IFish;
}
// Magazine: Technical Analysis of Stocks & Commodities, May 2004
// Article: The Inverse Fisher Transform by John F. Ehlers
// Study: CYBER CYCLE WITH INVERSE FISHER TRANSFORM
// Provided By: TS Support, LLC for eSignal
var Smooth_1 = 0;
var Smooth_2 = 0;
var Cycle_1 = 0;
var Cycle_2 = 0;
function preMain(){
    setStudyTitle("CYBER CYCLE WITH INVERSE FISHER TRANSFORM");
    setCursorLabelName("Cycle",0);
    setDefaultBarFgColor(Color.green,0);
    setDefaultBarThickness(2);
    setComputeOnClose();
}
function main(alpha){
    if(alpha == null) alpha = .07;
    var Smooth = 0, Cycle = 0, ICycle = 0;
    Smooth = ((high() + low()) / 2 + high(-1) + low(-1) + high(-2) + low(-2) + (high(-3) + low(-3)) / 2 ) / 6;
    Cycle = (1 - .5 * alpha) * (1 - .5 * alpha) * (Smooth - 2 * Smooth_1 + Smooth_2) + 2 * (1 - alpha) *
              Cycle_1 - (1 - alpha) * (1 - alpha) * Cycle_2;
    if(getCurrentBarIndex() - getOldestBarIndex() < 7)
    Cycle = ((high() + low()) / 2 - high(-1) - low(-1) + high(-2) + low(-2)) / 4;
    ICycle = (Math.exp(2 * Cycle) - 1) / (Math.exp(2 * Cycle) + 1);
    Smooth_2 = Smooth_1;
    Smooth_1 = Smooth;
    Cycle_2 = Cycle_1;
    Cycle_1 = Cycle;
    return ICycle;
}
-- Raphel Finelli
eSignal, a division of Interactive Data Corp.
800 815-8256, www.esignal.com
All rights reserved. © Copyright 2004, Technical Analysis, Inc.
Return to May 2004 Contents

