Home On The (Trading) Range (Bars)
Trading Range Bars
There are different ways to chart price movements. Here we look at range bars and how they help identify the underlying trend.
Bar charts, candlestick charts, and line charts are the most popular when it comes to charting, but what about range bars? Range bars are a unique way of building price charts and are excellent in finding the underlying trend and movement of the current bar. Since each bar on the chart has the same range (high to low), it reduces the volatility and noise within the range of the bar.
Range bars are generated continuously as a new tick is formed outside the minimum price range. They are closely related to point & figure or renko charts, which are also based on equal price range change. The range bar chart is a study of pure price movement, and time is not taken into consideration while plotting the price action. Range bar movement is not time-dependent but does depend on price movement when a preset range of a price bar is complete; hence, the time axis (x-axis) on a range bar chart is irrelevant.
When range bars are constructed, chart dependency on the time scale (x-axis) has been removed as it produces its own price scale on the y-axis. This helps remove gaps and produce clear levels of support & resistance. Range bars also work with other trend indicators, all instruments, and all time frame trading. Range bar charts are great for observing active market activity and are helpful in identifying support & resistance lines, buy/sell signals, and trendlines.
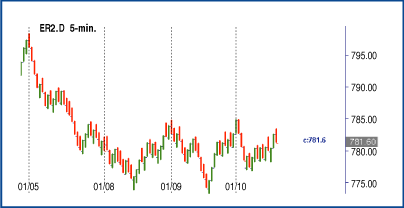
In Figure 1 you see a five-minute chart of the emini Russell 2000 (ER2)
with two-point range bars. The chart shows fewer bars than the regular
five-minute bar chart while displaying key resistance & support levels.

FIGURE 1: FIVE-MINUTE CHART OF THE EMINI RUSSELL 2000 WITH TWO-POINT RANGE BARS. There are fewer bars on this chart than there would have been on the similar bar chart. Also, note there are clear support & resistance levels.
...Continued in the June issue of Technical Analysis of STOCKS
& COMMODITIES
Excerpted from an article originally published in the June 2007 issue
of Technical Analysis of
STOCKS & COMMODITIES magazine. All rights reserved. © Copyright
2007, Technical Analysis, Inc.
Return to June 2007 Contents