Access to foreign exchange trading has opened up exciting trading options for the retail trader. You can now trade alongside corporations and institutions in a highly liquid market that is global, traded around the clock, and highly leveraged. Before jumping into this market,
however, we must understand the factors that affect the forex market. With that in mind, STOCKS& COMMODITIES has introduced Forex Focus to better prepare the retail trader to participate in the currency market.
Slingshot Reversals In Forex
Position yourself in the foreign exchange market using a reliable chart pattern.
by Brent Donnelly
A reliable trading pattern in foreign exchange markets is the false break and reverse, or slingshot reversal pattern. In this article I will introduce the slingshot reversal, discuss how the pattern is traded, and provide a recent example from the AUD/USD (Australian dollar) market.
A slingshot reversal occurs when a major support is broken but the price does not hold and the market then reverses, going back up through the old support level. Here I am referring to a broken support but everything described also applies to the opposite formation, where resistance breaks and the rally fails and reverses back below the resistance.
This pattern works so well because the downside break of the major technical level clears existing long positions and creates new weak shorts. The large number of breakout systems and momentum models in foreign exchange further enhances the reliability of the structure. The slingshot reversal pattern is not unique to forex markets, however. The pattern can be exploited profitably in other markets as well; entry/exit parameters need to be adjusted for other commodities, but the concepts are identical.
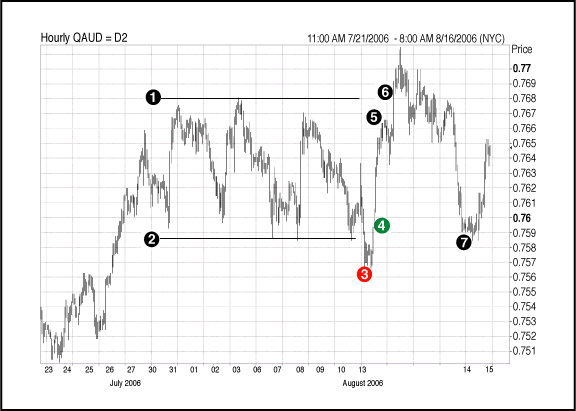
Figure 1 shows a textbook slingshot reversal. From July 27 to August 8, 2006, the Australian dollar traced out a boring range between 0.7585 and 0.7685 (points 1 and 2). Many traders were excited about the possibility of a breakdown below 0.7585. Finally, on August 8, the aussie broke lower (point 3). This created a wave of new selling as longs cut their positions, new shorts entered, and black box models sold the technical break.
Then a slingshot reversal took place. As the sellers ran out of bullets below 0.7585, buyers gained the upper hand, and soon, the AUD/USD started ripping higher (4). The rapid reversal took the Australian unit back toward the top of the range before a brief failure (5), then a topside break (6). Finally, the slingshot lost momentum and the aussie dropped all the way back to the old support (7) before bouncing.FIGURE 1: A SLINGSHOT REVERSAL IN THE AUSTRALIAN DOLLAR. On this hourly chart of the AUD/USD you can see that the slingshot reversal took place at the area labeled (4).
HOW TO TRADE THE SLINGSHOT
Trade the slingshot reversal as follows:
• Identify a significant level that many traders are watching (in this
example, the support at 0.7585)
• Wait for the market to trade 10 points below the key level, then
put a stop entry order 10 pips above. So when 0.7575 trades, input an order
to stop enter; buy AUD/USD @ 0.7595 (point 4)
• If done, stop-loss out of the position five pips under the previous
low (in this case, 0.7563 is the low, so stop at 0.7558) (point 3)
• You calculate the take-profit by taking the potential loss and multiplying
it by 3 to create a 3-to-1 risk/reward. Here, the take-profit is (0.7595
? 0.7563) x 3 + 0.7595 = 0.7691.
Note that after the topside range break, there was another profitable slingshot reversal opportunity as AUD/USD fell, reentering the range, breaking back below 0.7685 and hitting 0.7585 again (7). Note that the old support at 0.7585 (7) held; the aussie did not make another attempt at 0.7563. This is normal and the level originally established before the false break tends to be support when revisited.
The slingshot reversal is a highly reliable pattern with a strong logic because of its effect on market positioning. Look for major levels that could yield slingshot reversals. The more that people are talking about a particular level, the better your odds of finding a slingshot.
Brent Donnelly trades the Australian, Canadian, and New Zealand dollars for Lehman Brothers New York. He has been trading foreign exchange for seven years. He also traded equities for five years and created a television cartoon, which aired nationally in Canada. His approach to the markets is primarily technical and he relies heavily on intermarket analysis. He may be reached at brent.donnelly@lehman.com.
SUGGESTED READING
Yoder, Bo [2002]. "Moving Averages And The Slingshot Effect," Technical
Analysis of STOCKS & COMMODITIES, Volume 20: June.
-MetaStock (Equis International)
Return to June 2007 Contents
Originally published in the June 2007 issue of Technical Analysis
of STOCKS & COMMODITIES magazine. All rights reserved. © Copyright
2007, Technical Analysis, Inc.
