For those traders who want a clear and brief explanation of various concepts often touched on in technical analysis and trading, we offer Traders' Notes.
THE STOCHASTIC OSCILLATOR
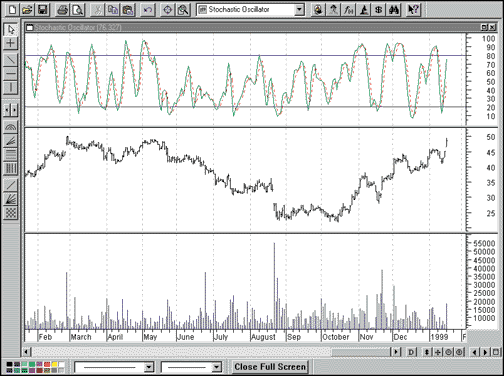
Developed by George C. Lane, the stochastic is a member of the oscillator family. It is most commonly used to identify overbought and oversold conditions, as well as divergence between the oscillator and the price. The stochastic plot consists of two lines, a dashed line referred to as %K and a solid %D line (see Figure 1). Currently, there are a number of interpretations of stochastics, but Lane intended the divergence of the stochastic indicator with stock price as the basis on which to take action.
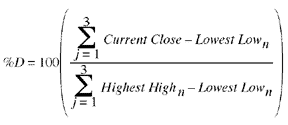
Many technical analysis software programs include stochastics as one of the indicators, and there are many different ways that the %K and %D can be calculated. The formulas for the %K and %D lines are as follows:FIGURE 1: AUTODESK, INC. During the August to October bottom, the stochastic oscillator was diverging, making a series of higher lows.


In both calculations, the number of periods n can be varied to give different sensitivities to the two lines. In calculating the %D line, the method of calculation shown here is the ratio of the three-period sum of the numerator and denominator. A moving average (simple, exponential, weighted, and so forth) can also be used with a different lookback period.
Analyst John Murphy, in his Technical Analysis Of The Financial Markets, recommends using a 14-period %K line with a three-period %D line, and looking for divergence between stochastic and price as a signal. A bearish setup is a combination of two declining highs for %D at values greater than 80; when this occurs, prices continue to climb higher and a bearish divergence exists. A bullish setup is %D with values less than 20; when rising lows form, prices continue lower and a bullish divergence exists, indicating a buy. If the setup is correct, then the actual buy or sell signal occurs when the faster %K crosses the %D.
Oscillators are effective in trading ranges, not trends. In a trading range, as the price moves back and forth between support and resistance, the oscillator should indicate an oversold condition at the lower side of the range and an overbought situation at the upper side of the range. In contrast, during a trend -- either up or down -- the oscillator will prematurely indicate an extreme in price, positioning the trader against the prevailing trend. In all, it is best to use the stochastic with other technical tools.
Instead, a suggested indicator for a trend condition would be the average directional movement (ADX). Many traders use the ADX indicator to measure the degree of trend to the market. A rising ADX indicates that the market is likely to be in a trend, and oscillators should not be considered.
FURTHER READING
Blau, William [1991].
"Double Smoothed-Stochastics," Technical Analysis of STOCKS
&
COMMODITIES, Volume 9: January.
Keel, Cynthia, and Heidi Schmidt [1987].
"Using Stochastics," Technical Analysis of STOCKS
&
COMMODITIES, Volume 5: July.
Kepka, John F. [1985].
"Trading With Arima And stochastics," Technical Analysis of STOCKS
&
COMMODITIES, Volume 3: June.
Lundgren, David [1993].
"Stochastics Indicators And Trading," Technical Analysis of STOCKS
&
COMMODITIES, Volume 11: March.
Lupo, Louis M. [1994].
"Trading Markets With Stochastics," Technical Analysis of STOCKS
&
COMMODITIES, Volume 12: December.
Mason, William [1989].
"Variable Sensitivity Stochastics," Technical Analysis of STOCKS
&
COMMODITIES, Volume 7: March.
Meibuhr, Stuart [1992].
"Multiple-Length Stochastics," Technical Analysis of STOCKS
&
COMMODITIES, Volume 10: December.
Murphy, John J. [1999].
Technical Analysis Of The Financial Markets, New York Institute
of Finance.
Schwager, Jack [1987].
"In Search Of The Perfect System," Technical Analysis of STOCKS
&
COMMODITIES, Volume 5: February.