Novice Traders’ Notebook
Indicators
1. Moving Averages: Signals
How can I use moving averages to signal buy and sell points?
Moving averages are the basis for many effective entry and exit strategies. These methods range from the very simple using only one moving average to complex methods involving combinations of moving averages. One of the simplest methods uses the crossing of price and a single moving average as a signal. Another method uses the crossing of two simple moving averages (SMA) of different lengths. Let’s take a closer look at that one, which is shown below.
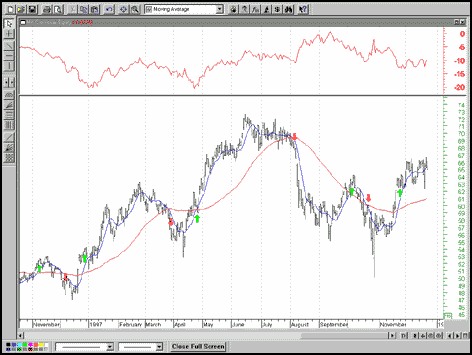
COCA-COLA.
The figure above shows the daily bar chart for Coca-Cola to which an 8-day simple moving average (blue) and a 50-day simple moving average (red) have been added. The red arrows indicate a short position corresponding to the 8-day SMA dropping below the 50-day SMA. The green arrows indicate a long position corresponding to the eight-day SMA crossing above the 50-day SMA. The arrows simultaneously signal closing the existing position, which is on the opposite side of the market relative to the new signal. This is known as stop-and-reverse (SAR).
The smaller window above the price bars is the hypothetical equity line as calculated by MetaStock’s SystemTester. Notice that for the period tested (1/93–11/98) this system hypothetically lost money even before factoring in expenses. One challenge for the technician is to determine a strategy and parameters for that strategy, which minimize risk and maximize expectancy for a chosen market. STOCKS & COMMODITIES frequently runs articles for all levels of traders/investors that can address this challenge.