Novice Traders’ Notebook
Cardinal Reversal Patterns — At Bottoms
3. The Rounding Bottom
When a stock undergoes a bearish price trend, that trend will often end with a whimper, not a bang. Why? Because the problems facing the company, and the company’s inability to cope with them that led to the disappointing results, will not be corrected overnight. A considerable amount of time can pass as management retreats and develops new strategies to return value to the shareholders, during which time the stock’s price trend is under pressure. Usually, new management, new product lines and the formulation of a new marketing plan are the result, and then the company’s earnings begin to grow again.
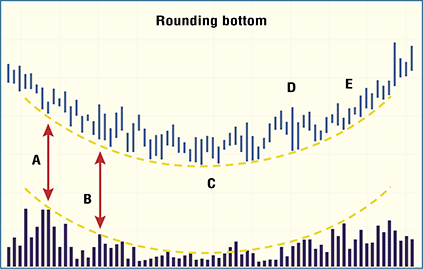
How might such a scenario appear on the stock’s price chart? The rounding bottom would be the typical pattern describing the process of a company regrouping after a series of business missteps. The rounding bottom is the end of the downtrend, and before its first signs are noted, usually the price has been falling, with the sellers aggressively pressing the market lower and the volume running high (A). Then there is a subtle shift; the prices continue to trend lower, and the volume peak levels begin to recede (B). Each new low in price is accompanied by a lower level in volume, with the evidence pointing to the abatement of selling pressure. The buyers are not yet aggressive as the underlying fundamentals do not warrant it, but at the same time, investors’ attitudes are in the process of shifting.

At some point, the sellers and buyers enter into a standoff (C) as shown by the price action; then slowly, the buyers gain the upper hand. It may even occur as a strong sign of demand without a quick followthrough (D), as the base is still building. Throughout this process, the volume pattern follows the price pattern. As prices begin to enter into an uptrend as a series of higher highs and higher lows (E) and the news turns decidedly positive, the rounding bottom pattern is finished.