Novice Traders’ Notebook
Cardinal Reversal Patterns — At Tops
5. The Triangle Top
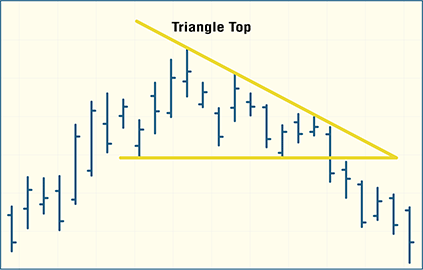
The descending triangle, one of the two types of right-angle triangle patterns, can signal the reversal of an uptrend in the market being charted. When the descending triangle forms after a runup in the security price, followed by a decline in price, the chart pattern acts as a triangle top. As the pattern shows, the descending triangle is formed by a series of lower highs and relatively equal lows.

DESCENDING TRIANGLE TOP. A trendline drawn connecting the descending peaks, intersecting with the trendline connecting the valleys, forms a descending triangle. When this pattern occurs after a runup in prices, followed by a breakout to the downside from within the triangle formation, it is called a triangle top.
The minimum number of lows and highs required to form the descending triangle, or any triangle for that matter, is two of each, for a total of four. A trendline is drawn connecting the descending peaks, and another trendline is drawn connecting the valleys. Each trendline is extended to the right until they intersect. The relationship of the two trendlines, relative to each other, gives the appearance of a triangle. The descending triangle is referred to as a right-angle triangle because if a vertical line is drawn at the wide open end of the formation connecting the two trendlines, a right-angle triangle is formed.
The successive lower highs forming the descending side of the triangle indicates more aggressive selling than buying. Frequently, price will break out to the downside after a number of reversals (minimum of four) within the bounds of the two trendlines. Breakouts usually occur after moving about two-thirds to three-quarters of the distance between the start of the formation and the apex, but there are exceptions. In addition, price can break out to the upside, in which case the pattern becomes a continuation pattern rather than a reversal pattern.
It is not uncommon for prices to retrace back to the trendline after breaking out of the triangle and then reverse again, continuing in the direction of the breakout. The breakout is considered to have failed if prices move significantly back into the triangle pattern, which does happen occasionally. Volume, typically heavier at the beginning of the pattern, decreases as price moves toward the apex and then increases during the breakout.