INDICATORS
Market Breadth And Market Direction
How Accurate Is The A/D Line?
by Lawrence G. McMillan
Maybe not as accurate as you think. Here's one way to get more realistic results.
For much of 2001 - especially the first eight months of the year - market technicians were often quoted as saying that market breadth was strong and, by inference, that there was an underlying positive tone to the market. The indicator often used to demonstrate this was the advance-decline (A/D) line - the daily difference between advancing and declining New York Stock Exchange (NYSE) issues. There were more advances than declines for quite a few days in that time period, yet the market continued to struggle. So where was all this supposedly positive action?
THE PROBLEM WITH A/D
During most of this period of positive market breadth, the major indices were in decline - big-cap as well as small-cap. So if there was supposedly such great breadth on the NYSE, where was it going? The answer is that the NYSE A/D figures, while technically correct, can be extremely misleading. The problem lies in that approximately 48% of the NYSE issues are not operating companies, but funds or preferred stocks, many of which are more closely related to interest rates than they are to general market movements. As a result, many indicators based on the advance-decline line must be scrutinized carefully.
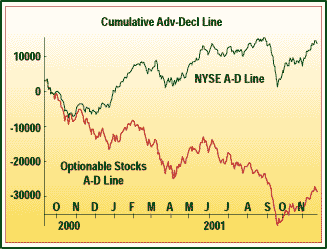
In order to demonstrate more clearly what was going on in the market, some other measure of advances and declines needed to be used. I decided to create my own version of the A/D line, using operating companies that trade options. Most of the stocks in our database are those of real companies. A few exchange-traded fundsÝ are involved (SPY, DIA, QQQ), but very few.

Figure 1: Cumulative advance-decline line. There is a significant difference between these lines. From March to September 2001, a divergence is evident.
...Continued in the April 2002 issue of Technical Analysis of STOCKS & COMMODITIES
Excerpted from an article originally published in the April 2002 issue of Technical Analysis of STOCKS & COMMODITIES magazine. All rights reserved. © Copyright 2002, Technical Analysis, Inc.
Return to April 2002 Contents