INDICATORS
Momentum Indicators Don't All Necessarily Tell The Same Story
Do Momentum Indicators Follow Trends?
by Clive Roffey, Ph.D.
Do momentum indicators follow trends, or are they independent of them?
The stochastic oscillator, relative strength index (RSI), rate of change (ROC), and moving average convergence/divergence (MACD) are some of the most commonly used indicators. It's not surprising to find traders lumping them all together into the generic category of "momentum indicators." Although each indicator is recognized as having its own distinctive characteristics, it is often assumed, misleadingly, that they can be interpreted in a similar fashion.
For example, when you extend the time frame of the rate of change indicator, its oscillation amplitude increases. But when you extend the time frame of its cousin, the RSI, the opposite happens: The amplitude decreases. This occurs to the extent that the accepted 70/30 overbought and oversold levels of the RSI have to be contracted to 60/40.
Can similar interpretations be applied to stochastics and RSI, which act with fixed upper and lower limits at 100 and zero, while the MACD and ROC momentum oscillators have no limits to their movement? And why is it that after increasing the time frame for the stochastic, it continues to operate happily between its zero and 100 limit levels, yet the probability of the RSI hitting the 100 or zero extremities is almost nonexistent if the time frame is greater than nine periods?

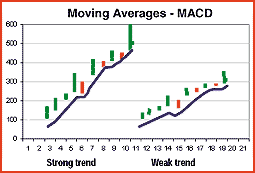
Figure 1: MACD follows the trend. The stronger the trend, the steeper the moving average, hence the steeper the MACD.
...Continued in the April 2002 issue of Technical Analysis of STOCKS
& COMMODITIES
Excerpted from an article originally published in the April 2002 issue of Technical Analysis of STOCKS & COMMODITIES magazine. All rights reserved. © Copyright 2002, Technical Analysis, Inc.
Return to April 2002 Contents